Genome size of three Brazilian flies from the Sciaridae family
Cecília Ferreira Saccuti1, Maria Albertina de Miranda Soares2, José Ricardo Penteado Falco1 and Maria Aparecida Fernandez1
1
Universidade Estadual de Maringá, Departamento de Biologia Celular e Genética, Maringá, PR, Brazil.
2
Universidade Estadual de Ponta Grossa, Departamento de Biologia Estrutural, Molecular e Genética, Ponta Grossa, PR, Brazil.
Abstract
We determined the genome size of the Brazilian sciarid flies Bradysia hygida, Rhynchosciara americana and
Trichosia pubescens(Diptera: Sciaridae) using absorbance measurements of Feulgen-stained nuclei belonging to these species (and chicken erythrocytes as a standard) to calculate the amount of DNA in picograms (pg) and the number of base pairs (bp), or C-value, for each of these species. The C-values were: 3 x 10⁸
bp (0.31 pg) forB. hygida; 3.6 x 10⁸
bp (0.37 pg) forR. americana; and 1 x 10⁹
bp (1.03 pg) forT. pubescens. The sciarids investigated in this work had considerably higher C-values than the average for previously described dipteran species, includingD. melanogaster.
Key words:genome size, Feulgen reaction, Sciaridae,Bradysia hygida,Rhynchosciara americana,Trichosia pubescens,
Brazilian flies.
Received: March 15, 2004; Accepted: March 22, 2005.
The determination of the genome size of an organism not only provides important data relevant to both the classi-fication of the organism and for comparative studies of the structural genome and evolution (Hardieet al., 2002) but is also useful in molecular biology studies such as the devel-opment of genome sequencing strategies.
In haploid genomes the amount of DNA (C-Value) is a unique characteristic of each species. The C-value is given in base pairs (bp) and can range from 105to 107bp in prokaryotes and from 107to 1011 bp in eukaryotes. Al-though this variation occurs, it is difficult to establish a re-lationship between the haploid genome size and the morphological, physiological or developmental complex-ity of an organism (Lozovskayaet al., 1999), this problem originally being known as the C-value paradox but was subsequently renamed to the C-value enigma (Gregory, 2002; 2003). The sequencing of several genomes has also shown that the gene number does not correlate with the or-ganism complexity (the G-value paradox), which can be explained by several events such as gene redundancy, alter-native splicing and post-translational modifications (Hahn and Wray, 2002).
Birds, reptiles and mammals display only a small variation in the DNA content within classes, with the ge-nome size of birds being the most conserved (Tiersch and Wachtel, 1991). However, in amphibians, fish and insects there is a wide variation in C-values between species whose apparent complexity does not vary greatly.
Among the insects whose genome size has already been determined, Drosophila melanogaster presents a compact genome of 1.8 x 10⁸bp (Adamset al., 2000) while the haploid DNA content of the fly Aedes albopictus is about sixfold larger (Lengyel and Penman, 1975), with
Laupalacrickets having a genome size eleven times larger than Drosophila (Petrov and Hartl, 2000) and Podisma pedestris, the brown mountain grasshopper, a haploid ge-nome size of 1.8 x 10¹⁰bp (Bensassonet al., 2001), the largest genome size yet reported for insects (Gregory, 2001).
In general, the known genome sizes cover only a small fraction of the total of species in each class, genome sizes having been estimated in only 2% of birds, 3% of fishes, 4% of reptiles, 7% of mammals and 8% of amphibi-ans (Gregory, 2002). The invertebrates constitute the major form of multicellular life but the genome size of only about 1,300 invertebrate species is available in Gregory’s Animal Genome Size Database (Gregory 2001). For Diptera, the genome size has been described for only 12 families,
www.sbg.org.br
Send correspondence to Maria Aparecida Fernandez. Universi-dade Estadual de Maringá, Departamento de Biologia Celular e Genética, Av. Colombo 5790, 87020-900 Maringá, PR, Brazil. E-mail: [email protected].
mainly Drosophilidae and Cullicidae, but no data is avail-able for other dipteran families such as the Sciaridae al-though insects of this family have been widely used in molecular and cell biology research (Fioriniet al., 2001; Basso Jr.et al., 2002; Monesiet al., 2003; Soareset al., 2003) and the description of their genome size is not only important in these research areas but it could also help in the solution of evolutionary questions relating to the Diptera. The aim of the study presented in this paper was to contribute to the data on insect genome size by determining the DNA content and the genome size of the Brazilian sciarids Bradysia hygida, Rhynchosciara americana and
Trichosia pubescens using absorbance measurements of Feulgen-stained neuroblast nuclei from larvae of these spe-cies.
The sciarid Bradysia hygida (Sauaia and Alves, 1968) has been reared since 1995 at the Departamento de Biologia Celular e Genética at the Universidade Estadual de Maringá, Paraná, Brazil, according to the conditions de-scribed by Laicineet al. (1984) and da Conceição Silva and Fernandez (2000). At 20 °CB. hygidahas a 36-day life cy-cle. During the larval stage of which three molts occur de-limiting four instars, the larval eyespots appearing at the sixth day of the fourth instar and are a useful marker to de-termine larval age and establish the different developmen-tal stages on this instar (Laicine et al., 1984). In our investigation we used E5 aged female larvae. TheB. hygida
genome is partitioned into four chromosome pairs (A, B, C and X), males being X0 and females XX (Borges et al., 2000).
At 20 °CRhynchosciara americana(Breuer, 1967) has a 60-day life cycle with three molts delimiting four in-stars which have no visible eyespots, because of which the developmental stages during the fourth instar have to be es-tablished by changes in the communal cocoon which ini-tially consists of a loose and transparent net but gradually changes to a more solid and white structure due to calcium carbonate deposition. Because this species only survives for three generations under laboratory conditions we col-lectedR. americanalarvae in the field and maintained them at 20 °C for one generation using the same diet as forB. hygida(Laicineet al., 1984; da Conceição Silva and Fer-nandez, 2000). For our study we sacrificed the R. americanalarvae during the 3A period (Yokosawaet al., 1999) just before the onset of DNA amplification which in this species occurs during the fourth instar.
We obtainedTrichosia pubescens(Morgante, 1969) from a larvae culture originally collected in 1973 at Mogi das Cruzes, São Paulo, Brazil (Amabis, 1983), a permanent culture of this fly being maintained by Dr. Eliana Dessen (Instituto de Biociências, Universidade de São Paulo, São Paulo, Brazil). The life cycle and instar stages of T. pubescens are similar to those described above for B. hygida, and for our investigation we used 19-day old L5 lar-vae.
Reference slides for our study were made using cells from 5-day old chickens (Gallus domesticus) obtained from a commercial animal house in Maringá city.
For neuroblast nuclei preparations, brains of E5 aged femaleB.hygidalarvae, 3A periodR. americana,and L5T. pubescenswere dissected in 50mL of 0.7% (w/v) aqueous
sodium chloride under a stereo microscope and processed as described by Borges et al. (2000) and Gaspar et al. (2002). Briefly, 10 larvae brains were transferred to a 5 mL petri dish with 1% (w/v) hypotonic aqueous trisodium ci-trate for 10 min, changing the solution once during this time. The brains were then fixed in 3:1 methanol:acetic acid for 1 h at room temperature and the fixative changed at 15 min intervals. After fixation slides were prepared by transferring two brains to a slide and squash mounting them in a drop of 45% (v/v) aqueous acetic acid under a coverslip, which was subsequently removed by freezing the slide in liquid nitrogen and flipping the coverslip off with a razor blade. The slides were then fixed again in 3:1 etha-nol:acetic acid for one hour at 4 °C, air dried and stored at 4 °C until staining.
Chicken erythrocytes slides were obtained as de-scribed by Falcoet al., (1999). Briefly, 10 mL of blood was collected in 2 mL of 0.9% (w/v) aqueous sodium chloride supplemented with 0.24 M EDTA and slides prepared by the spread method. The chicken erythrocytes slides were fixed in 3:1 ethanol: acid acetic for 1 min for theB. hygida
and R. americana experiments or 1.75% paraformal-deyde/0.1% glutaraldeyde in 0.1 M phosphate buffer pH 7.4 for 15 min for theT. pubescensexperiments, washed in 70% (v/v) aqueous ethanol for 5 min, air dried and stored at 4 °C until staining.
All staining procedures were performed at the same time and with the same solutions for each group. The slides were hydrated in 50%, 30%, 10% (v/v) ethanol and distilled water (5 min at each concentration) and DNA depurini-zation carried out in 4N hydrochloric acid at 25 °C for 25 min (established previously, data not shown). The slides were then washed in distilled water for one minute and stained with Schiff’s reagent for 30 min at 25 °C. After staining, the slides were incubated in two changes of sul-phurous water for a total of 30 min, after which the prepara-tions were washed three times in distilled water for 2 min, dehydrated in serial baths of 50%, 70%, and absolute etha-nol and finally incubated for 2 min in 1:1 ethaetha-nol:xylol and then pure xylol. The preparations were then covered with a coverslip in immersion oil.
San Antonio, Texas and available from the Internet by anonymous FTP (ftp://maxrad6.uthscsa.edu). This tool al-lowed us to measure the gray values of each nucleus, the re-sulting integrated densitometry data being analyzed using Microsoft®Excell®software.
The determination of the genome size of the sciarids
B. hygida,R. americanaandT. pubescenswas performed by absorbance measurements of Feulgen-stained nuclei, this study being performed in three groups (B. hygida
(group 01), R. americana (group 02), and T. pubescens
(group 03) with a set ofG. domesticusslides being pro-cessed at the same time.
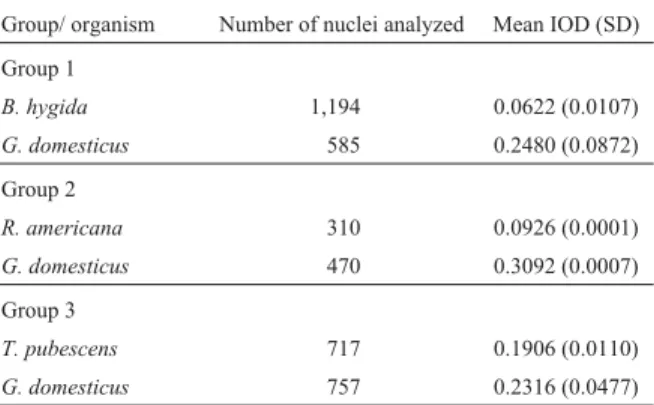
Slide images were captured and the nuclei Feulgen-DNA integrated optical density (Feulgen-Feulgen-DNA IOD) deter-mined, the mean and standard deviation of which are shown in Table 1. These data allowed us to determine the C-value and the genome size using simple calculations. The C-value ofG. domesticusis well known and contains 1.25 pg of DNA (Smith and Burt, 1998). The comparison between the Feulgen-DNA IOD of the sciarids andG. domesticus re-sulted in a C-value of 0.31 picograms of DNA for B. hygida, 0.37 forR. americanaand 1.03 forT. pubescens. (Table 2). The next step was to convert these values to base pair. According to Dolezelet al.(2003), the number of base pairs is equivalent to the mass in picograms multiplied by 0.978 x 10⁹. The processed data resulted in a genome size of 3 x 10⁸bp for
B. hygida, 3.6 x 10⁸bp for
R. americana,and 1 x 10⁹bp forT. pubescens.
Fluorescence DNA quantification analysis of B. hygidasalivary gland polytene nuclei from larvae at the end of the larval stage (Paçó-Larson, 1976) showed values
con-sistent with ours. During larval development B. hygida
polytene nuclei undergo 12 replication cycles plus an addi-tional replication for the S1 gland region (21% more DNA) that results in a DNA content of 3 ng. If theB. hygida dip-loid genome DNA content obtained by us (0.62 pg, equiva-lent to 6.2 x 10⁻⁴ng) is submitted 12 replication cycles plus an additional 21% replication the final result is the same value as that reported by Paçó-Larson (1976) for polytene nuclei.
The previous name for R. americana was
Rhynchosciara angelae, and determination of the R. angelaegenome size by indirect methods (Balsamoet al., 1973) showed a smaller genome size than that calculated by us. Results from biochemical analysis revealed a genome
Table 1- Mean Feulgen-DNA integrated optical density (IOD) values and standard deviation (SD) forBradysia hygida,Rhynchosciara americana,
Trichosia pubescensandGallus domesticus.
Group/ organism Number of nuclei analyzed Mean IOD (SD)
Group 1
B. hygida 1,194 0.0622 (0.0107)
G. domesticus 585 0.2480 (0.0872)
Group 2
R. americana 310 0.0926 (0.0001)
G. domesticus 470 0.3092 (0.0007)
Group 3
T. pubescens 717 0.1906 (0.0110)
G. domesticus 757 0.2316 (0.0477)
Table 2- C-value of some representative Diptera species.
Family Organism C-value (pg) Method Cell type Standard Reference
Anthomyiidae Delia antiqua 0.73 FD NS (V) NS Hartman and Southern, 1995
Calliphoridae Calliphora erytrocephala 0.65 FD SP MD Bier and Müller, 1969
Cecidomyiidae Mayetiola destructor 0.09 NS NS NS Maet al., 1992
Chaoboridae Chaoborus americanus 0.40 FD SP GD Rao and Rai, 1990
Chironomidae Chironomus tentas 0.25 BCA SG - Daneholt and Edström, 1967
Culicidae Aedes aegypti 0.81 FD SP GD Rao and Rai, 1987
Dixidae Dixa obscura 0.16 FD TS MD Jost and Mameli, 1972
Drosophilidae Drosophila melanogaster 0.18 FD HC, SP GD Raschet al., 1971
Muscidae Musca domestica 1.04 NS NS NS Petitpierre, 1996
Psychodidae Telmatoscopus meridionalis 0.24 FD TS MD Jost and Mameli, 1972
Sarcophagidae Sarcophaga bullata 0.76 FD TS GD Samols and Swift, 1979
Sciaridae Bradysia hygida 0.31 FD BR GD Present paper
Sciaridae Rhynchosciara americana 0.37 FD BR GD Present paper
Sciaridae Trichosia pubescens 1.03 FD BR GD Present paper
Simuliidae Prosimulium multidentatum 0.19 BCA WB - Sohnet al., 1975
size of 2.1 x 10⁸bp (Balsamoet al., 1973) but since the value of theE. coligenome used as reference was 4 x 10⁶bp and not 4.7 x 10⁶bp (Blattneret al., 1997) theR. americana
genome may be larger than previously described.
There is no data in the literature on the polytene nu-cleus content ofT. pubescensthat could be compared to our results. However, the amount of DNA in the nuclei of dif-ferent tissues of Sciara coprophila was determined by cytospectrophotometry to be about 2 pg by Rasch (1970).
The sciarids used in our work present considerably greater C-values than the average C-values of representa-tives dipteran species already described and also greater than the genome size (0.18 pg) of the model organismD. melanogaster(Table 2; Gregory, 2001). It is interesting to note that the largest C-values in Table 2 are for T. pubescensandMusca domestica.
Only a small number of sequences of the total ge-nome is involved in coding and there is a considerable pres-ence of non-coding sequpres-ences such as pseudogenes, transposable elements and repetitive sequences in general (Petrov, 2001; Prokopowich et al., 2003). According to Hancock (2002), transposable elements and the accumula-tion of repetitive sequences are the main genetic mecha-nisms responsible for variations in genome size.
The reported size of a genome can be affected by other genetic mechanisms such as, mutation components,
e.g.polyploidy, fixation of accessory chromosomes, large duplications or chromosome deficiencies (Lozovskayaet al., 1999; Petrov et al., 2000). The genetic mechanisms contributing to the C-value paradox can sometimes be clas-sified as selection components,e.g., a genome cannot be smaller than the necessary size needed to include all the es-sential genes, nor can it be so big as to require excess en-ergy to maintain itself (Lozovskayaet al., 1999).
Petrovet al. (2000) have pointed out that in evolu-tionary terms variations in genome size can be explained by assuming that organisms with larger genomes have exhib-ited low rates of DNA elimination over thousands of years. This extra DNA has functions such as codification of teins or participation on the direct regulation of that pro-cess, or even unknown function (Kimuraet al., 2001).
The importance of the gene number (G-value) has been reported in some studies (Betrán and Long, 2002). It is known thatAedes albopictushas 6 times more DNA than
D. melanogasteralthough both species present the same level of gene expression, with 3,000 to 4,000 mRNA se-quences having been observed in cultured cells of both of these species (Lengyel and Penman, 1975). Such data sup-ports the G-value paradox, which states that the genome size is independent of the number of coding sequences.
The high DNA content observed by us in the genomes of the sciaridsB. hygida,R. americanaandT. pubescensis interesting and needs to be investigated, possibly by the analysis of repeated sequences.
Acknowledgments
We thank Valmir Peron and Marli Licero Schuete Silva for their dedicated technical assistance with the cul-ture ofB. hygidaandT. pubescens. We are also grateful to Dr. Eliana Maria Beluzzo Dessen (Universidade de São Paulo) for theT. pubescenslarvae and Márcia Graeff (Fa-culdade de Medicina de Ribeirão Preto, USP) for micros-copy facilities. CFS receives a graduate fellowship from the Brazilian agency Conselho Nacional de Desenvolvimento Tecnológico (CNPq). This work was supported by grants from CNPq, Fundação Araucária and The Third World Academy of Sciences (TWAS).
References
Adams MD, Celniker SE, Holt RA, Evans CA, Gocayne JD, Amanatides PG, Scherer SE, Li PW, Hoskins RA, Galle RF, George RA, Lewis SE, Richards S, Ashburner M, Henderson SN, Sutton GG, Wortman JR, Yandell MD, Zhang Q, Chen LX, Brandon RC, Rogers YH, Blazej RG, Champe M, Pfeiffer BD, Wan KH, Doyle C, Baxter EG, Helt G, Nelson CR, Gabor GL, Abril JF, Agbayani A, An HJ, Andrews-Pfannkoch C, Baldwin D, Ballew RM, Basu A, Baxendale J, Bayraktaroglu L, Beasley EM, Beeson KY, Benos PV, Berman BP, Bhandari D, Bolshakov S, Borkova D, Botchan MR, Bouck J, Brokstein P, Brottier P, Burtis KC, Busam DA, Butler H, Cadieu E, Center A, Chandra I, Cherry JM, Cawley S, Dahlke C, Davenport LB, Davies P, de Pablos B, Delcher A, Deng Z, Mays AD, Dew I, Dietz SM, Dodson K, Doup LE, Downes M, Dugan-Rocha S, Dunkov BC, Dunn P, Durbin KJ, Evangelista CC, Ferraz C, Ferriera S, Fleischmann W, Fosler C, Gabrielian AE, Garg NS, Gelbart WM, Glasser K, Glodek A, Gong F, Gorrell JH, Gu Z, Guan P, Harris M, Harris NL, Harvey D, Heiman TJ, Hernandez JR, Houck J, Hostin D, Houston KA, Howland TJ, Wei MH, Ibegwam C, Jalali M, Kalush F, Karpen GH, Ke Z, Kennison JA, Ketchum KA, Kimmel BE, Kodira CD, Kraft C, Kravitz S, Kulp D, Lai Z, Lasko P, Lei Y, Levitsky AA, Li J, Li Z, Liang Y, Lin X, Liu X, Mattei B, McIntosh TC, McLeod MP, McPherson D, Merkulov G, Milshina NV, Mobarry C, Morris J, Moshrefi A, Mount SM, Moy M, Murphy B, Murphy L, Muzny DM, Nelson DL, Nelson DR, Nelson KA, Nixon K, Nusskern DR, Pacleb JM, Palazzolo M, Pittman GS, Pan S, Pollard J, Puri V, Reese MG, Reinert K, Remington K, Saunders RD, Scheeler F, Shen H, Shue BC, Siden-Kiamos I, Simpson M, Skupski MP, Smith T, Spier E, Spradling AC, Stapleton M, Strong R, Sun E, Svirskas R, Tector C, Turner R, Venter E, Wang AH, Wang X, Wang ZY, Wassarman DA, Weinstock GM, Weissenbach J, Williams SM, WoodageT, Worley KC, Wu D, Yang S, Yao QA, Ye J, Yeh RF, Zaveri JS, Zhan M, Zhang G, Zhao Q, Zheng L, Zheng XH, Zhong FN, Zhong W, Zhou X, Zhu S, Zhu X, Smith HO, Gibbs RA, Myers EW, Rubin GM, Venter JC. (2000) The genome sequence of
Drosophila melanogaster. Science 287:2185-2195. Amabis JM (1983) The polytene chromosomes of the salivary
gland ofTrichosia pubescens(Diptera, Sciaridae). Rev Bras Genet 7:415-424.
Balsamo J, Hierro JM, Birnstiel ML and Lara FJ (1973)
com-plexity and transcription of repetitive sequences. Basic Life Sci 1:101-122.
Basso Jr LR, Vasconcelos C, Fontes AM, Hartfelder K, Silva JA Jr, Coelho PS, Monesi N and Paçó-Larson ML (2002) The induction of DNA puffBhC4-1gene is a late response to the increase in 20-hydroxyecdysone titers in last instar dipteran larvae. Mech Dev 110:15-26.
Bensasson D, Petrov DA, Zhang DX, Hartl DL and Hewitt GM (2001) Genomic gigantism: DNA loss is slow in mountain grasshoppers. Mol Biol Evol 18:246-253.
Betrán E and Long M (2002) Expansion of genome coding re-gions by acquisition of new genes. Genetica 115:65-80. Bier K and Müller W (1969) DNA-Messungen bei Insekten und
eine Hypothese über retardierte Evolution und besonderen DNA-Reichtum in Tierreich. Biologisches Zentralblatt 88:425-449.
Blattner FR, Plunkett G 3rd, Bloch CA, Perna NT, Burland V, Riley M, Collado-Vides J, Glasner JD, Rode CK, Mayhew GF, Gregor J, Davis NW, Kirkpatrick HA, Goeden MA, Rose DJ, Mau B and Shao Y (1997) The complete genome sequence ofEscherichia coliK-12. Science 277:1453-1474. Borges AR, Gaspar VP and Fernandez MA (2000) Unequal X chromosomes inBradysia hygida (Diptera, Sciaridae) fe-males: Karyotype assembly and morphometric analysis. Genetica 108:101-105.
Breuer ME (1967) Cromossomos politênicos das glândulas sali-vares deRhynchosciara angelae. Rev Bras Biol 27:105-108. da Conceição Silva JL and Fernandez MA (2000) Feulgen stain in heterogeneous egg samples from non-synchronized
Bradysia hygida (Diptera, Sciaridae) laboratory culture. Cytologia 65:167-171.
Daneholt B and Edström JE (1967) The content of deoxyribonu-cleic acid in individual polytene chromosomes of
Chironomus tentans. Cytogenetics 6:350-356.
Dolezel J, Bartos J, Voglmayr H and Greilhuber J (2003) Nuclear DNA content and genome size of trout and human. Cytometry 51A:127-128.
Falco JRP, Mello MLS, Maria SS and Grazziotin NA (1999) Criti-cal electrolyte concentration of chicken erythrocyte chromatin. Acta Histochem Cytochem 32:73-76.
Fiorini A, Basso Jr LR, Paçó-Larson ML and Fernandez MA (2001) Mapping of intrinsic bent DNA Sites in the upstream region of DNA puffBhC4-1amplified gene. J Cell Biochem 83:1-13.
Gaspar VP, Borges AR and Fernandez MA (2002) NOR sites de-tected by Ag-DAPI staining of an unusual autosome chro-mosome of Bradysia hygida (Diptera, Sciaridae). Genetica114:57-61.
Gregory TR (2001) Animal Genome Size Database. http://www. genomesize.com/. Last accessed: [01/23/2004].
Gregory TR (2002) Genome size and developmental complexity. Genetica 115:131-146.
Gregory TR (2003) Is small indel bias a determinant of genome size? Trends Genet 19:485-488.
Hahn MW and Wray GA (2002) The g-value paradox. Evol Dev 4:73-75.
Hancock JM (2002) Genome size and the accumulation of simple sequence repeats: Implications of new data from genome se-quencing projects. Genetica 115:93-103.
Hardie DC, Gregory TR and Hebert PDN (2002) From pixels to picograms: A beginners’ guide to genome quantification by
Feulgen image analysis densitometry. J Histochem Cytochem 50:735-749.
Hartman TP and Southern DI (1995) Genome reorganization from polyteny to polyploidy in the nurse cells found in onion fly (Delia antiqua) and cabbage root fly (Delia radicum) ova-ries (Diptera, Anthomyiidae). Chromosome Res 3:271-280. Jost E and Mameli M (1972) DNA content in nine species of
Nematocerawith special reference to the sibling species of theAnopheles maculipennisgroup and theCulex pipiens
group. Chromosoma 37:201-208.
Kimura RH, Choudary PV, Stone KK and Schmid CW (2001) Stress induction of Bm1 RNA in silkworm larvae: SINEs, an unusual class of stress genes. Cell Stress Chaperones 6:263-272.
Laicine EM, Alves MAR, De Almeida JC, Rozzo E, Albernaz WC and Sauaia H (1984) Development of DNA puffs and pat-terns of polypeptide synthesis in the salivary glands of
Bradysia hygida. Chromosoma 89:280-284.
Lengyel J and Penman S (1975) hnRNA size and processing as re-lated to different DNA content in two Dipterans:Drosophila
andAedes. Cell 5:281-290.
Lozovskaya ER, Nurminsky DI, Petrov DA and Hartl DL (1999) Genome size as a mutation - selection - drift process. Genes Genet Syst 74:201-207.
Ma RZ, Black WC and Reese JC (1992) Genome size and organi-zation in an aphid (Schizaphis graminum). J Insect Physiol 38:161-165.
Monesi N, Basso LR Jr and Paçó-Larson ML (2003) Identifica-tion of regulatory regions in DNA puffBhC4-1gene pro-moter. Insect Mol Biol 12:247-254.
Morgante JS (1969) Tree new species of Brazilian Sciaridae (Diptera, Nematocera). Rev Bras Biol 29:571-576. Paçó-Larson ML (1976) Análise quantitativa do conteúdo de
DNA da glândula salivar deBradysia hygida. Master The-sis. Faculdade de Medicina de Ribeirão Preto, Universidade de São Paulo, Ribeirão Preto.
Petitpierre E (1996) Molecular cytogenetics and taxonomy of in-sects, with particular reference to the Coleoptera. Interna-tional J Insect Morphol & Embryol 25:115-133.
Petrov DA (2001) Evolution of genome size: New approaches to an old problem. Trends Genet 17:23-28.
Petrov DA and Hartl DL (2000) Pseudogene evolution and natural selection for a compact genome. J Hered 91:221-227. Petrov DA, Sangster TA, Johnston JS, Hartl DL and Shaw KL
(2000) Evidence for DNA loss as a determinant of genome size. Science 287:1060-1062.
Prokopowich CD, Gregory TR and Crease TJ (2003) The correla-tion between rDNA copy number and genome size in eukaryotes. Genome 46:48-50.
Rao PN and Rai KS (1987) Inter and intraspecific variation in nu-clear DNA content inAedesmosquitoes. Heredity 59:253-258.
Rao PN and Rai KS (1990) Genome evolution in the mosquitoes and other closely related members of superfamily Culicoi-dea. Hereditas 113:139-144.
Rasch EM (1970) DNA cytophotometry of salivary gland nuclei and other tissue systems in dipteran larvae. In: Wied GL and Bahr GF (eds) Introduction to Quantitative Cytochemistry II. 2nd ed. Academic Press, New York, pp 335-355. Rasch EM, Barr HJ and Rasch RW (1971) The DNA content of
Samols D and Swift H (1979) Genomic organization in the flesh flySarcophaga bullata. Chromosoma 75:129-143.
Sauaia H and Alves MAR (1968) A description of a new species ofBradysia hygida. Papéis Avulsos de Zoologia 22:85-88.
Smith J and Burt DW (1998) Parameters of the chicken genome (Gallus gallus). Anim Genet 29:290-294.
Soares MA, Monesi N, Basso LR Jr, Stocker AJ, Paçó-Larson ML and Lara FJ (2003) Analysis of the amplification and tran-scription of the C3-22 gene ofRhynchosciara americana
(Diptera, Sciaridae) in transgenic lines of Drosophila melanogaster. Chromosoma 112:144-151.
Sohn U-I, Rothfels KH and Straus NA (1975) DNA: DNA hybrid-ization studies in black flies. J Mol Evol 5:75-85.
Tiersch TR and Wachtel SS (1991) On the evolution of genome size of birds. J Hered 82:363-368.
Yokosawa J, Soares MA, Dijkwel PA, Stocker AJ, Hamlin JL and Lara FJ (1999) DNA replication during amplification of the C3 puff ofRhynchosciara americanainitiates at multiple sites in a 6 kb region. Chromosoma 108:291-301.