UNIVERSIDADE DE LISBOA
FACULDADE DE CIÊNCIAS
DEPARTAMENTO DE BIOLOGIA VEGETAL
IMPACT OF MICROCYSTINS ON THE GROWTH
AND ANTIOXIDANT SYSTEM OF AQUATIC
BACTERIA
Master thesis
Diana Marta Luís Miguéns
MESTRADO EM MICROBIOLOGIA APLICADA
2013
UNIVERSIDADE DE LISBOA
FACULDADE DE CIÊNCIAS
DEPARTAMENTO DE BIOLOGIA VEGETAL
IMPACT OF MICROCYSTINS ON THE GROWTH
AND ANTIOXIDANT SYSTEM OF AQUATIC
BACTERIA
Dissertação orientada pela Doutora Elisabete Valério (INSA) e Prof. Doutora Ana Reis (FCUL)
Diana Marta Luís Miguéns
MESTRADO EM MICROBIOLOGIA APLICADA
2013
IMPACT OF MICROCYSTI
AND ANTIOXIDANT SYST
Diana Marta Luís Miguéns
This thesis work was fully performed at the Biology and Ecotoxicology Laboratory, Department of Environmental Health, from the National Health Institute Doutor Ricardo Jorge (INSA), under the direct supervision of Doctor
Prof. Doctor Ana Reis was the internal designated supervisor in the scope of the Master in Applied Microbiology of the Faculty of Sciences of the University of Lisbon
IMPACT OF MICROCYSTINS ON THE GROWTH
AND ANTIOXIDANT SYSTEM OF AQUATIC
BACTERIA
Diana Marta Luís Miguéns
Dissertação
2013
This thesis work was fully performed at the Biology and Ecotoxicology Laboratory, Department of Environmental Health, from the National Health Institute Doutor Ricardo
he direct supervision of Doctor Elisabete Valério.
Reis was the internal designated supervisor in the scope of the Master in Applied Microbiology of the Faculty of Sciences of the University of Lisbon
NS ON THE GROWTH
EM OF AQUATIC
This thesis work was fully performed at the Biology and Ecotoxicology Laboratory, Department of Environmental Health, from the National Health Institute Doutor Ricardo
Reis was the internal designated supervisor in the scope of the Master in Applied Microbiology of the Faculty of Sciences of the University of Lisbon, Portugal.
ACKNOWLEDGMENTS
To all who supported me throughout this thesis, I would like to leave my honest acknowledgments:
To my supervisor Doctor Elisabete Valério, to who I am thankful for accepting me, for all the teaching lessons, help and presence that always provided. For all the joyfully moments passed in laboratory and for the encouragement, as well as for the trust placed in me, because it made me more independent and critical in my work.
To Prof. Doctor Ana Reis for the concern and aid provided to the realization of this thesis.
To all my colleagues at the Biology and Ecotoxicology laboratory of INSA, to Doctor Paulo Pereira (the boss) for constant questions about my work and encouraged my quest for knowledge. To Sérgio Paulino, Elsa Alverca, Elsa Dias, Catarina Churro and Carina Menezes for the friendship, help and for all the fun times that helped me relax.
To Prof. Doctor Sandra Chaves for provided the PCR primers and support. To Prof. Doctor Rogério Tenreiro who helped me find my supervisor and her research field.
To my godmother Patrícia Presado for emails that encouraged me and for always be available to listen to me when I needed. The immense friendship and affection which has for me and always for remembering me that true friends are not lost because I neglected them for being busy with work.
To Cláudia Guerreiro, Chiqui, Joana Costa and Ricardo Duarte for moral support and friendship that have always given me. A special thanks to Cláudia for all the lunches and relaxed times we did in INSA garden. Thank you for the conversations and the memories of other times that we shared.
To Carlos Henriques, thank you for support and encouragement throughout this thesis, for being there when I needed. For the pressure, strength and for the moments you provided me. All the moments you gave me were the best I ever had. You were my rock and helped me overtake one of the saddest moments of my life.
To my parents for education and love that always provided me. Thank you for the thesis financing, without your support I wouldn´t be able to finish it.
COMMUNICATIONS REALIZED DURING THE THESIS
•
Oral communication
Diana Miguéns, Elisabete Valério. Impacto das microcistinas no crescimento de bactérias aquáticas. 3º Congresso Ibérico de Cianotoxinas. Blanes, Espanha, 10 – 12 de Julho de 2013.
ABSTRACT
Microcystins (MC) are the type of hepatotoxins more abundantly produced by cyanobacteria. Studies have shown that these toxins affect many multicellular organisms that inhabit aquatic ecosystems, however their impact on bacteria that cohabit with freshwater cyanobacteria is still unclear.
In this work the impact of three variants of the MC (-LR,-RR,-YR) was evaluated on growth and antioxidant system of heterotrophic bacteria isolated from three Portuguese reservoirs where blooms of cyanobacteria are often observed, some having microcystin-producing strains, and also in bacteria isolated from a reservoir where these phenomena do not occur. To this end, morphological and molecular characterization of the bacterial isolates was proceeded and these bacteria were exposed to three different concentrations of each variant of the MC, and the effect on the bacterial growth curves was evaluated. The enzymatic activity of catalase (CAT) and SuperOxide Dismutase (SOD1 and SOD2) was determined spectrophotometrically at 240 nm and 550 nm, respectively, in cells exposed to the microcystin variants.
It was found that MC can reduce the growth of most bacteria tested (62.5%), and some bacterial cultures grown with no effect (37.5%), while others reacted differently depending on the variant and concentration used on the same isolate. However, in two isolated bacteria a slight stimulation of growth was observed, although with no statistical significance.
The results of the determination of CAT and SOD activities showed that the bacterial isolates were susceptible to 10 nM of each variant MC. In all strains tested there was an increase in CAT activity and, in relation to the SOD1 and SOD2 activities it was observed that, most bacteria had an increase of the each SOD activity when exposed to MC. However, not all isolates showed effects on SOD1 or SOD2 activities in the three variants of the MC used.
This study showed that MCs can induce a reduction on the growth of most bacteria isolated from freshwater. In respect to the antioxidant system enzymes, all results point out that microcystins can induce oxidative stress in the bacteria tested and that CAT and SOD activities were activated as a defense mechanism to scavenge reactive oxygen species (ROS) increment.
RESUMO
As microcistinas (MC) são o tipo de hepatotoxinas mais abundantemente produzido pelas cianobactérias. Estudos revelaram que estas toxinas afetam diversos organismos multicelulares que habitam ecossistemas aquáticos, no entanto o seu impacto em bactérias, que coabitam com cianobactérias de água doce encontra-se ainda por esclarecer.
Neste trabalho avaliou-se o impacto de três variantes da MC (-LR, -RR, -YR) no crescimento e sistema antioxidante de bactérias heterotróficas isoladas de três albufeiras portuguesas, onde frequentemente se observam “blooms” de cianobactérias, sendo algumas estirpes produtoras de MC, assim como em bactérias isoladas de uma albufeira onde estes fenómenos não acontecem. Para tal, procedeu-se à caracterização morfológica e molecular das bactérias isoladas e estas foram expostas a três concentrações diferentes de cada variante da MC, e os efeitos nas curvas de crescimento bacteriano foram avaliados. A atividade enzimática da catalase (CAT) e da Superóxido Dismutase (SOD1 e SOD2) foram determinadas, espectrofotometricamente a 240 nm e 550 nm, respetivamente, nas células expostas às variantes da microcistina.
Verificou-se que as MC podem reduzir o crescimento da maioria das bactérias testadas (62,5%), sendo que algumas bactérias cresceram sem efeito algum induzido (37,5%), enquanto outras reagiram de forma diferente consoante a variante e a concentração usada no mesmo isolado. No entanto, em dois isolados observou-se uma ligeira estimulação do crescimento, embora sem significado estatístico.
Os resultados da determinação das atividades da CAT e SOD revelaram que os isolados bacterianos são na sua maioria suscetíveis à exposição de 10 nM de cada variante da MC. Em todos os isolados testados observou-se um aumento da atividade da CAT e, em relação à SOD1 e SOD2 verificou-se que, na maioria das bactérias testadas, ocorreu um aumento da atividade de cada SOD quando expostas à MC. Contudo, nem todos os isolados apresentaram efeitos na atividade SOD1 ou SOD2 nas três variantes da MC usada.
Este estudo demonstra que as MCs podem reduzir o crescimento da maioria das bactérias isoladas das albufeiras. Em relação às enzimas do sistema antioxidante, todos os resultados indicam que as microcistinas podem induzir stress oxidativo nas bactérias testadas e que as atividades da CAT e da SOD foram ativadas como um mecanismo de defesa para eliminar o aumento de espécies reativas de oxigénio (ROS).
TABLE OF CONTENTS
1. INTRODUCTION ... 2
1.1. Aquatic cyanobacteria and heterotrophic bacteria ... 2
1.2. Cyanobacterial blooms and microcystins ... 3
1.3. Bacterial cell growth ... 5
1.4. Bacterial antioxidant system and oxidative stress ... 6
2. MATERIALS AND METHODS ... 8
2.1. Sampling reservoirs ... 8
2.2. Isolation of bacteria ... 9
2.3. Characterization of the isolated bacteria ... 10
2.4. Molecular identification of the isolates ... 11
2.5. Bacterial cell growth ... 12
2.6. Determination of the activity of the antioxidant system enzymes ... 13
3. RESULTS ... 15
3.1. Characterization of the heterotrophic bacteria isolated ... 15
3.2. Effects of microcystins on the bacterial growth ... 23
3.3. Effects of microcystins on the bacterial antioxidant system ... 35
4. DISCUSSION ... 41
4.1. Characteristics of the isolated bacteria ... 41
4.2. Effects of microcystins on the bacterial growth ... 42
4.3. Effects of microcystins on the bacterial antioxidant system ... 45
5. CONCLUSION ... 48
1.
INTRODUCTION
Cyanobacteria are phototrophic microorganisms that can produce a variety of toxins including microcystins (Best et al., 2002). Also known as blue-green algae, these cyanobacteria are ubiquitous unicellular organisms which mainly inhabit aquatic ecosystems. In aquatic reservoirs these bacteria live in community with others organisms, such as heterotrophic bacteria.
The increase of nutrients concentration, mostly nitrogen and phosphorous in water bodies contributes to the cyanobacterial proliferation which, in some cases, could lead to the proliferation of toxic cyanobacterial species (Kuriama et al., 2012). These toxins are secondary metabolites such as heptapeptide microcystins, of which over 70 structural variants are recorded and they inhibit protein phosphatases causing changes in membrane integrity (Codd et al., 2005).
Most studies about the toxicity of microcystins are focused on animals and on higher plants. However, few studies have been made on the possible effects of these cyanotoxins on heterotrophic bacteria (Dixon et al., 2004 and Yang et al., 2008), which are important as other organism in the trophic web in aquatic ecosystems. Thus, the aim of this study was to examine the effects of three variants of microcystin (Microcystin-LR, Microcystin-RR and Microcystin-YR) exposure on aquatic heterotrophic bacteria that live in the ecosystem as cyanobacteria, and observe their impact on the bacterial growth and on enzymes of the antioxidant system (Catalase and Superoxide Dismutase) of these bacteria, to increase the knowledge about microcystin effects on microbial cells.
1.1. Aquatic cyanobacteria and heterotrophic bacteria
The phytoplankton in aquatic ecosystems is constituted by several eukaryotic microscopic species, as well as, prokaryotic species such as cyanobacteria, which are photosynthetic organisms with a worldwide distribution (Saker et al., 2009). These photosynthetic bacteria, with the certain amount of nutrients and light, can rapidly grow in high density populations called cyanobacterial blooms. Thus, some blooming-forming cyanobacteria cause ecological, economic and health problems (Paulino et al., 2009), due to these overgrown in a short time period, they may break the natural balance of the aquatic system.
Regarding heterotrophic bacteria, they are prokaryotes that are involved in many geochemical cycles in freshwater reservoirs, and their subsistence on aquatic
ecosystems can be due to natural or anthropogenic factors (Figueiredo et al., 2007) that include biological processes. As a result of their role in those biogeochemical processes, bacteria are, therefore, essential to the management of the aquatic ecosystem, as they are the unit base of the trophic web. Furthermore, it has already been hypothesized that the presence of heterotrophic bacteria in water may have an important role in the natural cleansing of the chemically stable hepatotoxins (Berg et al., 2009).
Some studies showed that many blooming cyanobacterial species prefer to grown in the presence of other bacteria (Berg et al., 2009). Nevertheless, some bacteria are able to degrade cyanobacterial hepatotoxins, such as microcystins (Berg et al., 2009).
Giaramida et al., (2012) reported that exposure of microcystins significantly contributed to the bacterial communities shape and microbial physiology of the water bodies under study. That fact could explain the role of toxic cyanobacteria in the control of phytoplankton diversity and species abundance, causing ecological unbalances and contamination of the environment (Campos et al., 2013). However, the role of cyanobacteria and their interactions with heterotrophic bacteria is still barely known.
Cyanobacteria and heterotrophic bacteria are an important part of aquatic ecosystems (Berg, 2009), so studies that combine the effects of both organisms on each other provide new evidence towards the kind of relationships that occur in aquatic ecosystems. Evidences showed that cell concentrations of heterotrophic bacteria can be substantially higher during and immediately after cyanobacterial water blooms than in their absence (Bouvy et al., 2001; Eiler and Bertilsson 2004; Berg, 2009).
1.2. Cyanobacterial blooms and microcystins
Cyanobacterial blooms are not axenic and typically have many heterotrophic bacteria associated with them as shown, for example by Islam et al. (1994) who found Vibrio cholerae within the mucilaginous sheath of Anabaena sp. filaments. These cyanobacteria capable to produce a range of secondary metabolites (Bártová et al., 2010) and their mass occurrences (blooms) cause problems to humans and animals. The problems caused by cyanobacteria are often associated with the toxins that they produce and with the endotoxic lipopolysaccharide (LPS) structures of their cells (Berg et al., 2009) and although cyanobacteria are not listed among waterborne pathogens,
their cyanobacterial cells and toxins that develop present waterborne hazards to health, ranging from mild to fatal, on humans and animals (Codd et al., 2005).
Blooms of cyanobacteria have occurred in many regions all over the world and produce a number of toxins, incluing hepatotoxins such as microcystins (Yang et al., 2008). Several factors contribute to the prevalence of algae blooms, for instance, nutrient inputs, climate changes and the construction of water barriers which often lead to water eutrophication (Churro et al., 2010). The cyanotoxin contamination of water occurs mainly when the cyanobacteria die, the cell walls burst, releasing the toxin thus resulting in the liberation of high amounts of toxins into the water (Blom et al., 2001), and one of the toxins most commonly found are microcystins (Best et al., 2002).
As mentioned before, microcystins are one of the main cyanotoxins. These are cyclic peptides produced by species of freshwater cyanobacteria, primarily Microcystis aeruginosa (Jos et al., 2005; Dawson, 1998), that are capable of specifically inhibit the protein phosphatases 1 and 2A (PP1 and PP2A) of both mammals and higher plants (Mackintosh et al., 1990; Hu et al., 2005). Microcystins being hepatotoxins, their main target is the liver by specific binding to the organic anion transport system in hepatocyte cell membranes, inhibiting type 1 and type 2A eukaryotic serine/threonine protein phosphatases (Valério et al., 2009). The toxin is extremely stable and resists to hydrolysis or oxidation under conditions found in most natural water bodies (Butler et al., 2009). These toxins can break down slowly at high temperature (40ºC) and at either very low (<1) or high (>9) pH (Harada et al., 1996).
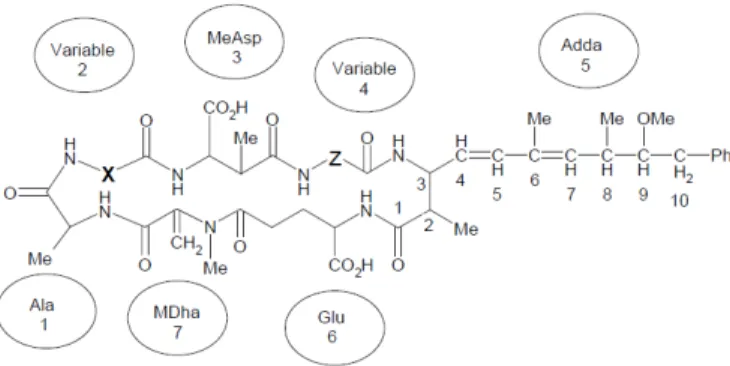
Microcystins comprise over 80 analogs and they have a particular chemical structure (Hawkins et al., 2006). They are cyclic peptides containing seven amino acids, sharing the common structure of Adda-D-Glu-Mdha-D-Ala-L-X-D-MeAsp-L-Z
(Valério et al., 2009). The general structure of the cyanotoxin with variable portions shown as X, Z is illustrated in Fig. 1.
Figure 1 - General structure of microcystin consisting of D-alanine (Ala); two variable amino acids (position X and Z);
D-β-methylaspartic acid (MeAsp); (2S,3S,8S,9S)-3-amino-9-methoxy-2,6,8-trimethyl-10-phenyldeca-4,6-dienoic acid (Adda); isolinked D-glutamic acid (Glu) and N-methyl dehydroalanine (MDha) (from Hawkins et al., 2006).
The major isoforms of microcystin and most studied ones are microcystin-LR (MCLR), microcystin-RR (MCRR) and microcystin-YR (MCYR) (Li et al., 2009). MCLR has a leucine (L) and an arginine (R) in the X-position and Z-position amino acids, respectively. Microcystin-RR (MCRR) with an arginine (R) in the X-position and in the Z-position amino acids; and the third variant has microcystin-YR (MCYR) with a tyrosine (Y) and an arginine (R) in the X-position and Z-position amino acids, respectively (Butler et al., 2009).
The three microcystin variants are naturally occurring cyclic heptapeptide produced by some strains of cyanobacteria (Guzman and Solter, 1999) and MCLR is the most studied variant of microcystin and it is the most representative variant of all (Campos et al., 2013). MCLR was the first microcystin chemically identified and has been associated with most of the incidents of toxicity involving microcystins in most countries (Fawell et al., 1993), consequently, its toxicity is well known in animals (Honkanen et al., 1990; Guzman and Solter 1999; Jos et al., 2005; Dias et al., 2009; Sabatini et al., 2011; Huguet et al., 2013). However, in microorganisms such as other bacteria, the studies are few (Dixon et al., 2004 and Yang et al., 2008). In some studies, MCLR revealed to be less cytotoxic than MCRR (Huguet et al., 2013) and MCLR and MCYR showed a similar effect on microbial growth (Valdor and Aboal, 2007). The LD50 for MCLR in mice is 50 µg/kg (Dittmann and Wiegand, 2006). The acute lethality of MCYR is slightly lower than MCLR (Gupta et al., 2003; Stotts et al., 1993). LD50 estimates for MCYR is 70 µg/kg in mice (Dittmann and Wiegand, 2006). The LD50 for MCRR is about 10 times higher than the other two variants, with an estimate value of 600 µg/kg in mice (Dittmann and Wiegand, 2006).
1.3. Bacterial cell growth
Bacterial cell growth defines duplication of its cells (Madigan et al., 2012) and in microbial growth usually growth parameters, as lag phase and growth rate are obtained by measuring turbidity as optical density (OD).
Turbidity is measured with a spectrophotometer at a certain wavelength and the presence of more cells in the cell suspension results in a turbidity increase (Madigan et al., 2012).
Bacterial growth is defined with four different phases: lag, exponential, stationary and a death phase. The exponential phase is where the cell duplication occurs and this
period is dependent on several factors such as temperature, pH, water availability and oxygen (Madigan et al., 2012).
There are few studies about the microcystins effects on bacterial growth, however, Yang et al., (2008) observed that E. coli had a growth inhibition at initial growth phase when cells were treated with MCRR. A similar effect was observed by Hu et al., (2005) in cyanobacterium Synechococcus elongates when exposed to the same microcystin variant.
1.4. Bacterial antioxidant system and oxidative stress
Microcystins are capable to elicit oxidative stress in aquatic organisms (Jos et al., 2005) and induce formation of reactive oxygen species (ROS) such as superoxide anion radical (O2−•), hydrogen peroxide (H2O2) and hydroxyl radical (•OH) as a result of
oxidative metabolism (Jos et al., 2005). These ROS might cause serious cellular damage (Ding et al., 2008) such as peroxidation of lipid membranes, genotoxicity, or modulation of apoptosis (Ding and Ong, 2003). The presence of ROS triggered secondary reactions of defense based on enzymatic mechanisms (Hu et al., 2005).
Under stress conditions, the balance between oxidative impact and the antioxidant defense system could be disturbed leading to oxidative stress. Studies made in aquatic macrophytes, as well as in other higher plants showed that the exposure to cyanotoxins have promoted oxidative stress (Pflugmacher 2004; Pflugmacher et al., 2006).
Oxidative stress is imposed on cells in one of three ways: (1) an increase of the oxidants generation, (2) a decrease in the antioxidant protection, or (3) a failure to repair oxidative damage (Vassilakaki and Pflugmacher, 2008). Oxidative stress may be caused by overproduction of ROS or to the depletion of cellular antioxidant enzymes such as catalase (CAT) and superoxide dismutase (SOD) (Sabatini et al., 2011) that are synthesized for scavenging ROS. Elevated levels of ROS, such as superoxide (O2 •-)
may also lead to DNA damage and mutations (Carmel-Harel and Storz, 2000).
SOD and CAT were found in almost all organisms and are known as important antioxidant enzymes (Yang et al., 2008). SOD converts superoxide radicals to H2O2 and
molecular oxygen thereby; the level of cellular damage is decreased (Rahda, 2010). SOD is widely distributed to protect such cells against the toxic effects of superoxide anion (O2 •-) and protects cells against ROS by lowering the steady state level of O2 •-
prosthetic metals (Rahda, 2010) and they are SOD1 (cytosolic Cu/Zn-SOD), SOD2 (mitochondrial Mn-SOD), and SOD3 (extracellular Cu/Zn-SOD) (Trevigen manufacturer’s instructions). The Fe SOD and Mn SOD types occur together in many eubacteria and plants. The Cu-Zn and Mn/Fe types of SOD have quite different mechanisms of action and contain different types and numbers of metal ions (Smith and Doolittle, 1992).
When H2O2 is high, catalase acts catalytically and removes it by forming H2O and
O2 (Radha, 2010). However, at a low concentration of H2O2 and in the presence of a
suitable hydrogen donor such as ethanol and others, CAT acts peroxidically, removing H2O2, but oxidizing its substrate (Turkseven et al., 2005). CAT decomposes H2O2 and
protects the bacterial cell from highly reactive OH• (Rahda, 2010). Most of the catalases characterized until now can be classified in two types: typical catalases and bifunctional catalase-peroxidases and have been shown to be present in bacteria such as Escherichia coli, Bacillus subtilis, Klebsiella pneumonia and Streptococcus coelicolor (Kim et al., 1994). Bifunctional catalase-peroxidases are pH-dependent with a pH optimum at 6 - 6.5, and are more sensitive to temperature, chloroform/ethanol and H2O2 than typical catalases (Kim et al., 1994).
There are some studies on microcystin effects on antioxidant system and the majority of them concluded that the cyanotoxins induces oxidative stress in eukaryotic (Pflugmacher, 2004) and prokaryotic cells (Yang et al., 2008). Li et al., (2009) demonstrated that MCRR could induce the oxidative stress in Synechocystis sp. PCC6803 and the increase gene expressions of antioxidant enzymes might protect the algae from the oxidative damage.
Ding et al., (2008) found out that microcystins induced stress on aquatic plants Lemna minor and Myriophyllum spicatum and that stress induced SOD activity increase which may contribute to the microcystin tolerance. However, CAT activity had little benefits to the tolerance in these aquatic plants (Ding et al., 2008).
As cited before, there are few reports about the effects of microcystin on SOD and CAT activity on bacterial cells that co-inhabit in the same ecosystem as cyanobacteria and for the first time the present study assessed the impact of the three microcystin variants on the antioxidant system enzymes of the isolated bacteria in study.
2.
MATERIALS AND METHODS
2.1. Sampling reservoirs
Sampling was performed on the 29th October 2012 and 29th April 2013 using 1 l
sterile bottles. The first sampling occurred at Albufeira de Magos, Albufeira de Monte da Barca and Albufeira de Patudos, where cyanobacterial blooms are frequently observed. The second sampling was made at Albufeira de Castelo de Bode, a reservoir where these mass occurrences do not occur.
Albufeira de Magos is located in Ribeira de Magos and it belongs to Rio Tejo basin river system (Fig. 2(A)). This reservoir was a swim area that is currently forbidden for bathing due to bacterial contamination and the regular presence of cyanobacteria in water (Decreto Regulamentar Nº 2/88). Albufeira de Monte da Barca (Fig. 2(B)), Albufeira de Patudos (Fig. 2(C)) and Albufeira de Castelo de Bode (Fig. 2(D)) which also belong to the Rio Tejo basin river system, but these reservoirs are located near Coruche, Alpiarça and Tomar, respectively.
Water samples were transported in a cooler bag in the dark to prevent cyanobacterial growth and the increase of the water temperature.
B
C D
Figure 2 - Sampling reservoirs. (A) Albufeira de Magos; (B) Albufeira de Monte da Barca; (C) Albufeira de Patudos; (D)
Albufeira de Castelo de Bode (Taken by Diana Miguéns).
2.2. Isolation of bacteria
Bacteria were isolated from water samples from each reservoir by two methods, water filtration method and plating beads method.
The filtration system was assembled with a filtering ramp and a cellulose membrane (pore diameter = 0.45 µm). A portion of 20 ml of water was filtered from each reservoir and the membranes were placed directly on the surface of Petri dishes containing three different culture media.
The same water samples were also inoculated by viable counting method, where 100 µl of the samples were spread using sterile glass beads. The plates were then incubated until colonies appear (Madigan et al., 2012).
The same media were used in both methods, one was the non-selective Reasoner’2A medium (R2A) which was originally made for counting heterotrophic bacteria in drinking water samples (Reasoner and Geldreich, 1985), but currently is used for heterotrophic bacterial growth from water samples (Massa et al., 1998; Zinder and Salyers, 2001); the Lysogeny Broth medium (LB) that is usually used for bacterial growth (Bertani, 2004) and the Z8 medium was also inoculated as is it a rich medium appropriate for cyanobacterial growth (Skulberg and Skulberg, 1990). The last one intended to verify if the heterotrophic bacteria that live in the same ecosystem as cyanobacteria could also grow with the same nutrient medium that cyanobacteria.
All of the plates inoculated were incubated at 20ºC ± 2ºC and 30ºC ± 2ºC in the dark, to prevent cyanobacterial growth, during four days. After the incubation period, four different bacterial colonies were selected from each sample incubated at 20ºC from the R2A and from the LB medium. Since no bacterial growth on the Z8 medium was observed, and there were no macroscopic differences between colonies from the plates incubated at 20ºC and at 30ºC, the bacterial colonies were selected from plates incubated at 20ºC because this temperature is more similar to the water temperature from the reservoirs where sampling occurred. In the end, 28 colonies were picked and further cultured in Nutrient Agar (NA), an enrichment culture medium, until pure cultures were obtained. After confirming the purity of the isolated bacteria, cryopreservation was performed to maintain the primary features of the isolates, due to the lost of certain features by genetic variation of the isolated bacteria that usually adapts to culture medium conditions (Sambrook and Russel, 2001). To do so, 2 ml of Nutrient Broth medium was placed into 15 ml falcons and each corresponding isolate was inoculated into the medium and incubated at 30ºC overnight. Then, a sterile
labelled cryovial was used to mix 750 µl of the overnight growth culture and 250 µl of Glycerol 60% (Sambrook and Russel, 2001). The cryovials were taken to the vortex to ensure that the glycerol was evenly dispersed. Cultures were well mixed, if not, ice crystals would form decreasing the viability of the cells (Sambrook and Russel, 2001). Then the isolated cultures were stored at -80ºC for future use.
2.3. Characterization of the isolated bacteria
Bacterial isolates were characterized according to their colony color and texture, cells shape and Gram staining. The colonies color and their texture were verified macroscopically. The bacterial shape was assessed in a microscopic slide with bacterial cells from each isolated bacteria. Isolates were assigned into coccus, bacillus and cocobacillus (Cabeen and Jacobs-Wagner, 2005).
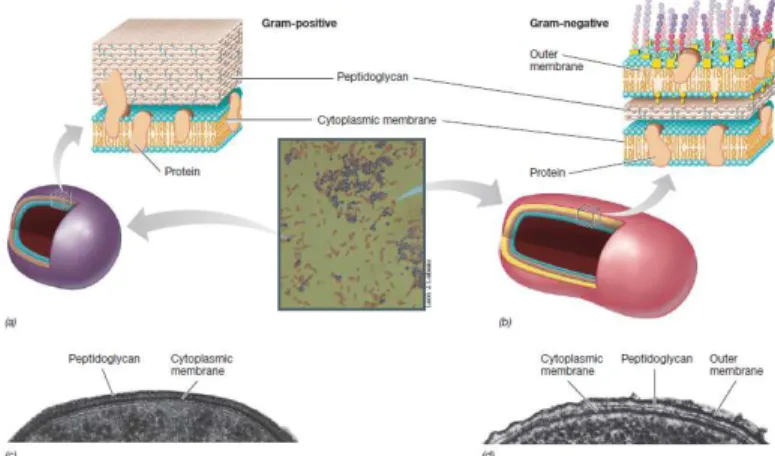
Bacteria can be divided into two major groups, called positive and Gram-negative. Bacteria are grouped in each type of Gram accordingly with their cell wall structure and color reaction to Gram stain. Fig. 3 shows that the surface of Gram-positive and Gram-negative cells as viewed in the electron microscope differs markedly, whereas the Gram-positive cell wall is typically much thicker and consists primarily of a single type of molecule called peptidoglycan, as much as 90% of the cell wall (Madigan et al., 2012), on the other hand, despite Gram-negative have peptidoglycan, this molecule on them is less thicker and they contain an outer membrane that lacks in Gram-positive bacteria (Fig. 3). In order to classify the isolates according to their Gram group, microscope slides of each isolate cells suspension was prepared by a Previ™ color Gram (Biomérieux) which is an automated Gram stainer system. This standardized coloration improved bacteria differentiation in comparison with manual and bath staining results.
2.4. Molecular identification of the isolates
Bacterial DNA extraction was performed by two different methods. Boiling method was performed for Gram-negative bacteria, whereas for Gram-positive bacteria an Invisorb® Spin Plant Mini Kit (INVITEK) was used for DNA isolation, following the manufacturer’s instructions.
In respect to boiling method, bacterial cultures were collected into an eppendorf with 750 µl of apyrogenic water, which is water free from pyrogens (exotoxins and endotoxins) and particulate matter. These samples were centrifuged at 14000 rpm for 5 min. The supernatant was discarded, and the pellet was resuspended in 500 µl of apyrogenic water with the vortex and centrifuged at 10000 rpm for 5 min. The supernatant was discarded, and the pellet was resuspended in 300 µl of apyrogenic water, subjected to boiling at 100°C in a water bath for 15 min and centrifuged at 10000 rpm for 5 min. Supernatants were placed into a new eppendorf before they were stored at −20°C.
The nucleic acids concentration and purity was assessed using the NanoDrop 1000 Spectrophotometer (Thermo Scientific) by pipetting 1 µl of sample.
Aliquots of 2 µl of template DNA were used for PCR amplification of 16S rRNA gene. PCR was performed in a 25 µl reaction mixtures containing 10x PCR buffer (Invitrogen), 1.25 mM dNTPs, 50 µM of each primer, 1 mg/ml BSA, 3 mM MgCl2
(Invitrogen) and 1 U of Taq polymerase (Invitrogen).
The universal bacterial primers 104F and 907R were provided and designed by Chaves, (2005) and the expected amplified fragment has about 800 bp of length. The reactions were performed in a Tpersonal thermocycler (Biometra®) with hot lid (95ºC). The temperature profile had five steps, an initial denaturation (94ºC for 5 min); 40 cycles of denaturation (94ºC for 1 minute), annealing temperature (variable for some isolates) for 1 minute, extension (72ºC for 1 minute); and a final extension step (72ºC for 5 min). The PCR products were resolved by electrophoresis in a 1% (w/v) agarose gel at 75 V for 45 min, using TAE 1x as buffer. GelRed, which is a safe fluorescent nucleic acid dye designed to replace the highly toxic ethidium bromide, was incorporated in the gel to allow the PCR amplicons visualization. The gel image was acquired using a gel transilluminator (UVITEC).
PCR products were purified with peqGOLD Cycle-Pure Kit (peqLab) and then a 10 µl pre-sequencing reaction, using BigDye terminator reaction was performed. The PCR temperature profile was constituted by 25 cycles of 96ºC for 10 seconds, 50ºC for 5
seconds and 60ºC for 4 seconds. The samples were sent for sequencing at the Molecular Biology Laboratory of INSA. In some bacterial isolates, there were some nonspecific PCR products that could not be eliminated without concomitantly loose the amplicon of interest, and in those cases bands were extracted from the gel. In order to do so, the specific bands were cut from the 1% (w/v) agarose gel with a scalpel blade under UV light and purified with NucleoSpin® Gel and PCR clean-up kit (MACHEREY-NAGEL) according to the manufacturer’s instructions.
Bacterial sequences were corrected using BioEdit program (Hall, 1999) and afterward compared to the GenBank nucleotide data library using Basic Local Alignment Search Tool (BLAST) software (Altschul et al., 1990) at the National Center of Biotechnology Information Website (http://blast.ncbi.nlm.nih.gov/Blast.cgi) to determine their closest phylogenetic relatives.
2.5. Bacterial cell growth
Bacterial growth was assessed in a rapid 96-well microplate bioassay where each isolate was inoculated in a Nutrient Broth medium and the three variants of microcystin (MCLR, MCRR and MCYR) purified extracts (table 1) were added into the culture medium to yield a final concentration of 1 nM, 10 nM and 1 µM. The highest MCYR concentration used was 0.3 µM instead of 1 µM because it was the available stock in the laboratory. The concentrations used in the present study were selected from other studies currently being held at the LBE-INSA.
Pre-inoculums were prepared in 10 ml of Nutrient Broth medium in 100 ml Erlenmeyer flasks. Cells were incubated overnight at 20ºC, on Orbital Shaker SO3 at 300 rpm. Growth experiments were initiated in the day after with the pre-inoculums of the cultured cells with an initial optical density of 0.05, measured by a colorimeter 257 (Sherwood) at 660 nm wavelength.
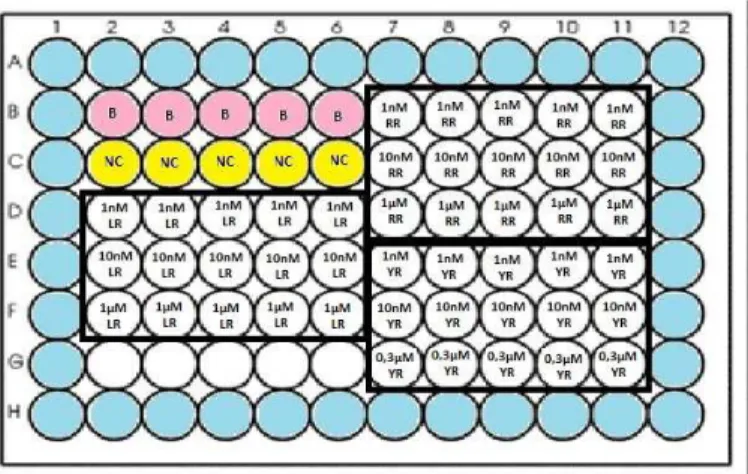
Microplates were inoculated as illustrated in Fig. 4. Thus, the blank was inoculated with 200 µl of Nutrient Broth medium and the negative control was constituted by Nutrient Broth medium and bacterial cells. The bacterial cultures were added to wells with microcystin in five replicates for each concentration of each variant of microcystin (table 1). The total volume in each microplate well was 200 µl. The microplates were incubated at 20ºC with stirring.
Figure 4 - Schematic representation of the microplate wells inoculation, containing microcystin exposure in five
replicates. (B) - Blank. (NC) - Negative control. (LR) - Microcystin-LR concentrations, (RR) - Microcystin-RR concentrations and (YR) - Microcystin-YR concentrations.
Optical densities of the isolated bacteria on each microplate assay were measured at 600 nm reading from 30 to 30 min using a microplate absorbance Multiskan Ascent Thermo Labsystems, with fast shaking for 15 seconds, until stationary phase was achieved. Optical densities were measured according to each isolate growth rate and optical densities readings were made until 8h to 13 h. Growth curves of each tested isolate were made, after the data treatment with Excel™ program (Microsoft Office™). The results were expressed as means ± SE with the optical densities measured. All data were evaluated by F test and student´s t test with a significant level of p < 0.05 (Fowler, 1998) to verify significant differences.
Table 1 - Concentrations of the microcystins extract variants used. These extracts were obtain from strains of
cyanobacterium Microcystis aeruginosa
MCLR (LMECYA 110) MCRR (LMECYA 103) MCYR (LMECYA 179) 1 nM 1 nM 1 nM 10 nM 10 nM 10 nM 1 µM 1 µM 0.3 µM
2.6. Determination of the activity of the antioxidant system enzymes
The oxidative stress was assessed in some of the isolates with the determination of the activity of two antioxidant system enzymes, catalase (CAT) and superoxide dismutase (SOD). These isolates were chosen taking into account that they have reached a high OD (> 0.7) and there were growth effects when exposed to
microcystins. Thus, to determine enzymatic activities, the control group (not exposed to MCs) and cells exposed to microcystins at a concentration of 10 nM of each microcystin variant used, were grown overnight in 10 ml Nutrient Broth medium during 12 hours and the pellets were obtained by centrifugation at 15ºC for 10 min at 112 g (1500 rpm) and then washed with sterile distilled water and the pellet was kept at -80ºC. To extract the proteins, the pellets were thawed and resuspended in sodium phosphate buffer 0.08 M. Cells were disrupted using 100 µl microspheres (Sigma) with six alternate cycles of 1 minute vortex and 1 minute in ice. Cellular debris was removed by centrifugation for 20 min at 12000 rpm, the supernatant recovered and used to analyze the enzyme activities of CAT and SOD. The amount of total proteins in the samples was estimated by Lowry method, where the absorbance of the samples was read at 750 nm of the end product of the Folin reaction against a standard curve of a selected standard protein solution (BSA). The samples were prepared as Lowry et al., (1951) described.
CAT activity was measured by the decomposition of H2O2, which was monitored
directly by the decrease in absorbance at 240 nm. The reaction mixture of 3 ml contained 50 mM sodium phosphate buffer (pH 7.0); 1 ml of 0.2% H2O2 and 3.75 and
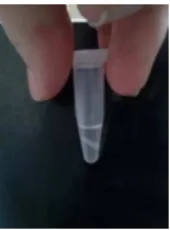
7.5 µg of the enzymatic extract of each isolate, respectively (Yang et al., 2008). SOD activity of SOD1 and SOD2 was measured by the inhibition of the rate of formation of NBT-diformazan using the Superoxide dismutase assay kit (Trevigen) according to the manufacturer´s instructions. The samples supernatants were previously treated with ice-cold chloroform/ethanol, mixed for 30 seconds and centrifuged for 10 min at 10000 rpm. The aqueous phase was recovery without touching the interphase formed (Fig. 5) and placed into a new eppendorf (SOD1 + SOD2 fraction). To assess SOD2 activity, 50 µl were recovered from the aqueous phase and added KCN to a final concentration of 2 mM. The cyanide ion inhibits more than 90% of SOD1 activity, according Superoxide dismutase assay kit (Trevigen) manufacturer’s instructions. To determinate each type of SOD activity, 5 µg of the enzymatic extract of each isolate was measured in the reaction mixture by a spectrophotometer (UNICAM UVNis Spectrometer UV4).
Figure 5 - Two phases of the samples treated with ice-cold chloroform/ethanol. The top phase is the aqueous phase,
3.
RESULTS
3.1. Characterization of the heterotrophic bacteria isolated
For each reservoir, eight colonies were picked, except for Albufeira de Castelo de Bode where only four colonies were selected. Twenty eight colonies were picked taking into account the morphological features differences observed in R2A medium and LB medium. Bacterial isolates were classified with letters and numbers for further identification (B – from Albufeira de Monte da Barca; M – Albufeira de Magos; P – Albufeira de Patudos; C – Albufeira de Castelo de Bode).
The colonies color and their texture were macroscopically verified and the bacterial isolates were assigned as white, whitish, pale yellow, yellow, brown, orange, pink, pinkish, or dark blue as showed in table 2 and table 3; and their texture was designated as mucous or very mucous and some isolates had individualized colonies. In C4 isolate a peculiar blue pigmentation was also observed (table 3).
The bacterial shape was assessed in a microscopic slide with a suspension of bacterial cells from each isolated bacteria. Isolates were classified into coccus, bacillus and cocobacillus (table 2 and 3). One of the isolates was a “prosthecate” bacterium (table 3) and some isolates exhibited cells aggregation (table 2).
Furthermore, the isolates were divided into Gram-positive and Gram-negative using a microscope to observe the microscope slides prepared by a Previ™ color Gram (Biomérieux) which is an automated Gram stainer system (table 2 and 3).
Bacterial sequences were compared in BLAST software and their molecular identification is showed in table 2 and 3.
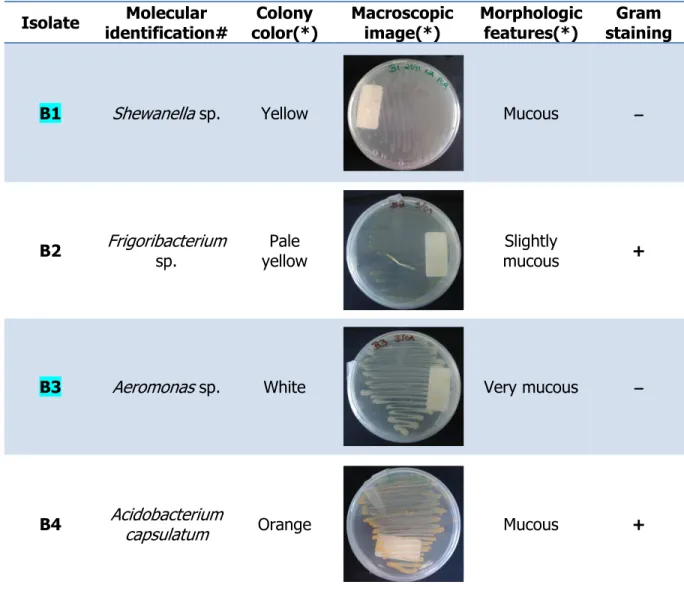
Isolate Molecular identification# Colony color(*) Macroscopic image(*) Morphologic features(*) Gram staining Microscopic
image(**) Cell shape
Cells aggregation
B1 Shewanella sp. Yellow Mucous −−−− Bacillus No
B2 Frigoribacterium sp. Pale yellow Slightly mucous + Coccus No
B3 Aeromonas sp. White Very mucous −−−− Coccobacillus No
B4 Acidobacterium
capsulatum Orange Mucous + Bacillus No
Table 2 - Major features of all 24 aquatic bacteria isolated from three Portuguese freshwater reservoirs: Albufeira de Monte da Barca (B), Magos (M) and Patudos (P). The isolates where the MCs
impact on the bacterial antioxidant system enzymes was evaluated are highlighted. (*) – This parameter was registered after 8 days of growth in Nutrient Agar medium at 20ºC. (**) - The white scale in the image indicates a length of 10 µm. (#) – BLAST molecular identification
Isolate Molecular identification# Colony color(*) Macroscopic image(*) Morphologic features(*) Gram staining Microscopic image(**) Cell shape Cells aggregation B5 Bacillus
vietnamensis Pale pink
Slightly mucous + Bacillus (spores observed) Yes
B6 Aeromonas veronii White
Mucous. Individualized
colonies
−−−− Coccus No
B7 Anaeromyxobacter
sp. Yellow Mucous −−−− Bacillus No
B8 Bacillus
vietnamensis Pink
Slightly
Isolate Molecular identification# Colony color(*) Macroscopic image(*) Morphologic features(*) Gram staining Microscopic image(**) Cell shape Cells aggregation M1 Bacillus
vietnamensis Yellow Mucous −−−− Bacillus No
M2 Shewanella sp. White Mucous + Coccus No
M3 Flavobacterium
sp. Brown Very mucous −−−− Bacillus No
M4 Thioalkalivibrio
Isolate Molecular identification# Colony color(*) Macroscopic image(*) Morphologic features(*) Gram staining Microscopic image(**) Cell shape Cells aggregation M5 Aeromonas
veronii Pale yellow
Very mucous. Individualized
colonies
+ Coccus No
M6 Aeromonas sp. White Mucous + Coccus Yes
M7 Shewanella
xiamenensis Whitish Mucous −−−− Coccus No
M8 Amycolatopsis
Isolate Molecular identification# Colony color(*) Macroscopic image(*) Morphologic features(*) Gram staining Microscopic image(**) Cell shape Cells aggregation P1 Raoultella
terrigena White Mucous + Coccus No
P2 Exiguobacterium
acetylicum Orange Mucous + Coccus Yes
P3 Shewanella sp. Pale yellow Mucous −−−− Bacillus No
P4 Shewanella
Isolate Molecular identification# Colony color(*) Macroscopic image(*) Morphologic features(*) Gram staining Microscopic image(**) Cell shape Cells aggregation P5 Sorangium
cellulosum Yellow Mucous −−−− Coccus No
P6 Shewanella sp. Pale yellow Mucous −−−− Bacillus No
P7 Aeromonas
jandaei Pale yellow Mucous −−−− Coccus No
P8 Pectobacterium
carotovorum Pale yellow
Slightly
Isolate Molecular identification# Colony color(*) Macroscopic image(*) Morphologic features(*) Gram staining Microscopic
image(**) Cell shape
Cells aggregation
C1 Bradyrhizobium
sp. Yellow Mucous −−−− Bacillus No
C2 Pseudomonas
alkylphenolia White Mucous −−−− Cocobacillus No
C3 Flavobacterium sp. Yellow Mucous −−−− “Prosthecate” bacterium No C4 Vogesella sp. Dark blue Slightly mucous Blue pigmentation −−−− Bacillus No
Table 3 - Major features of the four aquatic bacteria isolated from Albufeira de Castelo de Bode (C). The isolates where the MCs impact on the bacterial antioxidant system enzymes was evaluated
are highlighted. (*) – This parameter was registered after 8 days of growth in Nutrient Agar medium at 20ºC. (**) - The white scale in the image indicates a length of 10 µm. (#) – BLAST molecular identification.
3.2. Effects of microcystins on the bacterial growth
The isolates were exposed to three different concentrations (1 nM, 10 nM, 1 µM or 0.3 µM in MCYR cases)) of each microcystin variant (MCLR, MCRR and MCYR) and displayed several behaviors such as a growth reduction, no growth effect, different effects according to each concentration on the same variant and a growth stimulation compared to the control group, where no microcystins were added.
As evident from the growth graphs, there is no significant difference between the control cells and the microcystin exposure cells until they´ve reached late exponential phase, where it can be observed some effects on the growth, however in contrast, with the others isolates, B3 isolate was the only bacterium who had significantly statistic meaning (p < 0.05) since the beginning of the growth experiment.
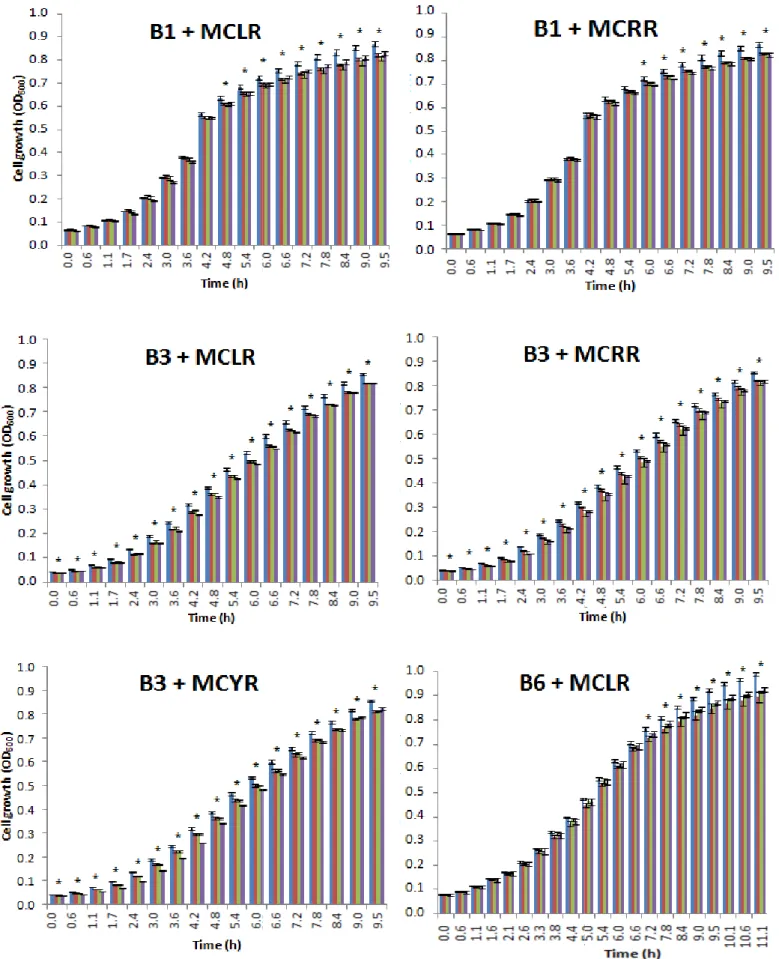
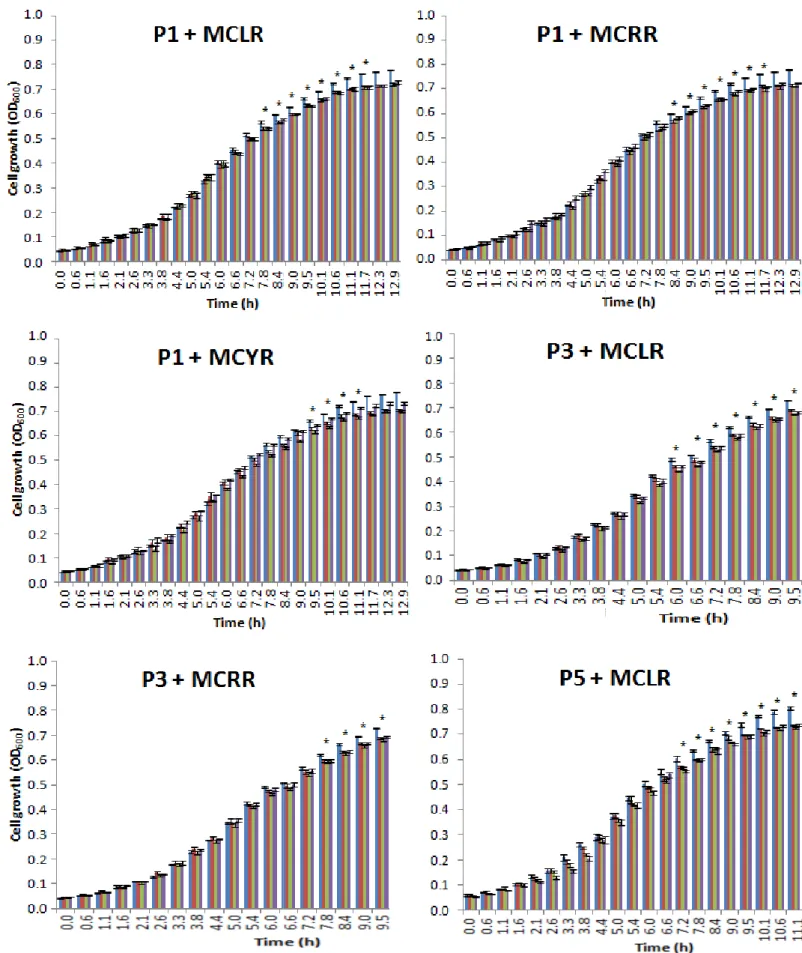
In Fig. 6 is represented the isolates where a reduction on the growth was observed when compared to their control group for all the MCs concentrations tested. The isolates where a reduction on the growth was observed were B3, B6 and P1 in all the three MC variants. Isolates B1, M8, P3, P5, and P6 had a growth reduction with MCLR and MCRR concentration, and M1 and C2 with MCLR and MCYR. In all of these isolates, the reduction is little but significantly (p < 0.05). These cited isolates grown until reached an OD between 0.7 and 1.0 at 600 nm in the control group.
Figure 6 - Isolates where a growth reduction was observed in all the MCs concentrations tested. Growth bars obtained for the bacterial
isolates exposed to three different concentrations of each microcystin variant used. The optical densities were measured at (OD600) and each bar represents means from five replicates with the respective standard error (means ± SE). (*) indicates a significant
difference from the control (p < 0.05). (■) Control bacterial group, ( cells and (■) 1 µM or 0.3 µM (in MCYR cases) exposure cells.
was observed in all the MCs concentrations tested. Growth bars obtained for the bacterial isolates exposed to three different concentrations of each microcystin variant used. The optical densities were measured at
ans from five replicates with the respective standard error (means ± SE). (*) indicates a significant ) Control bacterial group, (■) 1 nM microcystin exposure cells, (■) 10 nM microcystin exposure M or 0.3 µM (in MCYR cases) exposure cells.
was observed in all the MCs concentrations tested. Growth bars obtained for the bacterial isolates exposed to three different concentrations of each microcystin variant used. The optical densities were measured at 600nm ans from five replicates with the respective standard error (means ± SE). (*) indicates a significant ) 10 nM microcystin exposure
Figure 6 - Continuation. Isolates where a growth reduction
bacterial isolates exposed to three different concentrations of each microcystin variant used. The optical densities were mea (OD600) and each bar represents means from five replicates with the respective standard error (means ± SE). (
from the control (p < 0.05). (■) Control bacterial group, ( or 0.3 µM (in MCYR cases) exposure cells.
a growth reduction was observed in all the MCs concentrations tested. Growth bars obtained for the bacterial isolates exposed to three different concentrations of each microcystin variant used. The optical densities were mea
and each bar represents means from five replicates with the respective standard error (means ± SE). (
) Control bacterial group, (■) 1 nM microcystin exposure cells, (■) 10 nM microcystin exposure cells and ( was observed in all the MCs concentrations tested. Growth bars obtained for the bacterial isolates exposed to three different concentrations of each microcystin variant used. The optical densities were measured at 600nm and each bar represents means from five replicates with the respective standard error (means ± SE). (*) indicates a significant difference ) 10 nM microcystin exposure cells and (■) 1 µM
Figure 6 - Continuation. Isolates where a growth reduction
for the bacterial isolates exposed to three different concentrations of each microcystin variant used. The optical densities measured at 600nm (OD600) and each bar represents mea
indicates a significant difference from the control (p < 0.05). (
microcystin exposure cells and (■) 1 µM or 0.3 µM (in MCYR cases) exposure cells.
a growth reduction was observed in all the MCs concentrations tested. Growth bars obtained for the bacterial isolates exposed to three different concentrations of each microcystin variant used. The optical densities
and each bar represents means from five replicates with the respective standard error (means ± SE). ( indicates a significant difference from the control (p < 0.05). (■) Control bacterial group, (■) 1 nM microcystin exposure cells, (
or 0.3 µM (in MCYR cases) exposure cells.
was observed in all the MCs concentrations tested. Growth bars obtained for the bacterial isolates exposed to three different concentrations of each microcystin variant used. The optical densities were ns from five replicates with the respective standard error (means ± SE). (*) ) 1 nM microcystin exposure cells, (■) 10 nM
Figure 6 - Continuation. Isolates where a growth reduction
the bacterial isolates exposed to three different concentrations of each microcystin variant used. The optical densities were 600nm (OD600) and each bar represents means from five replicates with the respective standard error (means ± SE). (
significant difference from the control (p < 0.05). (
exposure cells and (■) 1 µM or 0.3 µM (in MCYR cases) exposure cells.
growth reduction was observed in all the MCs concentrations tested. Growth bars obtained for the bacterial isolates exposed to three different concentrations of each microcystin variant used. The optical densities were
ar represents means from five replicates with the respective standard error (means ± SE). ( significant difference from the control (p < 0.05). (■) Control bacterial group, (■) 1 nM microcystin exposure cells, (
) 1 µM or 0.3 µM (in MCYR cases) exposure cells.
was observed in all the MCs concentrations tested. Growth bars obtained for the bacterial isolates exposed to three different concentrations of each microcystin variant used. The optical densities were measured at ar represents means from five replicates with the respective standard error (means ± SE). (*) indicates a ) 1 nM microcystin exposure cells, (■) 10 nM microcystin
There were some isolates where no effects on the growth where observed. The isolates where there was no effected verified were
variants tested; B4 and M2 with MCLR
All of these bacterial isolates reached an optical density between 0.7 and 1.0, except M2 with MCLR and MCRR and M5 with all three variant microcystin that reached an optical density between 0.2 and 0.3 in
M2 isolated tested with MCLR was the only isolate in this category that had some significant meaning.
Figure 7 - Isolates where no effects on the growth rate has been observed after exposure to MCs. Growth bars obtained for the
bacterial isolates exposed to three different concentrations of each microcystin variant used. The optical densities were me 600nm (OD600) and each bar represents means from five replicates with the respective standard error (means ± SE). (
significant difference from the control (p < 0.05). (
exposure cells and (■) 1 µM or 0.3 µM (in MCYR cases) exposure cells.
There were some isolates where no effects on the growth where observed. The as no effected verified were B7, M5 and C4 for all the MCs M2 with MCLR and MCRR, and C2 with MCRR (Fig. 7).
All of these bacterial isolates reached an optical density between 0.7 and 1.0, except M2 with MCLR and MCRR and M5 with all three variant microcystin that reached an optical density between 0.2 and 0.3 in the control group.
M2 isolated tested with MCLR was the only isolate in this category that had some
Isolates where no effects on the growth rate has been observed after exposure to MCs. Growth bars obtained for the bacterial isolates exposed to three different concentrations of each microcystin variant used. The optical densities were me
and each bar represents means from five replicates with the respective standard error (means ± SE). ( significant difference from the control (p < 0.05). (■) Control bacterial group, (■) 1 nM microcystin exposure cells, (
3 µM (in MCYR cases) exposure cells.
There were some isolates where no effects on the growth where observed. The B7, M5 and C4 for all the MCs
Fig. 7).
All of these bacterial isolates reached an optical density between 0.7 and 1.0, except M2 with MCLR and MCRR and M5 with all three variant microcystin that reached
M2 isolated tested with MCLR was the only isolate in this category that had some
Isolates where no effects on the growth rate has been observed after exposure to MCs. Growth bars obtained for the bacterial isolates exposed to three different concentrations of each microcystin variant used. The optical densities were measured at and each bar represents means from five replicates with the respective standard error (means ± SE). (*) indicates a ) 1 nM microcystin exposure cells, (■) 10 nM microcystin
Figure 7 – Continuation. Isolates where no effects on the growth rate has been observed after exposure to MCs.
the bacterial isolates exposed to three different concentrations of each microcystin variant used. The optical
600nm (OD600) and each bar represents means from five replicates with the respective standard error (means ± SE). (
significant difference from the control (p < 0.05). (
exposure cells and (■) 1 µM or 0.3 µM (in MCYR cases) exposure cells.
Isolates where no effects on the growth rate has been observed after exposure to MCs. the bacterial isolates exposed to three different concentrations of each microcystin variant used. The optical
and each bar represents means from five replicates with the respective standard error (means ± SE). ( significant difference from the control (p < 0.05). (■) Control bacterial group, (■) 1 nM microcystin exposure cells, (
3 µM (in MCYR cases) exposure cells.
Isolates where no effects on the growth rate has been observed after exposure to MCs. Growth bars obtained for the bacterial isolates exposed to three different concentrations of each microcystin variant used. The optical densities were measured at and each bar represents means from five replicates with the respective standard error (means ± SE). (*) indicates a in exposure cells, (■) 10 nM microcystin
Not all of the isolates respond to microcystin exposure with the same behavior in the three concentrations used for each microcystin variant. As so, some isolates showed different effects within the microcystin variant used,
concentration exposure. The different effects showed were a growth reduct
effect on growth (Fig. 8). Except for M1 with MCRR who showed no effects with 1 nM and 10 nM, and a reduction growth when exposed to the highest concentration (1 µM) with significant meaning (p < 0.05), the others isolates B1, M8, P3, P5 and P6, all with MCYR showed that the hig
growth while the cells exposed to the other two concentrations had a reduction on the growth, with significant difference (p < 0.05).
Figure 7 - Continuation. Isolates where no effects on the growth rate has been observed after exposure to MCs. Growth bars obtained for
the bacterial isolates exposed to three different concentrations of each microcystin variant used. The optical densities were
600nm (OD600) was measured and each bar represents means from five replicates with the respective standard error (means ± SE). (
indicates a significant difference from the control (p < 0.05). (
microcystin exposure cells and (■) 1 µM or 0.3 µM (in MCYR cases) exposure cells.
Not all of the isolates respond to microcystin exposure with the same behavior in concentrations used for each microcystin variant. As so, some isolates showed different effects within the microcystin variant used, depending
. The different effects showed were a growth reduct
8). Except for M1 with MCRR who showed no effects with 1 nM and 10 nM, and a reduction growth when exposed to the highest concentration (1 µM) with significant meaning (p < 0.05), the others isolates B1, M8, P3, P5 and P6, all with MCYR showed that the highest concentration (0.3 µM) produced no effect on the growth while the cells exposed to the other two concentrations had a reduction on the growth, with significant difference (p < 0.05).
Continuation. Isolates where no effects on the growth rate has been observed after exposure to MCs. Growth bars obtained for the bacterial isolates exposed to three different concentrations of each microcystin variant used. The optical densities were
) was measured and each bar represents means from five replicates with the respective standard error (means ± SE). ( indicates a significant difference from the control (p < 0.05). (■) Control bacterial group, (■) 1 nM microcystin
) 1 µM or 0.3 µM (in MCYR cases) exposure cells.
Not all of the isolates respond to microcystin exposure with the same behavior in concentrations used for each microcystin variant. As so, some isolates depending on the . The different effects showed were a growth reduction or no 8). Except for M1 with MCRR who showed no effects with 1 nM and 10 nM, and a reduction growth when exposed to the highest concentration (1 µM) with significant meaning (p < 0.05), the others isolates B1, M8, P3, P5 and P6, all with hest concentration (0.3 µM) produced no effect on the growth while the cells exposed to the other two concentrations had a reduction on the
Continuation. Isolates where no effects on the growth rate has been observed after exposure to MCs. Growth bars obtained for the bacterial isolates exposed to three different concentrations of each microcystin variant used. The optical densities were measured at ) was measured and each bar represents means from five replicates with the respective standard error (means ± SE). (*) ) 1 nM microcystin exposure cells, (■) 10 nM
Figure 8 - Isolates where different effects on the growth rate have
obtained for the bacterial isolates exposed to three different concentrations of each microcystin
measured at 600nm (OD600) and each bar represents means from five replicates with the respective standard error (means ± SE). (
indicates a significant difference from the control (p < 0.05). (
microcystin exposure cells and ( ) 1 µM or 0.3 µM (in MCYR cases) exposure cells.
effects on the growth rate have been observed according to the concentrations tested
obtained for the bacterial isolates exposed to three different concentrations of each microcystin variant used. The optical densities were and each bar represents means from five replicates with the respective standard error (means ± SE). ( indicates a significant difference from the control (p < 0.05). (■) Control bacterial group, (■) 1 nM microcystin exposure cells, (
) 1 µM or 0.3 µM (in MCYR cases) exposure cells.
been observed according to the concentrations tested. Growth bars variant used. The optical densities were and each bar represents means from five replicates with the respective standard error (means ± SE). (*) ) 1 nM microcystin exposure cells, (■) 10 nM
There were two isolates where some growth stimulation was observed. In Fig. 9 are represented B4 with MCYR and M2 with MCYR which had a small growth stimulation when exposed to 0.3 µM. Nevertheless, these measurements had no significant meaning. The other two concentrations had no effects on the growth comparing to group control.
In respect to the optical densities reached, isolate B4 grown until 0.8 and isolate M2 grown until almost 0.4, both in the higher concentration where a stimulation growth is observed.
Some of the bacterial isolates didn´t gr
medium or when inoculated in the microplate didn’t development any growth. Those bacterial isolates were B2 (
of them were tested twice in independent experiments, development was obtained.
Figure 9 - Isolates where growth stimulation was observed in one of
bacterial isolates exposed to three different concentrations of each microcystin variant used. The optical densities were me
600nm (OD600) and each bar represents means from five replicates with the respective standard error (means ± SE). (*) indicates a
significant difference from the control (p < 0.05). (
exposure cells and (■) 1 µM or 0.3 µM (in MCYR cases) exposure cells.
There were two isolates where some growth stimulation was observed. In Fig. 9 are represented B4 with MCYR and M2 with MCYR which had a small growth stimulation when exposed to 0.3 µM. Nevertheless, these measurements had no significant meaning. The other two concentrations had no effects on the growth comparing to group control.
n respect to the optical densities reached, isolate B4 grown until 0.8 and isolate M2 grown until almost 0.4, both in the higher concentration where a stimulation
Some of the bacterial isolates didn´t grew overnight in the liquid Nutrient broth medium or when inoculated in the microplate didn’t development any growth. Those B2 (Fig. 10), B5, B8, M3, M4, M6, M7, P2, P4, P7, C1 and C3. All twice in independent experiments, but either ways no growth development was obtained.
growth stimulation was observed in one of the MCs concentrations tested. Growth bars obtained for the bacterial isolates exposed to three different concentrations of each microcystin variant used. The optical densities were me
each bar represents means from five replicates with the respective standard error (means ± SE). (*) indicates a significant difference from the control (p < 0.05). (■) Control bacterial group, (■) 1 nM microcystin exposure cells, (
) 1 µM or 0.3 µM (in MCYR cases) exposure cells.
There were two isolates where some growth stimulation was observed. In Fig. 9 are represented B4 with MCYR and M2 with MCYR which had a small growth stimulation when exposed to 0.3 µM. Nevertheless, these measurements had no significant meaning. The other two concentrations had no effects on the growth
n respect to the optical densities reached, isolate B4 grown until 0.8 and isolate M2 grown until almost 0.4, both in the higher concentration where a stimulation
w overnight in the liquid Nutrient broth medium or when inoculated in the microplate didn’t development any growth. Those ), B5, B8, M3, M4, M6, M7, P2, P4, P7, C1 and C3. All but either ways no growth
the MCs concentrations tested. Growth bars obtained for the bacterial isolates exposed to three different concentrations of each microcystin variant used. The optical densities were measured at each bar represents means from five replicates with the respective standard error (means ± SE). (*) indicates a ) 1 nM microcystin exposure cells, (■) 10 nM microcystin