1
Mapping and identification of hotspot areas for biodiversity
and Ecosystem Services in cork oak woodlands of
southern Portugal
Berta Briñas García
Dissertation for Erasmus Mundus MSc in
Mediterranean Forestry and Natural Resources Management
Supervisor: Doctor Miguel N. do S. M. Bugalho
Co-supervisor: phD student Filipe E. Parreiras Silva Dias
Jury:
President:
Doctor Maria Margarida Branco de Brito Tavares Tomé, Cathedratic of Instituto
Superior de Agronomia in University in Lisbon.
Vocals:
Doctor José Miguel Oliveira Cardoso Pereira, Cathedratic of Instituto Superior de
Agronomia in University of Lisbon; Doctor Miguel Nuno do Sacramento Monteiro Bugalho
3
Acknowledgements:
I would like to thank my dissertation supervisor Miguel Bugalho and co-supervisor Filipe Dias for their support and knowledge. I would also like to thank all the fellows and teachers that participated in the MEDfOR MSc. Thank you for these two years full of new experiences and acquaintance of people with different mentalities that made me open my view of the world.
I am always completely grateful to my family and friends, for generously support of all my decisions in life and for giving me a push in the moments I needed it the most.
5 DISSERTATION TOPIC:
Mapping and identification of hotspot areas for biodiversity and Ecosystem Services in cork oak woodlands of southern Portugal
ABSTRACT:
Cork oak woodlands or montados are ecosystems of high conservation and socio-economic importance. The present work aimed at 1) identifying and mapping biodiversity and Ecosystem Services in main area of distribution of cork oak montado in Southern Portugal 2) assessing how the distribution of these conservation values relates with the distribution of the network of classified areas and 3) assessing how the distribution of identified conservation values relates with the area of cork oak montado under forest certification. I mapped biodiversity values (presence of species of amphibians, reptiles and threatened birds) and Ecosystem Services (carbon storage and aquifer recharge rates) within the study area. For achieving this I used the open source Q-GIS 2.0.1. software together with the open access online geographic information system WebGIS Hotspot Areas for Biodiversity and Ecosystem Services (HABEaS: www.habeas-med.org). With the exception of Natura 2000 sites the distribution of Biodiversity and Ecosystem Services is largely not coincident with that of classified areas. In relation to forest certified areas, these are presently covering a significant area of cork oak montados where biodiversity values and Ecosystem Services overlap.
Keywords:
Conservation tools, Quercus suber, Forest certification, Payments for Ecosystem Services.
RESUMO:
Os montados são ecossistemas com valor socio-económico e ambiental elevados. Para além de albergarem diversas espécies de fauna e flora endémica ou ameaçada geram importantes serviços do ecosistema incluindo cortiça e produção animal mas também serviços culturais, armazenamento de carbono a longo termo ou regulação do ciclo hidrológico.
Os montados são considerados um tipo de habitat classificado no âmbito da rede Pan-Europeia de Conservação Natura2000. Encontram-se ainda varias áreas de montado integradas em zonas de protecção especial para aves ou sítios clasificados assim como localizadas em várias na rede nacional de áreas protegidas.
Para além destas formas de protecção, mais recentemente a certificação da gestão florestal foi aplicada aos montados visando a promoção de boas práticas de gestão e conservação destes ecossistemas.
Este trabalho teve como principal objectivo identificar numa área de estudo dominantemente de montado de sobreiro (Quercus suber) quais as zonas que 1) concentravam valores de biodiversidade elevada (nomeadamente avifauna ameaçada); 2) armazenavam níveis de carbono elevado; 3) se concentravam em áreas importante para recarga de aquíferos. Para além da identificação de áreas com importancia para a conservação da biodiversidade e serviços do ecosistema referidos, o trabalho visou ainda avaliar 4) em que áreas existe sobreposição de valores de biodiversidade e serviços do ecossistema (áreas “hotspot” para biodiversidade e serviços do ecossistema) e 5) de que maneira a actual rede de áreas classificadas e sob certificação de gestão florestal cobrem estas áreas “hotspot.” A área de estudo situa-se no Sul de Portugal nas regiões do Tejo e Ribatejo cobrindo aproximadamente 500 mil hectares nos quais o sobreiro é a espécie florestal dominante.
Para responder aos objectivos acima listados foram utilizados dados de distribuição de avifauna e répteis ameaçados e de répteis e anfíbios endémicos à Península Ibérica. Para o mapeamento de serviços do ecossistema foram usados dados de carbono florestal e localização de aquíferos. Estes dados foram inseridos em Sistema de Informação Geográfica e analisados com recurso à ferramenta WebGIS HABEaS (www.habeas-med.org). Seguidamente identificaram-se as áreas geográficas que coincidiram com células espaciais com número de espécies de avifauna ameaçada acima da média, assim como valores de armazenamento de carbono ou taxas recarga de aquífero também acima da média para a região em causa. Finalmente identificaram-se as áreas que concentravam valores de
6
biodiversidade e serviços do ecosistema elevados e avaliou-se qual a percentagem destas áreas que está coberta pela Rede Natura 2000, rede de áreas protegidas ou sob sistema de gestão florestal certificada.
Com excepção dos sítios Natura 2000 de interesse comunitário a rede de áreas classificadas é geralmente pouco coincidente com áreas com valor para a conservação da biodiversidade e serviços do ecossistema. No entanto a área de montado sob gestão florestal certificada coincide em grande parte com os valores de conservação identificados.
Palavras-chave:
Ferramentas de conservação, Quercus suber, certificação florestal, Pagamentos por Serviços Ambientais.
7
Acknowledgements: ... 3
Chapter 1: Introduction ... 9
1.1. Biodiversity and Ecosystem Services in forests ... 11
1.1.2. Tools for conserving biodiversity and Ecosystem Services ... 12
1.1.2.1. Classified areas ... 12
1.1.2.2. Forest Certification ... 13
1.1.2.3. Payments for Environmental Services ... 15
1.1.2.4. Other market conservation tools ... 16
1.2. The montado ecosystem ... 17
1.2.1. Ecosystem Services of cork oak montados ... 17
1.2.1.1. Long term carbon storage ... 18
1.2.1.2. Quality and availability of water ... 18
1.2.2. Biodiversity of montados ... 18
1.3. Aims of the study ... 19
Chapter 2: Materials and Methods ... 21
2.1. Study area and data ... 23
2.2. The HCVA framework ... 28
Chapter 3: Results ... 31
3.1. Location of High Conservation Value Areas ... 33
3.1.1. Biodiversity ... 33
3.1.2. Ecosystem Services ... 35
3.2. Hotspot areas for biodiversity and Ecosystem Services (ES) ... 37
3.3. Relationship between High Conservation Value Areas, classified areas and areas under FSC certification ... 40
Chapter 4: Discussion ... 43
4.1. Mapping biodiversity and Ecosystem Services: potentials and challenges ... 45
4.2. Biodiversity and Ecosystem Services of cork oak montados ... 45
4.3. Overlapping areas of biodiversity and Ecosystem Services in montados ... 47
4.4. Relationship between HCVAs, classified areas and areas under FSC certification in the montados of southern Portugal ... 48
4.5. Potential of Payments for Ecosystem Services (PES) schemes in montados of southern Portugal... 48
8
4.6. Limitations of the present work and challenges for the future ... 51
Chapter 5: Summary of conclusions ... 53
References ... 57
Appendix I: Original dataset ... ………i
I.I. Areas included in any traditional conservation strategy or FSC certification process in the study area: .. iii
I.I.I. Protected Areas of Portugal (PAs) ... iii
I.I.II. Special Protection Areas for Birds (SPABs) ... iii
I.I.III. Special Areas of Conservation (SACs) ... iv
I.I.IV. Forest Stewardship Council (FSC) certified areas ... v
I.I.V. Frequency distribution of traditional conservation strategies or FSC certified areas ... vi
I.II. Biodiversity ... vii
I.II.I. Threatened birds ... vii
I.II.II. Threatened reptiles ... x
I.II.III. Endemic amphibians and reptiles ... x
I.III. Carbon storage ... xi
I.III.I. Quercus suber ... xi
I.III.II. Other species ... xii
I.IV. Water recharge ... xiv
Appendix II: Other species analysis
Appendix III: Species catalogue
9
11
1.1. Biodiversity and Ecosystem Services in forests
The continued growth of human populations and per capita consumption have resulted in unsustainable exploitation of Earth biological diversity, exacerbated by climate change, ocean acidification, and other anthropogenic environmental impacts. Effective conservation of biodiversity is essential for human survival and the maintenance of ecosystem processes (Rands et al., 2010). Forest biodiversity refers to all life forms found within forested areas and the ecological roles they perform. As such, forest biological diversity encompasses not just trees, but the multitude of plants, animals and micro-organisms that inhabit forest areas and their associated genetic diversity. It results from evolutionary processes over thousands and even millions of years which, in themselves, are driven by ecological forces such as climate, fire, competition and disturbance. Within specific forest ecosystems, the maintenance of ecological processes is dependent upon the maintenance of their biological diversity (Convention of Biological Diversity, 1995), which is globally decreasing at an alarming rate (Pereira et al., 2010, Butchart et al., 2010). For example, the Living Planet Index (an index measuring mean population trend of vertebrate species) declined 31% over the last 40 years (Butchart et al., 2010).
The Mediterranean Basin is one of the world‟s biodiversity “hotspots” (Myers et al., 2000), hosting more than 25000 plant species, 50% of which are endemic to the region (Médail & Quézel, 1997) and a number of endangered or critically endangered vertebrates (Branco et al., 2010). Human-induced changes are known to account for an important part of the variation in the components and dynamics of current biodiversity in the Mediterranean region (Blondel & Aronson, 1999; Lavorel et al., 1998). An example is the cork oak (Quercus suber) woodlands. These are human-shaped ecosystems, typical of the western part of the Mediterranean Basin, which harbour important biodiversity values and generate relevant Ecosystem Services (Bugalho et al., 2011-a).
Ecosystem Services (ES) are the benefits that humankind derives from ecosystems. In economic terms, ES can be defined as intangible commodities and, ecologically, as biophysical processes that contribute to production, to human wellbeing or value (Meijaard et al., 2014).
Scientists have struggled to quantify ES using consistent, comparable approaches. ES have been quantified at different spatial and temporal scales, in relation to their supply or production, demand and consumption, and using a wide and heterogenic array of indicators or metrics (Nemec & Raudsepp-Hearne, 2013). Indicators or metrics can be quantity of a product extracted from forest ecosystems, such as the number of deer killed in a forest during a year (e.g. Raudsepp-Hearne, et al., 2010), water quality data or equations linking production values to potential use or benefit to human populations (e. g. Chan et al., 2006). The Millennium Ecosystem Assessment (MEA, 2005) analysed the state of the Earth ecosystems and provided summaries and guidelines for decision-makers. MEA reported 24 Ecosystem Services concluding that only 4 ES have shown improvement over the last 50 years, 15 are in serious decline, and 5 are in a stable state overall, but under threat in some parts of the world (MEA, 2014).
12
ES frequently trade-off, that is maximizing delivery of a particular ES results in decline of other ES. For example, there may be trade-offs between availability of water and carbon sequestration. Enhancing carbon sequestration can help to mitigate climate change, but it can also encourage the expansion of fast growing species with negative consequences for water supply and biodiversity (Chisholm, 2010; Caparrós et al., 2010). Additionally, ES supply can be related with ES interactions, or ES responses to the same driver of change, such as human management (Bennet et al., 2009). In the case of carbon sequestration and water availability, both of these ES have unidirectional interaction (Engel et al., 2005): provision of carbon affects provision of water but not vice-versa. In this case, afforestation can be the driver of change.
Over the past several decades, a rapidly expanding field of research known as biodiversity and ecosystem functioning has begun to quantify how the world‟s biological diversity can, as an independent variable, control ecological processes essential for the functioning of ecosystems (Cardinale et al., 2011). There is now a consensus that worldwide biodiversity decline (Butchart et al. 2010) can affect ecosystem functioning and ES supply (Balvanera et al., 2006; Cardinale et al., 2011; Hooper et al., 2005; Naeem et al., 2009). Recent studies have supported this hypothesis (e.g. Isbell et al., 2011).
Understanding where biodiversity and ES are located within a landscape and identifying areas where biodiversity values and Ecosystem Services may geographically overlap will contribute to support conservation policies and tools.
1.1.2. Tools for conserving biodiversity and Ecosystem Services 1.1.2.1. Classified areas
Different tools have been developed for protecting biodiversity and associated ES. For example, the development of laws and geographical delimitation of “classified areas”, usually restricting uses of the land aim to protect relevant biodiversity values. In Europe, Natura 2000 is an example. Natura 2000 is a pan-European Network of classified areas aiming to ensure the long-term survival of European most valuable and threatened species and habitats (European Commission, 2014). In Portugal, Natura 2000 was established by, and depends on, the Institute for Conservation of Nature and Forests (ICNF), of the Ministry of the Environment, Territory, and Regional Development. A duty of ICNF is to identify and monitor endangered habitats and species, as well as to promote adequate management of areas under Natura 2000 (Instituto da Conservação da Natureza e das Florestas, 2014). Natura 2000 includes the Special Protection Areas for Birds (SPABs), which identifies areas important for the conservation of bird species and are defined by the European Birds Directive, Council Directive 2009/147/EC on the conservation of wild birds, and Special Areas of Conservation (SACs), which are defined to protected habitats of conservation value in Europe and are designated by the Habitats Directive, Council Directive 1992/43/EEC on the Conservation of natural habitats and of wild fauna and flora.
Other classified areas in Portugal are covered by the national network of Protected Areas and include Nature Parks, Nature Reserves, Protected Landscapes and Natural Monuments.
13
Beyond classified areas, more recently there has been a focus on market based conservation tools. These tools are based on the idea that we currently witness an acceleration of the pace of degradation of valuable Ecosystem Services currently not transacted in markets, while market incentives (prices) convey our needs for food, energy, mobility, housing and other goods and services, without reflecting the value of biodiversity and ES which we usually benefit for free (Branco et al., 2010). An example of a market based conservation tool is forest certification.
1.1.2.2. Forest Certification
Forest certification aims to promote the sustainable management and conservation of forest ecosystems by adding market value to products generated according to environmental and socio-economic principles (Auld et al., 2008; Gomez-Zamalloa et al., 2011). It integrates both sustainable forest management and biodiversity protection, whereas, earlier, these goals were separated in different regulations and different geographical areas (Pappila, 2013). Success of forest certification also relies on the willingness of a growing number of consumers to pay more for sustainably generated products (Auld et al., 2008). Forest certification has generated multiple debates. Some authors consider that certification has generated considerable interest as a means to achieve improved environmental and social outcomes in forests and forest landscapes (Auld et al., 2008). Indeed certification may help buyers of a market commodity to distinguish different types of products or services according to whether or not they have desirable features (Pagiola & Ruthenberg, 2002). Other authors have criticized viability and achievement of forest certification (e.g. Romero et al., 2013; Visseren-Hamakers & Pattberg, 2013; Meijaard et al., 2011) because of insufficient demand for multiple services, high biophysical service complexity, and elevated monitoring costs that indicate that opportunities for large-scale commercial viability of certified forest Ecosystem Services are limited (Meijaard et al., 2011). Other authors (e.g. Ulybina & Fennell, 2013) suggest that behind certification there are commercial drivers, which in combination with the lack of social controls, may let through not always desirable forestry practices under certification schemes.
The most expanded forest certification programs are the Forest Stewardship Council (FSC) and Programme for the Endorsement of Forest Certification (PEFC) (Third-Party Forest Certification in British Columbia, 2013). In the present work we concentrate in areas under FSC forest certification which predominantly cover (over 90%) the cork oak montado, which is the ecosystem addressed in the present thesis.
The Forest Stewardship Council certification (FSC) is the first working example of a certification body, founded in 1993 by environmental Non-Governmental Organizations (NGOs), retailers and private foundations (Meijaard et al., 2014). FSC is based on a flexible standard of forest management covering issues that include land tenure, use rights and responsibilities, rights of indigenous peoples, and biodiversity conservation, among others (Auld, et al., 2008). The process is voluntary and conducted at the request of landowners, based on an independent audit of landholder management practices.FSC specifies 10 principles defining Responsible Forest Management which are global and applied in any forest worldwide (Branco et al., 2010; Auld et al 2008). These 10 principles are: 1: Compliance with laws and FSC Principles; 2: Tenure and use rights and responsibilities; 3: Indigenous
14
peoples' rights; 4: Community relations and worker's rights; 5: Benefits from the forest; 6: Environmental impact; 7: Management plan; 8: Monitoring and assessment; 9: Maintenance of high conservation value forests; 10: Plantations.
Forest biodiversity and ES values are addressed under Principle 6 that states that „„forest management shall conserve biological diversity and its associated values, water resources, soils, and unique and fragile ecosystems and landscapes‟‟ and Principle 9 that states that “Management activities in high conservation value forests shall maintain or enhance the attributes which define such forests. Decisions regarding high conservation value forests shall always be considered in the context of a precautionary approach” (FSC, 2014). High Conservation Value Area (HCVA) is a concept defined under Principle 9 as an area containing one or more of the following 6 “high conservation attributes” (HCV Resource Network, 2014): 1: Areas containing globally, regionally or nationally significant concentrations of biodiversity values; 2: Areas containing globally, regionally or nationally significant large landscape-level areas where viable populations of most if not all naturally occurring species exist in natural patterns of distribution and abundance; 3: Areas that are in or contain rare, threatened or endangered ecosystems; 4: Areas that provide basic Ecosystem Services in critical situations; 5: Areas fundamental to meeting basic needs of local communities; 6: Areas critical to traditional cultural identity of local communities. The HCVA concept has been extended and applied beyond the context of forest certification such as conservation planning or landscape management. HCVA is an international standard that is regionally adopted through a process of stakeholder consultation and public participation. In Portugal, HCVA national interpretation involved public participation and discussion among stakeholders including environmental NGOs, universities, forest and biodiversity public administration, farmer and forest landowner associations and other entities (Branco et al., 2010)..
Presently, the area of forests under FSC certification cover approximately 184 million ha (FSC, 2014). Although monitoring studies are relatively scarce, FSC certification has been shown to affect positively biodiversity conservation, both in tropical (Azevedo-Ramos et al., 2006) and temperate forests (Elbakidze et al., 2011). However, less is known for Mediterranean type forests. Currently there are 4 million ha of Mediterranean forests certified under FSC (Dias et al., 2013) including cork woodlands (Berrahmouni et al., 2009). In Portugal, the country with the largest area of cork oak woodlands (approximately 716 thousand ha) certified area reached 100 thousand ha in 2013 (FSC Portugal, 2014).
Although forest certification is aimed at management standards of producing wood and non-wood forest products there are now attempts of several organizations to develop certification systems that may also explicitly address certification of forest ES, such as pollination, flood buffering or carbon storage (FSC, 2010; WWF, 2011). Together with other financial mechanisms such as tax incentives, certification is intended to reward forest managers providing environmental services when adopting certified management standards. Given the multiple societal demands on forest ecosystems, certification of Forest ES is a logical progression from timber certification (FSC, 2012). Although, so
15
far, certification of forest ES has been unsuccessful due to insufficient demand for maintaining a market of certification of forest ES (Meijaard et al., 2014).
1.1.2.3. Payments for Environmental Services
Payments for Environmental Services (PES) is a relatively novel market conservation tool which aims generating economic incentives to landowners that adopt good management practices favouring the conservation of biodiversity and ES (Branco et al., 2010). PES are part of a new and more direct conservation paradigm, explicitly recognizing the need to bridge the interests of landowners and outsiders (Wunder, 2005). PES are increasingly being applied worldwide (Daily & Matson, 2008) aiming at mitigating ecosystem mismanagement, loss of biodiversity, and the reduction of ES such as carbon sequestration and storage or water provision (Bennett & Balvanera, 2007). PES are indeed transactions that reward individuals or communities for undertaking actions that increase the levels of desired ES (Gundimeda & Wätzold, 2010). According to Wunder & Wertz-Kanounnikoff (2009), the most novel and persuasive feature of PES lies in its “businesslike” conditional payment form, which differs from traditional conservation projects. The core idea consists in beneficiaries of ES making direct contractual payments to local land managers in return for adopting land and resource uses that secure ecosystem conservation and restoration (Wunder, 2007). On the other hand, as explained in Wunder (2005), if a price has to be paid for ecosystem degradation, then ecosystem degradation may be integrated as a cost in decision‐making as a compensation. Thus, incentives are created for both investing in ecosystem conservation and refraining from degrading ecosystems. For instance, by setting aside an area for forest conservation farmers may positively impact the provision of certain ES (e.g. biodiversity protection, water quality), but at a cost of decreasing crop productivity (Ribas et al., 2011). Service users must then compensate service providers for their behavioural change and the consequent increase in services supply (Figure 1).
Figure 1: The logic of PES (Ribas, 2011, adapted from Pagiola & Platais, 2007; Engel et al., 2008; Arriagada & Perrings, 2009).
The payments for ES can be direct or indirect (Tallis et al., 2008) and of 3 different types (Powell & White, 2001; Johnson et al., 2002, Wunder & Wertz-Kanounnikoff, 2009):
1. Public payment mechanisms: involve public agencies purchasing services. These arrangements can be based on market or quasi-market prices, frequently using extra-market payment mechanisms
16
such as bonds, tax revenues, or user fees and may be subsidized. Payments generally go directly to the landowner (Robbins, 2005).
2. Trading Schemes: trading schemes consist of heavily regulated industries that can trade credits below a predetermined cap. In order for this scheme to function, a strong regulatory system with enforcement capacity must exist so that this system can operate (Robbins, 2005). There are also voluntary markets that work through companies or organizations that seek to reduce their carbon footprints and therefore are motivated to engage in the voluntary market. Such companies or organizations aim to enhance their brands, to anticipate emerging regulation as a result of stakeholder and/or shareholder pressure or other reasons, and, according to Wendland et al. (2010), are growing. 3. Self-Organized Private Deals: they are negotiated business-to-business or business-to-community and government organizations are not normally involved (Robbins, 2005). In this scheme, individual beneficiaries of ES contact directly with providers of those services. Voluntary markets are also a category of private PES (Forest Trends, The Katoomba Group & UNEP, 2008).
In addition, ES can be sold as a package (Bundle Ecosystem Services). In other words, biodiversity conservation, provision of clean water by water catchment, carbon sequestration or storage and other ES can be sold together rather than individually (Branco et al., 2010). Bundled services can be seen as (Landell-Mills & Porras, 2002): merged bundles in which ES are sold together and cannot be subdivided for sales to separate purchasers. This kind of service bundling is an adequate strategy only when the same buyer has several simultaneous service interests (Wunder & Wertz-Kanounnikoff, 2009); and as shopping basket bundles in which purchasers can acquire specific services on their own or as part of a package and land stewards can sell different services to different buyers (Wunder & Wertz-Kanounnikoff (2009).
One example of a global PES scheme is the United Nations Program for Reduction Emission from Deforestation and Degradation (REDD+). REDD+ aims to mitigate carbon emissions in developing countries of the southern hemisphere through the provision of financial incentives reducing the rate of forest clearing and degradation (Bugalho et al., 2011-a). It offers an additional source of financing to support sustainable forest management and to boost their development plans and poverty-reduction strategies. In the case of many developed countries, REDD+ seems to be an attractive option to achieve part of their reduction targets through investments in developing countries (Kanninen et al., 2010). Although several PES schemes are still in a pilot phase these mechanism has been widely applied in developed countries (Baylis et al. 2008).
1.1.2.4. Other market conservation tools
Other conservation tools that have been implemented to favor good ecosystem management practices are, for example, the Agro-environmental schemes (AES) of the European Union Common Agricultural Policy (CAP). AES are based on monetary compensation to farmers (Kleijn & Sutherland, 2003) and consist on a set of programs and subsidies of direct payments to farmers, and subsidizing of agricultural exports which aim to protect biodiversity by reducing the negative effects of agriculture
17
(e.g. reductions in the use of pesticides and/or fertilizers) and promoting environmentally friendly practices including traditional farming.
1.2. The montado ecosystem
Cork oak woodlands, also named montados in Portugal are silvopastoral systems characterized by a relatively scattered tree cover (60–100 trees/ha) dominated by the evergreen oaks cork oak (Quercus suber), and holm oak (Quercus rotundifolia). Montados occur in the warmer parts of the humid and sub humid western Mediterranean Basin, covering approximately 1.5 million ha in Europe and 1 million ha in North Africa (Pausas et al., 2009; Bugalho et al., 2011-a). In Portugal, montados cover approximately 1.1 million ha (cork and holm oak), dominating in the South of the country, with approximately 716 thousand ha of cork oak and 350 thousand ha of holm oak (Invéntario Florestal Nacional, 2007).
In some regions these species are mixed with other tree species such as maritime (Pinus pinaster) and umbrella (Pinus pinea) pine. Under the tree canopy pastures and agricultural crops (clover, wheat, barley, oats) are common, and usually implemented in a rotation scheme that includes fallows (Pinto-Correia, 1993; Lourenço et al., 1998). Shifting rotation in montados creates an ever-changing mosaic of land uses and of habitat types of high conservation value (Diaz et al., 1997; Carrión et al 2000; de Miguel 1999).
A diversity of shrub species also occurs (e.g., Cistus spp., Erica spp., Lavandula spp., and Ulex spp.) (Lourenço et al., 1998; Pinto-Correia & Mascarenhas, 1999, Bugalho et al. 2009). The human and ecological systems are integrated in montados, a feature typical of the Mediterranean Basin where ecosystems have been shaped by humans for more than 10 000 years (Blondel et al. 2010).
1.2.1. Ecosystem Services of cork oak montados
Cork oak montados are exploited for forestry, agriculture and grazing. These ecosystems generate cereal crops, cork, charcoal, game, honey, meat and dairy products (Pereira & Fonseca, 2003; Bugalho et al., 2009). The main source of income in cork oak montados however is cork production. Cork is a non-timber forest product, 70 % of which is used to make wine bottle stoppers (Bugalho et al., 2011-a). Portugal is the world‟s largest cork producer, with 49.6 % of the world production (Mendes & Graça, 2009). Cork has been harvested since very old times, probably even before the 4th century BC (Aronson et al., 2009) but only gained commercial importance after the 18th century, with an increasing need for cork bottle stoppers that accompanied the expansion of the trade in bottled wine at that time (Bugalho et al., 2011-a). From the 19th century onwards, there was a sustained effort to expand the existing areal extent of cork oak lands (most notably in the Iberian Peninsula) in direct response to the increasing value of cork in international markets (Bugalho et al., 2009). Currently cork is manually harvested from living trees once every 9-12 years. Montados generate other Ecosystem Services such as cultural, supporting or regulating services (Table 1) including long term carbon storage or regulation of the water cycle.
18
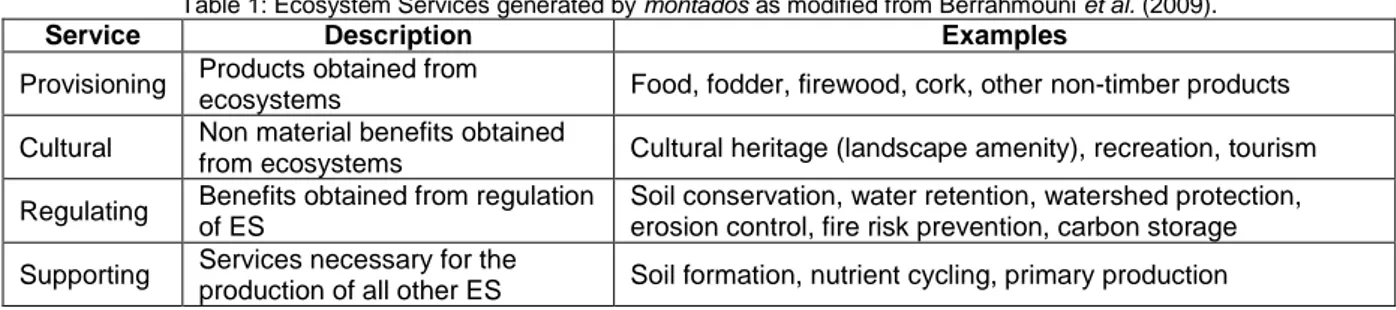
Table 1: Ecosystem Services generated by montados as modified from Berrahmouni et al. (2009).
Service Description Examples
Provisioning Products obtained from
ecosystems Food, fodder, firewood, cork, other non-timber products Cultural Non material benefits obtained
from ecosystems Cultural heritage (landscape amenity), recreation, tourism Regulating Benefits obtained from regulation
of ES
Soil conservation, water retention, watershed protection, erosion control, fire risk prevention, carbon storage Supporting Services necessary for the
production of all other ES Soil formation, nutrient cycling, primary production 1.2.1.1. Long term carbon storage
As with old-growth forests (Luyssaert et al., 2008), cork oak montados accumulate and maintain carbon stocks for long periods. They play a role in carbon storage as the long‐lived oak trees act as long term reserves of carbon (they can live up to hundreds of years). Also, cork is harvested without killing the trees with negligible effects on the ecosystem carbon balance (Pereira, unpublished). Thus, through adequate management, montados can promote carbon storage over very long periods (Branco et al., 2010). Although cork oak is a slow growth tree this species may sequester carbon amounts similar to other oak species and ecosystems. For example, it has been shown that a montado with an average tree cover of 30% may sequester up to 140 g/m2year which is a value similar to those obtained in North American deciduous oak woodlands (Pereira et al., 2007). .
1.2.1.2. Quality and availability of water
Well managed and conserved forests promote infiltration of rain water, prevent soil erosion and contribute to regulate the water cycle (Cardinale et al., 2011). This is particularly important in areas where water is scarce and is likely to become scarcer in forecasted scenarios of climate change such as the Iberian Peninsula (Schröter et al. 2005). Cork and holm oak montados cover a large area of the Iberian Peninsula and therefore may play an important role in regulation of water cycle in these regions, restricting water loss (Pausas et al., 2009). Oak tree roots extract nutrients from deep soil layers and transform it in organic matter in the photosynthesis process. Nutrients are returned to soil as organic matter when leaves fall off and accumulate on its surface. High organic matter content enhances water infiltration and decreases rainfall loss in surface runoffs (Rego et al., 2008). In the Iberian Peninsula, montados are situated within watersheds associated with impoundments used for irrigation or located over aquifers. An example of this is the Tagus-Sado aquifer system, the major groundwater unit of the Iberian Peninsula. This is a multi-layer system, the deepest and most productive aquifer in the region, being a unique source of water supply for drinking, agricultural and industrial supply (Ribeiro & Cunha, 2010). Approximately 40% of this aquifer is covered by cork oak (Bugalho et al. 2011-a; Branco et al., 2010), therefore, forest management practices in the cork oak covering this aquifer will potentially affect the quality and quantity of water recharging this aquifer. 1.2.2. Biodiversity of montados
In the Mediterranean Basin human-mediated disturbances such as forest clearance (including fire use) and livestock grazing have favored habitat heterogeneity and biodiversity at local and regional levels, creating a multiplicity of ecotones (Blondel, 2006). Within the Mediterranean Basin the montado
19
ecosystem harbors important biodiversity values. In these ecosystems species composition depends both on environmental and anthropogenic factors (Pereira & Da Fonseca, 2003; Bugalho et al., 2011-a). Cork oak montados support a high diversity of species of birds, mammals, amphibians and reptiles, many of which are endemic to the Iberian Peninsula. Montados are also a key habitat for several migratory and overwintering birds (Diaz et al., 1997). The variety of bird species occurring in montados is relatively high as compared with other ecosystems (Araújo et al.,1996). A reason for this is that habitat conditions in montados allow for the coexistence of species typically from forested areas simultaneously with species common from open agricultural areas or shrubland areas (Diaz et al., 1997; Branco et al., 2010). Mismanagement and land abandonment (partially caused by devaluation and lower demand of cork) may lead to shrub encroachment, increased risk of wildfire and loss of habitat heterogeneity in montados. Shrub encroachment reduces grassland diversity in montados and may degrade some of the services generated by these ecosystems (Bugalho et al., 2011). This is especially risky when considering wildfires, as shrub encroachment is often of native, flammable shrubs, such as Cistus spp. increasing the risk of severe wildfires (Joffre et al., 1999). In some regions overgrazing can also be threat. Although the maintenance of grazing and small scale grazing-excluded areas increases habitat heterogeneity and plant and invertebrate diversity of montados (Bugalho et al., 2011-b), overgrazing can lead to oak regeneration failure and loss of ecological sustainability of the system (Bugalho et al., 2011-a). Other management problems in montados include the general use of wide plows, disc harrows, and scarifiers. This heavy machinery unselectively destroys young trees and may damage roots and weaken established trees (Bugalho et al., 2009). Indeed, in dry sites or during droughts, trees become more dependent on their extensive superficial root system to survive and thus become more susceptible to the effects of heavy farm machinery. Tree weakness, in turn, may induce pests and fungal diseases that have attacked open montados and related systems in the last twenty years (Bugalho et al., 2009). The maintenance of a healthy oak canopy is not only essential to assure cork production but to ensure oak regeneration and the ecological sustainability of the system (Caldeira et al., 2014). Finding proper incentives to good management practices in cork oak ecosystems will contribute to the conservation of such socio-economic and biodiversity rich ecosystem.
1.3. Aims of the study
My aims with the present study were to identify and map areas in montados of Southern Portugal: harboring important biodiversity values;
generating carbon storage and water-related Ecosystem Services;
where biodiversity values and Ecosystem Services overlap geographically (hotspot areas for biodiversity and Ecosystem Services);
presently covered by classified areas and FSC certification and which concentrate areas important for the conservation of biodiversity and Ecosystem Services.
21
23
2.1. Study area and data
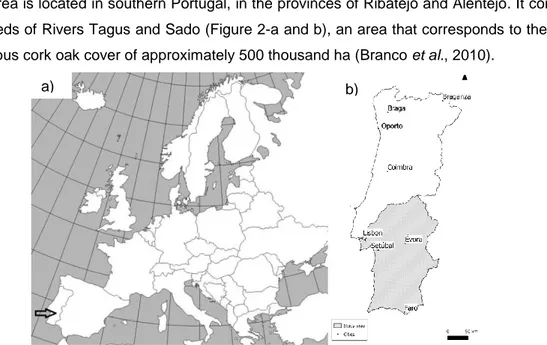
The study area is located in southern Portugal, in the provinces of Ribatejo and Alentejo. It comprises the watersheds of Rivers Tagus and Sado (Figure 2-a and b), an area that corresponds to the largest and continuous cork oak cover of approximately 500 thousand ha (Branco et al., 2010).
Figure 2-a; Location of Portugal in Europe (modified from plazadehistoria.wordpress.com); 2-b: Study area in Portugal.
Data on the distribution of cork oak montados was taken from HABEaS project, modified from the National Forest Inventory (Autoridade Florestal Nacional, 2010). Protected Areas of Portugal (PAs) distribution was obtained from the Institute for the Conservation of Nature and Forests (Instituto da Conservaçao da Natureza, 2014). Areas related with Natura2000 network (SPABs and SACs) were obtained from the European Environment Agency (www.eea.europa.eu). The source of information for area under FSC certification was taken form FSC Portugal (www.fscportugal.com).
Data for biodiversity was taken from 1) the national biodiversity surveys carried out by Equipa Atlas (2008) for occurrences of breeding non marine birds and 2) from Loureiro et al. (2008) for the distribution of reptiles and amphibians that spend part of their life cycle in montados. Both bird and reptiles and amphibians data were obtained in a 10km x 10km grid scale. Above ground carbon storage in montados was collected from the National Forest Inventory (Autoridade Florestal Nacional, 2010). Data on aquifer location and aquifer water recharge rates was collected from Almeida et al., (2000).
All data have been adapted from the original vector coverage into a raster map. For the areas under different conservation categories (PAs, SPABs, SACs and FSC certified), cells were classified according to the proportion of the cell area occupied by a conservation category (less than 2%, 2 to 5%, 5 to 10%, 10 to 20% and more than 20% of the grid-cell area). The use of thresholds is common when dealing with protection networks and species distributional data at different spatial scales (e.g. Araújo et al., 2007).
24
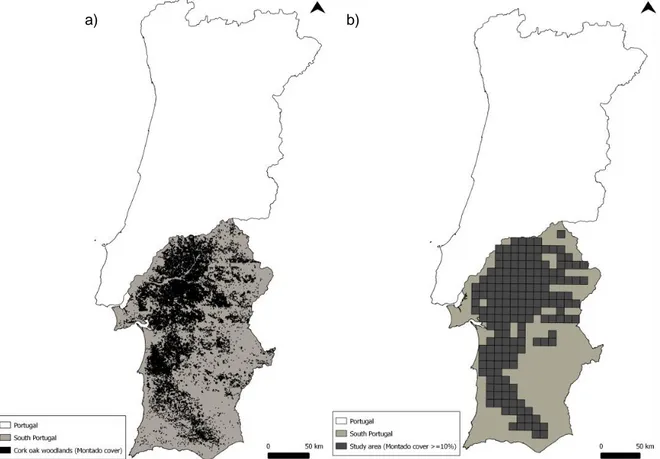
Data on montado cover was obtained from HABEaS project in a 500 x 500 m grid (modified form Autoridade Florestal Nacional, 2010) and transposed to a 10 x 10 km UTM grid, following the Food and Agriculture Organization of the United Nations (FAO) which defines Mediterranean and other Forest areas as “areas with a tree canopy projection equal or above 10%” (FAO, 2006). Thus, I selected those cells within the grid which had cork oak cover equal or above 10%. In other words, I took the 10 x 10 km UTM grid used in national biodiversity surveys and defined the study area as the set of cells with canopy projection of cork oak ≥10 % (Figures 3-a and b). Furthermore, using data from HABeAS project initially taken from the Forest National Inventory, I identified those areas where cork oak was dominant. This area corresponded to the northwestern part of the study area (Figure 4). (For consulting original dataset please see Appendix I: original dataset).
Figure 3-a: Vector coverage of montados in South Portugal; 3-b: Study area in the 10x10 km UTM grid.
25
Figure 4: Cells within study area where cork oak cover is dominant.
The study area is moderately hilly with a mean altitude of 178 m whose values range between 0 and 1019 m above the sea level. The climate is typically Mediterranean, with a hot and dry summer and a rainy and mild winter. The mean annual temperatures range between 15 and 18 ºC and precipitation between 600 and 800 mm/year (Instituto Português do Mar e da Atmosfera, 2013). The dominant forest cover in the area are cork (Quercus suber) and holm oak (Q. rotundifolia), interspaced with maritime pine (Pinus pinaster), stone pine (Pinus pinea) and blue gum (Eucalyptus globulus) plantations (Dias et al., 2013). Species such as Quercus rotundifolia, Pinus pinea, Pinus pinaster and Eucalyptus globulus are widely dispersed in the study area occurring in the 69%, 75%, 60% and 91% of the cells, respectively. Eucalyptus globulus and Pinus pinaster, although widely distributed, are dominant in only 15% and 3% of the forested area, respectively (Figures 4 and 5). Quercus rotundifolia is more localized in the southern and eastern parts of the study area and generally less represented in areas where Quercus suber dominates (Figures 4 and 5).
26
Figure 5: Distribution of lands dominated by Quercus suber, Quercus rotundifolia, Eucalyptus globulus, Pinus pinaster and Pinus pinea in the study area.
27
Thus Quercus suber is the most abundant species in the study area followed by Eucalyptus globulus, Quercus rotundifolia, Pinus pinea and Pinus pinaster (Figure 6 and Table 2).
Figure 6: Percentage of the study area in which each of the 4 tree species occurring in the study area are dominant. Data from the National Forest Inventory (Autoridade Florestal Nacional, 2010).
Table 2: Percentage of study area grid cells in which each of the species occurs, and in which each species has the widest distribution, not considering Quercus suber.
% of cells Quercus rotundifolia Eucalyptus globulus Pinus pinaster Pinus pinea Quercus suber
Species
ocurrence 69.44 91.11 60 75 100
Species
dominance 41.11 37.77 2.22 18.89 -
Relationships among other species occurring in the study area can be seen in Appendix II: Other species analysis.
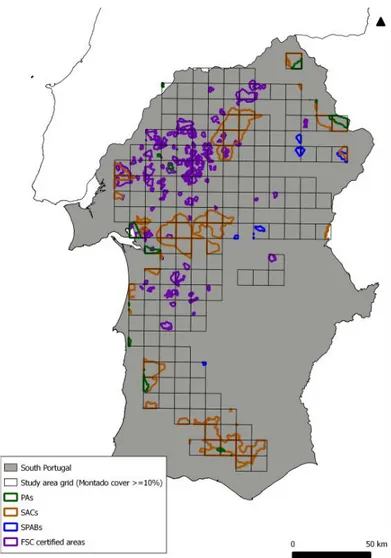
There are different classified areas occurring in the study area including Protected Areas (PAs), Special Protection Areas for Birds (SPABs) and Special Areas of Conservation (SACs) (Figure 7). The area under Forest Stewardship Council (FSC) certification is also considerable (Figure 7).
Quercus rotundifolia 10.27% Eucalyptus globulus 15.16% Pinus pinaster 2.73% Pinus pinea 6.81% Quercus suber 65.03%
28
Figure 7: Delimitation of different conservation strategies in the study area: Protected Areas of Portugal (PAs) from the Institute for Conservation of Nature and Forests; Special Protection Areas for Birds (SPABs) and Special Areas of Conservation (SACs)
from the European Environmental Agency; FSC certified areas from FSC Portugal.
2.2. The HCVA framework
The High Conservation Value Areas (HCVA) framework (www.hcvnetwork.org) was used to compile information on biodiversity and Ecosystem Services of the study area. HCVAs are those areas where forest biodiversity or Ecosystem Services (ES) are of significance or critical importance (Jennings et al., 2003). HCVA is an international standard that is regionally and nationally adapted through a process of stakeholder public participation (Branco et al. 2010). In Portugal, public participation involved Forest and Nature Conservation public administration entities, landowner associations, environmental NGOs, Universities, research groups and other entities (www.fscportugal.org). In this thesis hotspot areas for biodiversity and ES are considered those areas where biodiversity values and Ecosystem Services overlap geographically (e.g. Anderson et al., 2009; Chan et al., 2006; Egoh et al., 2008; Nelson et al., 2009; Onaindia et al., 2012). Data on biodiversity and ES attributes were considered as below, following the Portuguese interpretation of HCVA. For biodiversity:
Total species richness: number of threatened birds, amphibians and reptiles occurring in a cell of the study area;
29
Richness of amphibians and reptiles: number of amphibians and reptiles occurring in a cell of the study area.
Data on Ecosystem Services was:
Above ground carbon storage: forest biomass(not considering soil carbon storage); Location of aquifers and their water recharge rates (water catchment).
Cells in study areas were classified according to percentiles of occurrence of biodiversity (number of species) and Ecosystem Services (tons of carbon storage/ha and mm/year of water recharge rates) attributes of that cell.
We then identified those areas (cells) where biodiversity and Ecosystem Services were spatially coincident in the study area: hotspot areas for biodiversity and Ecosystem Services (Branco et al., 2010; Egoh et al., 2008; Onaindia et al., 2012) using two combinations of biodiversity values and Ecosystem Services:
Biodiversity as total species richness, carbon storage higher than 83.25 ton CO2
eq/ha and location of aquifer and water recharge rates above 175 mm/year. Biodiversity as bird richness, carbon storage higher than 83.25 ton CO2 eq/ha and
location of aquifer and water recharge rates above 175 mm/year.
Considered values for carbon storage and water recharge rates are average values for above ground carbon storage and aquifer water recharge rates estimated for the cork oak montado in the study area and as defined in HABEaS (www.habeas-med.org). HABEaS is a WebGIS tool developed by a partnership among the Mediterranean program of the World Wide Fund for Nature (WWF), a global non-governmental organization on nature conservation, the University of Lisbon (School of Agriculture, Centre for Applied Ecology) and Faunalia, a consultancy company on open-source GIS software. This tool uses the High Conservation Value Concept (www.hcvnetwork.org) to integrate biodiversity and Ecosystem Services data from different sources and assess the conservation value of different areas. We used bird diversity (Equipa Atlas, 2008) as a surrogate for overall biodiversity as it has been done in other works (e.g. Burgas et al., 2014; Gregory et al., 2003; Lindenmayer et al., 2000; Schulze et al., 2004).
Reptiles and amphibians were excluded from the analysis as, comparatively to birds, there was a very low number of identified species in the study area. Detailed data on biodiversity can be consulted in Appendix I: Original dataset and Appendix III: Species catalogue.
The study area was classified according to values of biodiversity an Ecosystem Services attributes using the percentiles 25, 50 and 75, (values under which there are the 25, 50 or 75% of the sample units, respectively, in our case 10x10 km UTM cells) as thresholds for number of species occurring in the study area as well as values of carbon storage and aquifer water recharge rates. HCVAs cells can then be defined according to the percentile of each conservation attribute observed. We also identified those cells for which conservation attributes had values above average. Detailed data on carbon storage and location of aquifers and their recharge rates can be consulted in Appendix I: Original dataset.
31
33
3.1. Location of High Conservation Value Areas
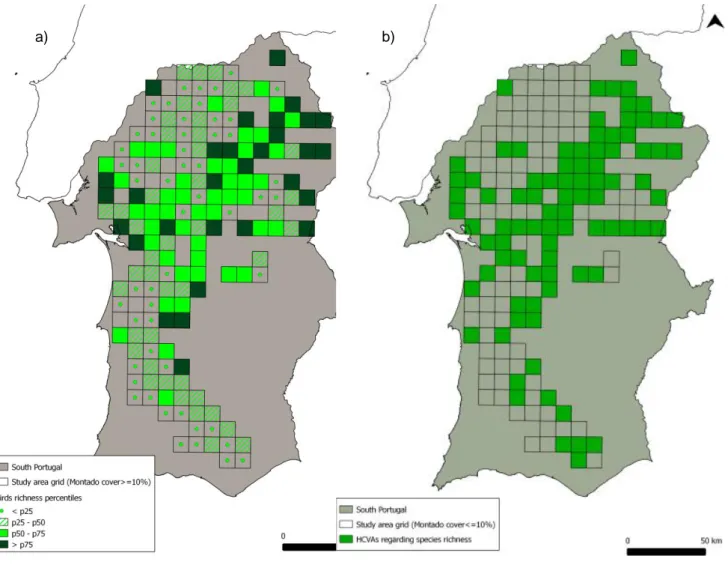
3.1.1. BiodiversityWithin the study area there were 179 cells (out of 180 cells) where at least 4 species of threatened birds, amphibians and reptiles were present. These cells were classified as having biodiversity value. The number of species (threatened birds amphibians and reptiles per individual cell) in the study area varied between 0 (one cell) and 18 (6 cells). The most represented species were the birds Oenanthe hispanica and Burhinus oedicnemus which occurred in 89 and 87 cells respectively. The cells with a higher number of species were concentrated in the northeast part of the study area (Figure 8-a). In contrast, most of biodiversity cells occurring in percentile 25 were located in the northwest part of the study area where cork oak cover is dominant. The average number of species (threatened birds amphibians and reptiles) per cell was 6, ranging between 0 and 18 species. Cells with a number of species above the average tended to be concentrated in the eastern part of cork oak distribution (Figure 8-b).
Figure 8-a: Classification of the study area grid cells according to the percentiles of species richness. pX = percentile X. Percentile X is the value under which there are located the X% of the total measurements (in this case species richness per
cell). p25 = 4 species; p50 = 6 species; p75 = 8 species; 8-b: Classification of cells as HCVAs considering occurrence of species per cell above average value of total species richness (6 species per cell).
34
Threatened bird species occurred in 175 cells in the study area. These cells were evenly distributed, although slightly concentrated in the central part of the study area (Figure 9-a and b). The group of threatened bird species include species such as Ardeola ralloides (Critically Endangered), Circus cyaneus (Critically Endangered), Emberiza schoeniclus (Vulnerable), Fulica cristata (Critically Endagered), Locustells luscinioides (Vulnerable) and Pterocles orientalis (Endangered). These species were only present in single cells in the study area. These cells may thus be considered as key priority areas for the conservation of these species. In contrast, there were species occurring in more than 50% of the cells. Examples are: Oenanthe hispanica (Vulnerable), Burhinus oedicnemus (Vulnerable), and Circus pygargus (Endagered). The average number of threatened birds per cell in the study area was 3 with121 cells with more than 3 threatened bird species (Figure 9-b).
Figure 9-a: Classification of the study area grid cells according to the percentiles of threatened birds‟ richness. pX = percentile X. Percentile X is the value under which there are located the X% of the total measurements (in this case birds richness per cell). p25 = 3 species; p50 = 5 species; p75 = 7 species; 9-b: Distribution of HCVAs regarding the average value of threatened
birds among the study area grid (3 species of threatened birds per cell).
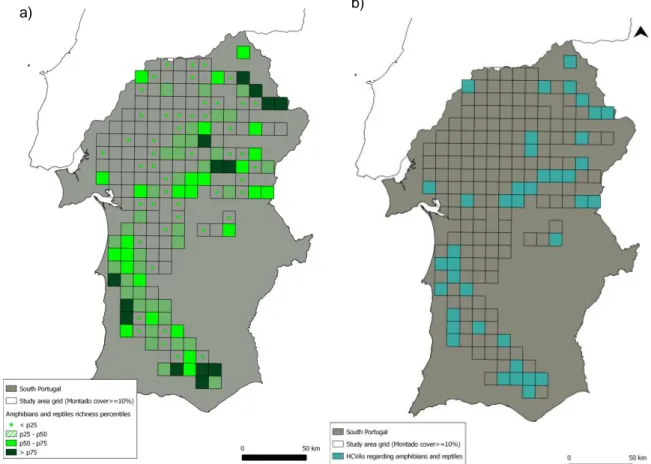
The number of endemic and threatened amphibians and reptiles per individual cell in the study area varied between 0 and 7 (only one cell with 7 species). Most of these cells tended to be concentrated in the northeast and south part of the study area (Figure 10-a). The distribution of reptiles tends to be grouped in the northeast and southwest of the study area, while that of amphibians and birds was more randomly distributed; there were 4 cells located in the west part of the study area where endemic reptiles and amphibians occur but with no occurrence of threatened birds (Appendix I: Original dataset). The most abundant endemic species of reptiles and amphibians were Alytes cisternasii
35
(amphibian, Least Concern), Lissotriton boscai (amphibian, Least Concern), present in 99 and 68 of the study area cells respectively. The scarcest were Rana iberica (amphibian, Least Concern) and Lacerta schreiberi (reptile, Least Concern) only present in 7 and 3 cells respectively. Although scarce in the South, both species are common in the north of Portugal. Regarding occurrence of threatened reptiles, Emys orbicularis (Endangered, present in 15 cells) is the most widespread reptile species and Vipera latasti (Vulnerable, in 7 cells) the less widespread reptile species. The average number of endemic amphibians and reptiles per cell in the study area is 2. Cells containing more than 2 endemic sspecies of amphibians and reptiles are randomly distributed within the study area (Figure 10-b).
Figure 10-a: Classification of the study area grid cells according to the percentiles of amphibians and reptiles richness. pX = percentile X. Percentile X is the value under which there are located the X% of the total measurements (in this case amphibians
and reptiles richness per cell). p25 = 3 species; p50 = 5 species; p75 = 7 species; 10-b: Distribution of HCVAs regarding the average value of reptiles and amphibians among the study area grid (2 species per cell).
3.1.2. Ecosystem Services
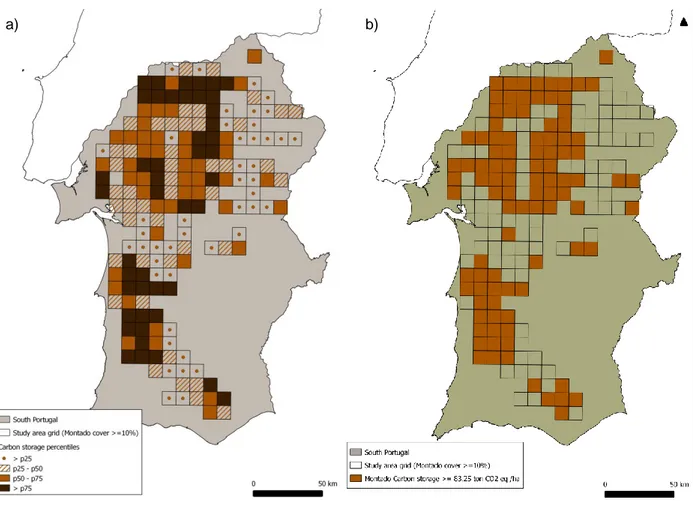
The higher levels of carbon storage of montados are concentrated in the west part of the study area (Figure 11-a). This is an area concentrating higher cork oak cover and possibly a higher number of trees/ha. The average value of carbon storage in the study area due to cork oak is 83.25 ton eq CO2/ha. Approximately 50% of the cells in the study area have a carbon storage equal or above this
value (Figure 11-b).
36
Figure 11-a: Classification of the study area grid cells according to the percentiles of carbon storage due to montados. pX = percentile X. Percentile X is the value under which there are located the X% of the total measurements (in this case ton CO2 eq/ha per cell). p25 = 80.40 ton CO2 eq/ha; p50 = 83.74 ton CO2 eq/ha; p75 = 86.30 ton CO2 eq/ha; 11-b: Distribution of cells in
the study area with carbon storage due to montados equal or above 83.25 ton eq CO2/ha.
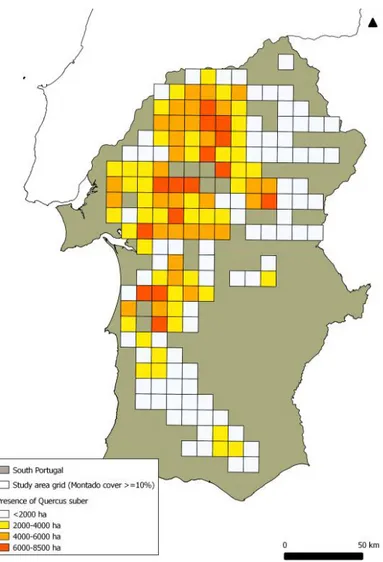
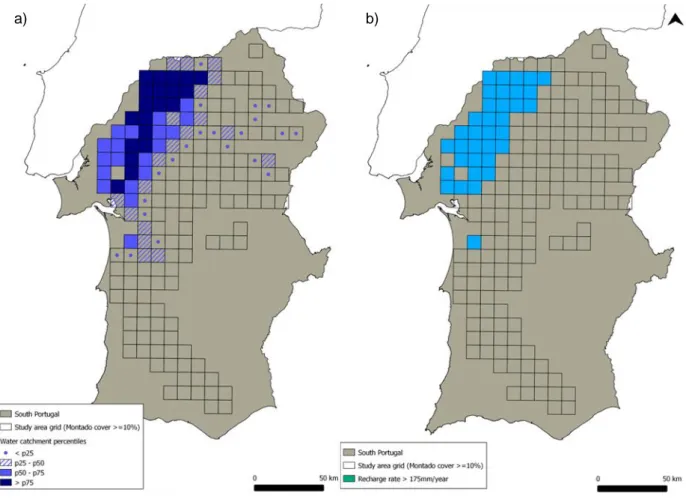
In relation to water related services the study area includes the most important aquifer of the Iberian Peninsula: the Tagus-Sado aquifer system (Branco et al. 2010). Approximately 40% of this area is covered by cork oak montado (Branco et al. 2010). This region is concentrated in the northern part of the study area (Figures 12-a and b). The average aquifer water recharge rate of the Tagus-Sado system is 175 mm/year. There were 35 cells (19% of study area) in the study area with water recharge rates equal or above that value (Figures 12-a and b).
37
Figure 12-a: Classification of the study area grid cells according to the percentiles of aquifer recharge rates (recharge rates). pX = percentile X. Percentile X is the value under which there are located the X% of the total measurements (in this case water echarge rates). p25 = 62.77 mm/year; p50 = 156.18 mm/year; p75 = 204.98 mm/year; 12-b: Cells in study area with recharge
rates equal or above 175 mm/year.
3.2. Hotspot areas for biodiversity and Ecosystem Services (ES)
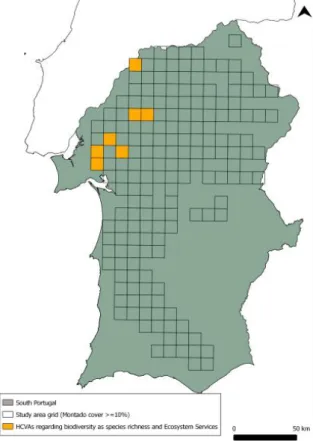
To identify areas concentrating biodiversity and Ecosystem Services values in the study area we overlapped GIS layers of estimated conservation attributes. Areas concentrating high biodiversity and high carbon storage in montados were concentrated in the central part of study area (Figure 13-a). These areas could be defined as carbon-biodiversity rich areas. Similar analysis for areas concentrating high biodiversity and high water recharge rates showed a limited number of cells overlapping with aquifer location, in the northern part of the study area (Figure 13-b). These areas could be defined as water-biodiversity rich areas (Figure 14).
38
Figure 13-a: HCVAs regarding biodiversity as species richness and carbon storage among the study area grid; 13-b: HCVAs regarding biodiversity as species richness and water catchment rates among the study area grid.
Figure 14: HCVAs resulting from overlapping biodiversity as species richness, carbon storage and water catchment.
Similarly we can identify montado “hotspot areas” that concentrate threatened bird species and are carbon rich (Figure 15-a) or have high aquifer water recharge rates (Figure 15-b) or both (Figure 16).
b) a)
39
Figure 15-a: HCVAs regarding biodiversity as threatened birds‟ richness and carbon storage among the study area grid; 15-b: HCVAs regarding biodiversity as threatened birds‟ richness and water catchment rates among the study area grid.
Figure 16: HCVAs resulting from overlapping biodiversity as threatened birds‟ richness, carbon storage and water catchment.
As expected, cells of high water recharge rates had a restricted distribution, overlapping with aquifer location, while for carbon storage these cells were more widely distributed across the study area.
40
3.3. Relationship between High Conservation Value Areas, classified areas and
areas under FSC certification
There was not a major geographical overlap between areas defined as of High Conservation Value (HCVAs) and the distribution of classified areas (Tables 3 to 5). The majority of the area classified as of conservation value, either because it concentrated biodiversity or Ecosystem Services attributes, was mostly not covered by classified areas. For example, Protected Areas, or areas for Special Protection of Birds included a relatively low proportion of HCVA cells (Tables 3 and 4). There was only one exception to this relating with the occurrence of endemic species of amphibians and reptiles. Approximately half of the cells containing endemic reptiles and amphibians were located under Special Areas of Conservation (SAC) (Table 5). SACs, a strategy implemented under the Natura 2000 network, is very extensive in the study area which may partially contribute to explain the results. Generally, distribution of classified areas did not overlap with identified HCVAs cells.
Table 3: Percentage of HCVAs inside cells with more than 10%, less than 10% and 0% of the area included in the network of Protected Areas of Portugal (PAs).
% Protected Areas in cells >10 % 0-10% 0%
HCVAs regarding species richness 4.60 6.90 88.51
HCVAs regarding birds richness 33.33 6.61 60.06
HCVAs regarding amphibians and reptiles richness 7.50 20.00 72.50
HCVAs regarding carbon storage 1.85 7.41 90.74
HCVAs regarding water catchment 0.00 8.57 91.43
HCVAs regarding biodiversity as species richness and
Ecosystem Services 0.00 14.29 85.71
HCVAs regarding biodiversity as birds richness and
Ecosystem Services 0.00 23.08 76.92
Table 4: Percentage of HCVAs inside cells with more than 10%, less than 10% and 0% of the area included in the network of Special Protection Areas for Birds (SPABs).
% Special Protection Areas for Birds in cells >10 % 0-10% 0%
HCVAs regarding species richness 13.79 9.20 77.01
HCVAs regarding birds richness 9.92 8.26 81.82
HCVAs regarding amphibians and reptiles richness 17.50 10.00 72.50
HCVAs regarding carbon storage 8.33 4.63 87.04
HCVAs regarding water catchment 5.71 11.43 82.86
HCVAs regarding biodiversity as species richness and
Ecosystem Services 14.29 28.57 57.14
HCVAs regarding biodiversity as birds richness and
Ecosystem Services 7.69 15.38 76.92
Table 5: Percentage of HCVAs inside cells with more than 10% and less than 10% and 0% of the area included in the network of Special Areas of Conservation (SACs).
% Special Areas of Conservation in cells >10 % 0-10% 0%
HCVAs regarding species richness 27.59 12.64 59.77
HCVAs regarding birds richness 28.10 11.57 60.33
HCVAs regarding amphibians and reptiles richness 37.50 15.00 47.50
HCVAs regarding carbon storage 28.70 7.41 63.89
HCVAs regarding water catchment 14.29 8.57 77.14
HCVAs regarding biodiversity as species richness and
Ecosystem Services 14.29 14.29 71.43
HCVAs regarding biodiversity as birds richness and
41
In relation to forest certification, results were slightly different from those obtained for classified areas. Forest Stewardship Council (FSC) certified areas have expanded recently in the cork oak montado and presently cover approximately 100 thousand ha (FSC Portugal, 2014). When comparing areas under FSC certification with identified HCVA areas, results show different trends. Indeed HCVAs regarding 1) water catchment, 2) Threatened bird richness and ES (carbon storage and aquifer recharge rates) and 3) HCVAs regarding species richness and ES were more abundant in FSC certified cells (74%, 69% and 57% of the HCVAs respectively) (Table 6). HCVA were also more abundant in cells having over 10% of FSC certified area. These results suggest that presently FSC certification in montado is covering a relatively high number of identified HCVA areas.
Table 6: Percentage of HCVAs inside cells with more than 10%, less than 10% and 0% of the area certified by the Stewardship Council (FSC certified areas).
% Forest Stewardship Council certified areas in cells >10 % 0-10% 0% HCVAs regarding species richness 11.49 20.69 67.82
HCVAs regarding birds richness 16.53 21.49 61.98 HCVAs regarding amphibians and reptiles richness 2.50 15.00 82.50 HCVAs regarding carbon storage 18.52 25.93 55.56 HCVAs regarding water catchment 42.86 31.43 25.71 HCVAs regarding biodiversity as species richness and Ecosystem
Services 42.86 14.29 42.86
HCVAs regarding biodiversity as birds richness and Ecosystem
43
45
4.1. Mapping biodiversity and Ecosystem Services: potentials and challenges
Mapping of biodiversity values and Ecosystem Services (ES) is necessary to better inform conservation policies. Since the supply and demand of ES may differ geographically (Fisher et al., 2009; Bastian et al., 2012), spatially explicit units are needed to quantify ES (Troy & Wilson, 2006). Mapping ES is a useful tool to identify priority conservation areas and support decision-making processes.Recent studies have mapped the supply of multiple ES, at global (e.g. Naidoo et al., 2008), continental (e.g. Schulp et al., 2012), national (e.g. Egoh et al., 2008, Bateman et al., 2011) or sub-national (e.g. Nelson et al., 2009; Raudsepp-Hearne et al., 2010, Willemen et al., 2010) scales. However, the lack of homogeneity in methods to quantify ES, challenges the possibility of comparing values and so conservation management planning. Each case has its own criteria and is limited by the available data. Different metrics have been proposed. Using standardized frameworks to quantify biodiversity and ES facilitates comparisons of conservation values (Crossman et al., 2013; Martínez-Harms & Balvanera, 2012; Eppink et al., 2012; Meas et al., 2012).
In the present work the High Conservation Value (HCVA) framework was used (www.hcvnetwork.org) together with WebGIS Habeas tool (www.habeas-med.org) to compile information and identify biodiversity and ES values in the cork oak montado of southern Portugal, but it can be applied to any forest ecosystem. Additionally, the HCVA framework integrates public participation processes which increases its transparency, people commitment and social benefits of using it for conservation purposes (Nordström et al. 2010). Addressing the interests of people is crucial in any conservation program.
When using HCVA for assessing the extension of spatial overlap of biodiversity and ES, it is frequently necessary to deal with different geographical scales. For example, in the present work, for the GIS analysis there was the need to unify different data sources into a standardized 10 x 10 km grid, which may have implied loss of data resolution. This may have happened when using data from the smaller 500m x 500m grid of the National Forest Inventory for identifying areas where Quercus suber is a dominant species and the distribution of those areas with that of classified areas or areas under FSC certification. Issues regarding the scale of analysis may be challenging when mapping biodiversity and ES.
4.2. Biodiversity and Ecosystem Services of cork oak montados
The present work identified the occurrence of 49 threatened bird species in the study area (see Appendix I: Original dataset). Birds are usually seen as good biodiversity surrogates, although this may vary in a case by case basis. For example, an increase or decrease in the number of bird species in an area may be related to other factors rather than proportional improvement or deterioration of their habitats and associated flora (Newton, 2004). Changes in bird populations may be related to variations of seasonal agricultural cultivation and harvest or increased nest predation (Newton, 2004). Also, a high number of species may not necessarily mean high conservation value as, for example, when dealing with species of common birds (Duelli & Obrist, 1998). In the present study, both