Electronic copy available at: http://ssrn.com/abstract=2201843
1
The role of financial, macroeconomic and non-financial information in bank loan default timing prediction*,**
Alnoor Bhimani, London School of Economics***
Mohamed Azzim Gulamhussen, Instituto Universitário de Lisboa Samuel Da Rocha Lopes, European Central Bank and Central Bank of Portugal
*
Supplemental materials are available in an online Appendix at xxx.
**We acknowledge financial support from ‘Fundação para a Ciência e Tecnologia’ (PTDC/EGE-ECO/114977/2009). ***Corresponding address: Alnoor Bhimani, London School of Economics and Political Science, Houghton Street, London, UK WC2A 2AE Tel: +44 (0) 20 7955 7329 [email protected]
Electronic copy available at: http://ssrn.com/abstract=2201843
2
The role of financial, macroeconomic and non-financial information in bank loan default timing prediction
Abstract
We assess the use of bank loan information in predicting the timing to default. We use unique data on defaults in small and medium enterprises maintained by the Central Bank of Portugal which includes financial accounting and macroeconomic indicators, as well as non-financial information. The findings are indicative of the incremental predictive ability of non-financial information over and above macroeconomic and financial accounting information in the baseline, industry, and in- and out-of-sample models. Specifically, total credit secured by firms is, as expected, negatively and significantly related to default. Gross domestic product is negatively and significantly related to default and benchmark market rate is positively and significantly associated with default. The findings also reveal that firms which are operated by partners; which have stronger financial support from partners; and which possess operational assets; exhibit lower hazards of default. The study indicates that non-financial information and macroeconomic indicators assessed alongside financial accounting data can significantly improve the forecasting performance of default models.
JEL classification: G20; G39 ; M41; M48
Keywords: Financial institutions; Corporate financial distress; Financial accounting information; Bank risk policy and regulation.
3
1. Introduction
The global financial crisis beginning in 2008 has placed the analysis of bank loan defaults high on the agenda of institutional oversight bodies. Default in the Basel framework is defined as the hazard that a borrower will fail to repay an amount owed to a bank which is reflected in the amount overdue and the time (in days) that disbursement is delayed (Basel Committee on Banking Supervision, 2005). Hazard predictors and rates are essential to the pricing of debt (and its derivatives) and in capital provisioning (see also Chava and Jarrow, 2004). Inaccurate predictors and rates can significantly increase the cost of capital of firms and banks. Measures such as the amount and the time-to-default are generally available only within banks. In this study, we consider the role of non-financial information, macroeconomic indicators and the traditional financial accounting indicators in predicting default (financial distress).
Whilst the past literature points to the potential role for non-financial accounting information in predicting financial distress (Dietrich and Kaplan, 1982), it has not directly addressed the extent to which non-financial information has incremental predictive ability over and above macroeconomic and financial accounting information. We seek to achieve this as our principal contribution. A second element of our contribution to the literature arises from our extension of previous studies which estimate the likelihood of default (whether a firm defaults or not through only binary classification) by estimating the timing of default. Timing of default is an important dimension of distress in the Basel Capital accords. Third, our study uses unique bank derived data to develop a model to predict the timing of default (financial distress) in small and medium non-listed firms. There is currently a paucity of knowledge particularly in relation to variables which are linked to default and their role in the development of predictive models of default in non-listed small and medium enterprises which are predominant in European economies. Fourth, we study the influence of a novel set of non-financial variables (financial
4
support from partners, type of management, ownership of assets and management skill), which have not been used in previous studies concerned with the timing of default.1
In prior studies of default, Beaver et al. (2005), Chava and Jarrow (2004) and Shumway (2001) formulate hazard models to predict the time it takes a firm to enter into bankruptcy (economic distress). Beaver et al. (2005) and Shumaway (2001) develop models to predict the time-to-bankruptcy in U.S. publicly-listed firms. Chava and Jarrow (2004) in particular develop a model to predict the time-to-bankruptcy in U.S. listed and non-listed firms. They show the importance of including industry effects in bankruptcy prediction models and the limited statistical significance of financial accounting indicators in models that also incorporate financial market indicators, a finding consistent with the efficient market hypothesis.
Building on this recent economic distress literature, we use unique proprietary data on non-listed firms that contain an accurate measure of the time-to-default and use a simple hazard model that considers not only financial accounting, but also macroeconomic and non-financial information (financial support from partners, type of management, ownership of assets and management skills) to determine the hazards of default at each point in time. Financial accounting indicators are relevant but are not unique in determining movement toward default. Macroeconomic and non-financial information significantly influence default events in small and medium corporations. Bank derived data on defaults and the assessment of the influence of macroeconomic and non-financial information enables us to contribute in an important manner to the literature given that past research has primarily focused on economic distress and financial accounting indicators in listed firms and to a limited extent on financial distress and macroeconomic and non-financial information in non-listed firms.
1 Information on financial support from partners is based on the indication of effective guarantees provided by partners.
5
The paper is structured as follows: we review the literature that forms the basis of models for predicting default in section 2; we detail the data sources and the analytical framework in section 3; section 4 contains our key findings and section 5 provides a summary and discussion of the main implications of our study.
2. The determinants of default
The guidelines of the Basel Committee on banking supervision (2005) instigated commercial banks to develop internal credit evaluation models to assess the hazards of borrowers entering into default that are subsequently used as key inputs in the pricing of credit (and its derivatives) and the determination of minimum capital requirements (Chava and Jarrow, 2004; Risk, 2000).2 These models are of importance for regulators in assessing pressures in the
corporate sector and for supervisors in identifying early warning signals arising from bank loan portfolios which can prove risky for banks and ultimately for the entire financial system.3 In light
of the regulatory and supervisory requirements central banks have also had to develop models to use as country benchmarks in the regulation and supervision of banking entities (Siddiqi, 2006; Glantz and Mun, 2008). The central bank models are particularly useful benchmarks for non-listed firms as commercially available models (for example the J P Morgan’s CreditMetrics and Moody’s KMV) most often use data for listed firms.4
In prior studies, default is related to the capital structure of firms: firms default on their obligations if the market value of their assets falls below a threshold determined by the respective
2 Hazard rates can be estimated implicitly by using debt prices or explicitly by using actual defaults (Jarrow et al., 2000). These hazard rates are extensively used in pricing credit derivatives (see, amongst many others, Jarrow and Turnbull, 1995).
3 Default models are particularly useful in assessing the solidity of banks and of the overall financial system through the capital buffers held by banks in relation to the hazards of default in their loan portfolio. The hazards of default (and the composition of the loan portfolio and recovery rates) are key inputs for calculating the riskiness of the loan portfolios and the required capital buffers. The greater the hazards of default the greater the capital buffer required by banks.
4 Data on defaults for non-listed firms are not easily accessible. Many commercial firms are expending significant resources to develop benchmarks for non-listed firms (see for example Moody’s, 2000 a, b).
6
default model. Restricted liability creates incentives for partners to default and to shift ownership to lenders and consequently ensure a minimum limit in the settlement of their equity (Duffie and Singleton, 2003). This framework is the basis of the benchmark credit risk models (for example the J P Morgan’s CreditMetrics and Moody’s KMV). The inputs required for these models, in particular market based data that is available for listed firms but not for non-listed firms, limit their applicability to the present study. Statistical models that use regression analyses to assess the influence of changes in variables relevant to the financial situation of firms to identify the risk of default are useful in relation to non-listed firms. Generally, financial ratios play an important role in predicting default because these are precise indicators and (unlike the status of default that is available mostly within commercial and central banks) are constructed from financial reporting information that firms have to file with public and tax authorities. For example, a firm’s inability to generate operational profits or earnings before interest and tax (currently and in the future) to service debt can increase the hazards of default. Analogously, insufficient resources in the long (solvability) and short (liquidity) term can also increase the hazards of default. Altman and Saunders (1998) and Allen et al. (2004) review the vast literature on the influence of financial indicators on corporate distress (bankruptcy and default) in detail. These reviews identify the predominant use of discriminant analysis and logistic models in corporate distress prediction and the influence of several financial accounting ratios on corporate distress.
The macroeconomic setting can also significantly influence default - economic depression can hasten firm default while economic growth can delay default (Castrén et al., 2010; Jacobson et al., 2005; Lawrence et al., 1992). Lawrence et al. (1992) use a default model based on a binary classification (defaulting and non-defaulting) setting in the mobile home credit market finding significant influence of macroeconomic conditions (unemployment rate and retail sales) on default (besides payment history that is important in the home credit market). Castrén et al.
7
(2010) show that the macroeconomic conditions (GDP, equity prices, exchange rates and oil prices) influence the time series of aggregate expected default frequency measured through the financial options framework (Duffie et al., 2007) which is not applicable in the context of non-listed firms; and Jacobson et al. (2005) show that the macroeconomic conditions (output gap, inflation and interest rates) influence default in a single-period binary classification model.
Models constructed on the basis of financial reporting information assume that accounting statements give an objective view of the financial standing of firms. However, there is evidence that firms generally, and especially those entering into default, have incentives to dress their accounts (see for instance Dechow, et al., 1995).5 Non-financial information can play an
important role not only in moderating the influence of financial reporting information but also in understanding other factors driving default, especially for non-listed firms for which financial reporting information, especially in the start-up phase, may altogether not be available. Criticisms of the sole use of financial information in predicting default have led to the use of non-financial information such as age and size which are associated with stable cash flow streams. Both age and size have been found to significantly influence economic distress (see for example Westgaard and Wijst, 2001). Using this line of reasoning, Stepanova and Thomas (2002) found significant influence of several characteristics such as age and personal interests of borrowers in predicting default in personal loans. Back (2005) uses novel non-financial information on company and management history to predict payment delays, payment disturbances, reorganization and bankruptcy in Finnish firms.
Non-financial information can be useful in predicting default under several circumstances. The institutional setting, type of firms and industries can dictate the importance of non-financial
5 The influence of reporting information on the financial crisis in the specific case of banks is studied by Barth and Landsman (2010).
8
information in predicting default. For example, Beaver et al. (2005) show declining predictive ability of financial ratios in the U.S., which they ascribe to lower financial reporting quality. Along a similar line of reasoning, Beaver et al. (2011) ascribe a declining predictive ability of financial accounting information to the increased exercise of discretion in financial reporting. These studies, in particular, show the pronounced influence of financial market data to the detriment of financial ratios in predicting bankruptcy. The Portuguese institutional reporting context does not require the small and medium firms in our sample to adopt international reporting standards or to have their financial statements audited. The opacity of small and medium sized firms further enhances the role of non-financial information to the detriment of financial ratios in predicting default. The importance of non-financial information may however vary across industries. Different industries may have to subscribe to differing accounting practices and face differentiated levels of competition, which leads to differences in the predictive value of non-financial information across industries (see also Chava and Jarrow, 2004).
Our data enables us to consider distinct non-financial variables, alongside financial information and macroeconomic indicators. We examine owner-managed firms – firms that exhibit lower separation of ownership and control and consequently lower agency problems; financial support from partners – signalling the involvement and support of partners in repaying loans, and ownership of assets – assets in place to repay loans; and management skills – ability of owners and managers to formally address critical issues in the management of firms, and estimate the time-to-default, seen as an appropriate indicator in the Basel capital accord framework.
Studies on small and medium enterprises indicate critical differences between owner-managed and (comparable but) professionally-owner-managed firms. In a study of rapidly growing U.S. firms, Willard et al. (1992) reported owner-managed firms to be smaller but more profitable compared to similar professionally-managed firms. They indicated identical productivity levels
9
for both groups of firms. The two groups however differed in share price performance with owner-managed firms exhibiting lower share price performance compared to identical professionally-managed firms. These findings point toward potential agency problems in the management of small and medium enterprises. In a study of owner-managed hardware stores, Mullins (1996) revealed non-technical competencies in relationship building with customers as a key determinant of the growth of owner-managed firms. We expect owner-managed firms to exhibit lower default rates relative to comparable professionally-managed firm. Our contention is that firms with a lower separation of ownership and control, and consequently lower agency problems (Jensen and Meckling, 1976), will exhibit lower default rates.
Studies on small and medium sized firms also indicate the critical importance of financial and human capital on their survival and growth. In a survey on U.S. firms, Cooper et al. (1994) show that financial capital cushions against volatile macroeconomic conditions and enables the pursuit of more capital-intensive strategies. They point to human capital defined as the extent to which owners possess management skills (subsumed as know-how, expertise and knowledge) as key to survival and growth for small and medium enterprises. In another survey of U.S. small and medium enterprises, Brush et al. (2008) in their study of U.S. emerging organisations suggest that the possession of resources including human and financial capital, are core to firm survival. In a study of U.S. venture capital firms, Dimov and Shepherd (2005) report that human capital in the form of education and experience specific to a the particular industry is negatively associated with the proportion of companies declaring bankruptcy. A survey of U.K.-based firms by Storey (1994) also indicates owners’ experience, expertise and abilities as being key contributing factors to the survival and growth of small and medium enterprises. Our contention, in this study, is that firms possessing financial resources, support from partners and ownership of assets; and human capital in the form of management skills will exhibit lower default rates.
10
Based on the literature identified in this section, we expect financial accounting variables related to cash flows (debt and debt servicing) to be negatively associated with default. Additionally, we expect macroeconomic variables related to growth (decline, for example unemployment) to be negatively (positively) associated with default. Finally, we expect non-financial variables related to non-financial support – firms in which partners provide support; owner-managed – firms that have lower conflicts of interests between owners and managers; ownership of assets – firms that own assets to eventually repay debt obligations; and management skills – firms managed by owners or managers with prior experience or relevant education; to be negatively associated with default. We also expect non-financial information to improve the incremental predictive ability of default models based on financial accounting and macroeconomic indicators.
3. Data and method
Data assembly and sources
We use a comprehensive data set that includes information on credit status, financial accounting and macroeconomic indicators, and non-financial information for non-listed firms. We compiled this data from the Portuguese Central Bank’s databases. The Central Bank data sample allows access to not only the credit status but also to financial accounting indicators on approximately 17,000 firms (this represents 5% of the total number of non-financial firms operating in Portugal as not all firms borrow from banks; 37% of the total number of employees; and 58% of the gross value added) over the 1999–2005 period. This period includes a recession in 2001-2002 and covers the main time-span used by banks for developing default models, a requirement for the implementation of the Basel capital accord from 2006 onwards. Data on time-to-default and non-financial information at this point in time is however available for only 2,300 firms (1% of the total number of non-financial firms operating in Portugal, 14% of the total
11
number of firms that borrowed from banks, 22% of the total number of employees and 41% of the gross value added) over the 1999-2005 period. This is the data set we use for estimating a simple hazard model to predict the time-to-default in the Basel capital accord setting.
We triangulated the financial accounting and macroeconomic indicators, and non-financial information with the time-to-default. This yielded our unique dataset comprising 2,184 non-listed firms.6 The non-financial variables were also compared and confirmed through two
private data providers, the COFACE (an external credit rating institution recognized by the Portuguese Central bank), an European data provider specialized in non-listed firms; and Amadeus, a complete pan-European database containing financial and non-financial information of listed and non-listed firms. Both providers follow the data quality procedures recommended by the Basel supervisory committee to assess internal credit rating models. As a normal procedure when using official credit register data and due to supervisory confidentiality issues, the credit institutions’ names are not disclosed.
Descriptive statistics
We summarize the dataset in Table 1. The default frequency increases from 10.7% in 2000 to 28.9% in 2002 and then decreases to 14.3% in 2005 mimicking the trend in the macroeconomic environment. Following Chava and Jarrow (2004) who consider that different industries may face differing levels of competition and have different accounting conventions implying different distress rates across industries with otherwise identical financial statements, we also construct dummies for the different industries. Table 2 shows the distribution of defaults by industry (PRIMARY, MANUFACTURING, CONSTRUCTION, TRADE, HOSPITALITY, TRANSPORT AND COMMUNICATION, CONSULTANCY, REAL ESTATE and OTHER). Consistent with the findings of Chava and Jarrow (2004) some significant differences can be
12
observed in the default rates across the industries in relation to the total number of defaults. The largest default rates were observed in 2002, in particular, the HOSPITALITY sector (35.1%) and the TRADE sector (27.2%), and in 2003 in the HOSPITALITY sector (45.5%). MANUFACTURING, REAL ESTATE and TRADE experienced the highest increase in default rates (23.1%, 16.7% and 15.0%, respectively) in the period under scrutiny.
Table 3 presents the number of firms by the year in which their loans originated and the hazard rates in each of the subsequent years. Most years display similar patterns in terms of hazard rates - almost one third of the total number firms did not default after the second and third year. The significant increase in default rates in 2001 and 2002 reflects the economic downturn.
Table 4 displays the average time-to-default. Again, the decrease in the time-to-default since 1999 is evident especially in the economic downturn period of 2001-2002.
Table 5 lists the variables in each of the categories: financial, macroeconomic and non-financial information. Financial information comprises TOTAL CREDIT, SHORT-TERM DEBT/ ASSETS, CASH FLOW/ TOTAL DEBT and DEPOSITS/TOTAL CREDIT. Macroeconomic information comprises GROSS DOMESTIC PRODUCT (GDP), the EURIBOR3M and the LOAN RATE. Data that is of particular is the non-financial information. The variable TYPE OF MANAGEMENT is attributed 1 if the firm is managed by a holding company, 2 if by a group of partners, 3 if by the owner, 4 if by the owner but part-time and 5 if the firm is managed by managers. The variable FINANCIAL SUPPORT is attributed 3 if firms have very weak financial support from the partner(s); 2 for weak financial support; and 1 for firms with unlimited financial support from the partner(s). The variable OWNERSHIP OPERATIONAL ASSETS is ascribed 1 if the firm owns the operational assets, 2 if the firm owns with collateral, 3 if the firm has leased, 4 if the firms has leased without the option to purchase and 5 if the firm has rented the main operational assets. The variable MANAGEMENT
13
SKILLSis attributed 1 if the managers have strong prior work experience and education, 2 if the managers have average prior work experience and education, and 3 weak prior work experience and education.
In Table 6a, we compute the means for defaulting and non-defaulting firms. It can be observed that the financial information for the defaulting group is weaker when compared to similar data for the non-defaulting group. In a similar vein, firms in the defaulting group experienced weaker macroeconomic conditions compared to firms in the non-defaulting group. In terms of non-financial information, firms in the defaulting group are operated by managers, exhibit weaker financial support from partners, reveal more rented operational assets, and weaker management skills compared to firms in the non-defaulting group. Table 6b provides the distribution of firms in each of the categories of the non-financial indicators.
Method
We deploy the Cox’s proportional hazard model (Cox, 1972; Cox and Oakes, 1984).7
Similar models were deployed for building credit-scoring models (Narain, 1992) and for predicting default and early reimbursement in personal loans (Banasik et al., 1999, Stepanova and Thomas, 2002).8
The Cox’s proportional hazards model estimates the influence of covariates (or more commonly independent variables in the classical regression analysis) on the hazard of default without specifying a parametric form. We tested the validity of the proportional hazards over time (if the covariates that best predict default contribute to the hazard ratio in the same proportion at any point of time) by plotting the Kaplan-Meier observed survival curves alongside the Cox’s
7 Detailed discussions of proportional hazard models are also provided in Ansell and Phillips (1994), Collett, (1994), Kalbfleisch and Prentice (1980), Kaplan and Meier (1958) and Lawless (1981) amongst others. Chava and Jarrow (2004) and Chava, Stefanescu and Turnbull (2011) in particular provide a detailed discussion on the applicability of these models in distress prediction.
8 Credit scores and ratings can be determined from the hazard rates estimated in our study but the reverse is more tedious and less precise. Thomas (2000) reviews the literature on credit and behavioral scoring in detail.
14
predicted curves (for the same variables). The graphs show that the observed and predicted curves overlap, suggesting that the proportional-hazards assumption is acceptable for the data - the observations are independent and the proportional hazards are constant over time.
The findings reported in tables 7-10 show the coefficients, the standard errors and the test statistics. We specified the year 1999 as the indicator for the covariate year of loan origination. This year was also used as the reference category and was represented as a row of zeros. For industry dummies we used OTHER as the reference category. A negative hazard ratio indicates the ability of a covariate to decrease the hazard of default; a positive hazard ratio indicates otherwise. We also looked at the exponential coefficients,exp(βK), in order to interpret the ratio of the hazard for a unit change in the covariate,x , as we explain in the next Section (4). The K Wald chi-square statistic is determined by dividing individual coefficients by their standard errors and then taking the square of the result.
4. Findings
Baseline model
The main findings are summarized in Table 7, denoted hereafter as the baseline model. We report the coefficient estimates, p-values and the hazards ratios. Hazards ratios are more informative than coefficient estimates because the former gauge the likelihood of a firm defaulting with respect to the likelihood of a firm not defaulting. For continuous variables, subtracting 1 from the hazards ratio and multiplying by 100 gives the percentage change in the hazards for each unit increase in the independent variable. For categorical variables, each category (except the last) is contrasted with the last category. The hazards ratio indicates the predicted hazards of a category with respect to the last category; multiplying the hazards by 100 gives the percentage impact.
15
Panel 1 in Table 7 shows the findings for the model with just financial accounting ratios. As expected, the findings show that firms operating with more credit (TOTAL CREDIT), short-term debt (SHORT-TERM DEBT/TOTAL ASSETS) and cash flow (CASH FLOW/TOTAL DEBT) exhibit lower hazards of default. The variables are statistically significant at the 1% (TOTAL CREDIT and SHORT-TERM DEBT/TOTAL ASSETS) and 10% (CASH FLOW/TOTAL DEBT) level of significance. An increase of 1-unit in TOTAL CREDIT reduces the hazards of default by (0.83 – 1) x 100 = 17%; and an increase of 1-unit in the ratio of SHORT-TERM DEBT/TOTAL ASSETS reduces the hazards of default by (0.99– 1) x 100 = 1%. Panel 2 in Table 7 shows the findings from the model with both financial accounting and macroeconomic indicators. The likelihood ratio statistic, the difference between the -2 log-likelihood of the model with macroeconomic indicators (1,678) and without macroeconomic indicator, that is with just financial accounting indicators (1,944), is 266.5. The chi-square statistic for the incremental predictive ability of the model is again statistically significant at the level of 1%. This allows us to conclude that macroeconomic indicators have, in statistical terms, an incremental effect on our basic model of default. As expected, in terms of the macroeconomic variables, an increase in the gross domestic product (GDP) decreases the hazards of default and an increase in the benchmark interest rate (EURIBOR3M) increases the hazards of default. More specifically, a 1-unit increase in the GDP decreases the hazard of default by (0.12 – 1) x 100 = 88%; and a 1-unit increase in the EURIBOR3M increases the hazards of loan default by (3.27 – 1) x 100 =227%. In this Panel, the findings also show that TOTAL CREDIT is negatively related to default at the 5% level of significance. An increase of 1-unit in TOTAL CREDIT reduces the hazards of default by (0.90 – 1) x 100 = 10%.
Panel 3 in Table 7 shows the findings for the model with financial accounting, macroeconomic and non-financial information. The likelihood ratio statistic, the difference
16
between the -2 log-likelihood of the model with non-financial information (1,654) and with only financial accounting and macroeconomic indicators (1,678), is 24. The chi-square statistic for the incremental predictive ability of the model is again statistically significant at the level of 1%. This allows us to conclude that non-financial information has, in statistical terms, an incremental effect on our model of default with financial accounting and macroeconomic indicators. We report the findings contrasting each of the categories of the non-financial variables (except the last) with the last category. In this Panel, TYPE OF MANAGEMENT = 1, management by economic group, and 2, management by group of partners, are negatively related to default at the 10% and 1% levels of significance. The predicted hazards of default for firms in these categories are 0.48 and 0.36 times the predicted hazards of default in category 5, firms managed by others than owner or partners. FINANCIAL SUPPORT = 1, unlimited financial support from partners, and 2, limited support from partners, are both negatively related to default at the 1% and 5% levels of significance, respectively. The predicted hazards of default for firms in these categories are 0.45 and 0.55 times the predicted hazards of default for firms in category 3, limited and weak financial support from partners. In this Panel, financial indicators are not significantly related to default. But, as expected, in terms of the macroeconomic variables, an increase in the gross domestic product (GDP) decreases the hazards of default and an increase in the benchmark interest rate (EURIBOR3M) increases the hazards of default. More specifically, a 1-unit increase in the GDP decreases the hazard of default by (0.10 – 1) x 100 = 90%; and a 1-unit increase in the EURIBOR3M increases the hazards of loan default by (3.65 – 1) x 100 =265%.
Industry models
In the “Online Appendix”, henceforth OA, specifically in Tables OA.1-OA.3, we report the findings from sample partitions by industry: PRIMARY, MANUFACTURING and OTHER (aggregating the remaining sectors). The findings in terms of the incremental predictive ability of
17
the models are similar to the baseline model (Table 7). The findings relating to financial and macroeconomic information also align with the baseline model (Table 7). The findings in relation to the influence of non-financial information, type of management and financial support from partners, in the MANUFACTURING and OTHER sectors, align with the baseline model. The exception is the PRIMARY sector in which the findings differ from those of the baseline model. More specifically, in the PRIMARY sector (Panel 3, OA.1), assets owned by partners reduces the probability of default; in the MANUFACTURING sector (Panel 3, OA.2), management of firms by owners increases the probability of default; and in the OTHER sectors (Panel 3, OA.3), management of firms by partners, and financial support from partners, reduce the probability of default. These findings reinforce the need to incorporate industry effects in models for predicting distress in small and medium enterprises.
Forecasting performance
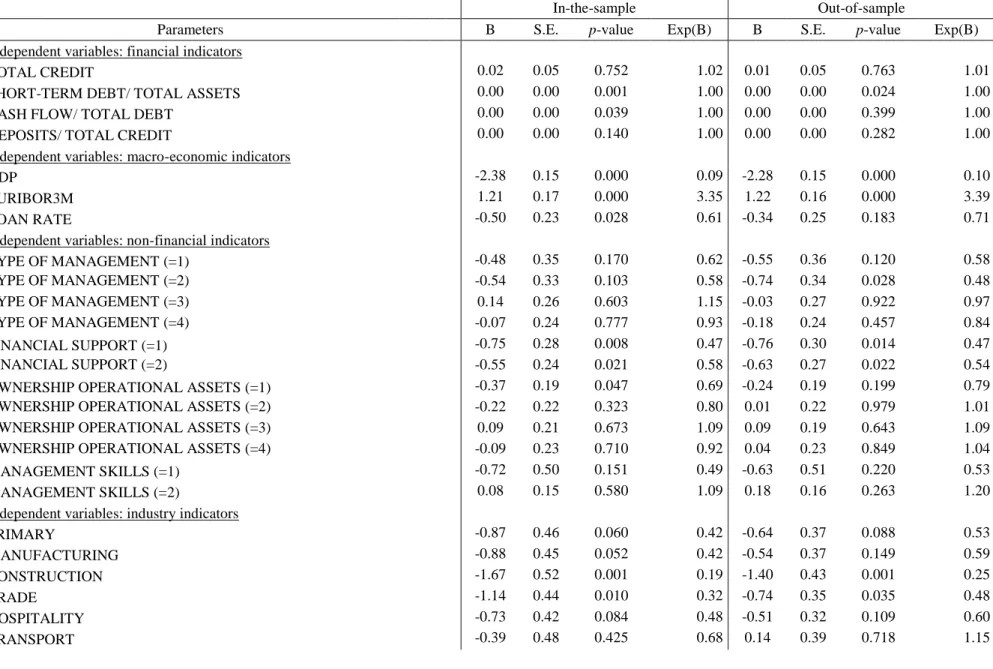
We also modelled default using a training sample and tested on a hold-out sample (Tables 8 – financial accounting information; 9 – financial accounting information and macroeconomic indicators; and 10 – financial accounting, macroeconomic and non-financial information). We specified a training sample and a testing sample, expressed as 70% (1,529 observations) and 30% (655 observations) of the total sample size, respectively. This method allowed us to produce a test of the proportional hazards assumption. The test compares the fitted model to an alternative model. The significance value for the overall test of proportional hazards is higher than 0.05, indicating that the proportional hazards assumption is not violated. The findings reported in Tables 11-13 are consistent with the findings reported in Table 7 (and Tables 8-10).
To gauge the performance of the out-of-sample model, we ranked defaulting firms in deciles as reported in Table 11. The Table shows the deciles for the 3 Panels: Panel 1 – just financial information; Panel 2 – financial and macroeconomic information; and Panel 3 –
18
financial, macroeconomic and non-financial information. Panel 3 significantly outperforms both Panel 1 (financial information) and Panel 2. For Panel 3, 48% of the defaults are correctly identified in the first decile, for Panel 2 the corresponding estimate is 38% and for Panel 1 it is 23%. For the top two deciles (in aggregate) the correct predictions are Panel 3 – 72%, Panel 2 – 61% and Panel 1 – 40%. In terms of incorrect predictions, aggregating across the bottom 5 deciles, Panel 3 misclassifies on 2%, Panel 2 – 3% and Panel 1 – 23%. This forecasting prediction confirms the validity of the model with financial, macroeconomic and non-financial information, our Panel 3.
In order to assess the out-of-sample forecasting performance of our models we also computed the Receiver operating curve (ROC). Again, we used the in-the-sample parameter estimates to forecast the hazards of the sample firms over the out-of sample period. We obtained the sampling distribution by generating 1,000 bootstrap samples over the out-of sample hazard rates (see also Chava and Jarrow, 2004). We computed the ROC for each of the 1,000 samples. We report the findings in Table 12. In this Table, the area under ROC for Panel 3 (financial, macroeconomic and non-financial information) is 90.1% and is statistically significant at the 1% confidence level. The area under the ROC for Panel 2 is 86.1% (financial and macroeconomic information) and for Panel 1 is 71.4% (financial information) and both are statistically significant at the 1% confidence level. The ROC analysis thus confirms the incremental forecasting performance of our model with financial, macroeconomic and non-financial information, a finding that is consistent with the out-of-sample decile analysis.
5. Conclusion
Default risk management takes centre-stage concern by monetary oversight bodies especially since the start of the 2008 global financial crisis. Default hazard predictors and rates are essential inputs in the pricing of debt (and its derivatives) and the determination of capital
19
provisions in the Basel capital accords. Imprecise hazard rates can significantly increase the cost of capital of firms and banks. Inaccurate predictors and rates derived from inappropriate data and methods can expose banks and ultimately the financial systems to large losses of the kind observed in the wake of the financial crisis.
In this paper we contribute to the literature in some significant ways. First, we estimate a model with financial, macroeconomic and novel non-financial information to predict default. Specifically, we directly address the extent to which non-financial information has incremental predictive ability over and above financial accounting and macroeconomic information. Second, we extend the previous literature on the estimation of the likelihood of default (whether a firm defaults or not) with binary classification techniques by estimating a model of timing of default (the time it takes a firm to enter into default after securing a loan) which represents another important dimension of distress in the Basel Capital Accords. Third, we use unique bank derived data on the timing of default in small and medium non-listed firms. Finally, we deploy a novel set of non-financial variables not used in previous studies. Our findings indicate an important and influential role of non-financial information, in particular, the type of management, whether by owners or managers, financial support from partners, and ownership of assets, in conjunction with the traditional financial and macroeconomic information in default prediction. Such non-financial information may be particularly useful in predicting default in small and medium firms for which financial information may not always be available and the quality of reporting may be lower.
Our study is of interest to supervisors and regulators particularly in wake of the recent global financial crisis. The applicability of the methodology developed in this paper has significance to supervisors and regulators who are interested in the empirical estimation and validation of models related to the Basel capital accord. The factors found to influence default
20
can be used as early warning signals in banking supervision and the average hazard rates determined in the paper can be used for assessing financial pressure arising in small and medium enterprises.
At a broader level, the universal definition of default in the Basel capital accords permits generalization of our findings across countries. The findings of our study suggest that bankers, supervisors and regulators will find value in incorporating non-financial information alongside macroeconomic and financial accounting indicators in managing and monitoring the risk of small and medium firms. A common problem with assessing the influence of financial reporting information, macroeconomic variables and non-financial information on default is that there are many indicators in each category and the literature lacks clarity about the specific indicators that can best predict financial distress. The inclusion of other financial accounting, macroeconomic and non-financial variables are likely to depend on data availability. This is a promising avenue for future research.
Acknowledgements
We benefitted from helpful discussions and suggestions made by Andrew Clare, Christine Wiedman, Duane Kennedy, Peter Wysocki, Phil Molyneux, Sarkis Khoury, and Steve Fortin. We also thank the anonymous reviewers and especially the editor for their incisive comments on earlier drafts of the paper. The views expressed in the paper are those of the authors and not of the institutions of their affiliation.
21
References
Allen, A., Delong, G. and Saunders, A. (2004) Issues in the credit risk modelling of retail markets, Journal of Banking and Finance, 28 (1), pp. 727-752.
Altman, E. I. and Saunders, A. (1998) Credit risk measurement: Developments over the last 20 years, Journal of Banking and Finance, 20 (1), pp. 1721-1742.
Ansell, J. and Phillips, M. (1994) Practical Methods for Reliability Data Analysis (Oxford: Clarendon Press).
Basel Committee on Banking Supervision (2005) Basel II: International Convergence of Capital
Measurement and Capital Standards. A Revised Framework,
http://www.bis.org/publ/bcbs118.htm, Accessed 25 January 2010.
Back, P. (2005) Explaining financial difficulties on previous payment behavior, management background and financial ratios, European Accounting Review, 14 (4), pp. 839-868.
Banasik, J., Crook, J. N. and Thomas, L. C. (1999) Not if but when loans default, Journal of
Operational Research Society, 50, pp. 1185-1190.
Barth, M. E. and Landsman, W. R. (2010) How did financial reporting contribute to the financial crisis, European Accounting Review, 19 (3), pp. 399-423.
Beaver, W. H., McNichols, M. F. and Rhie, J. W. (2005) Have financial statements become less informative: Evidence from the ability of financial ratios to predict bankruptcy, Review of
Accounting Studies, 10 (1), pp. 93-122.
Beaver, W. H., Correia, M. and McNichols, M. (2011) Do differences in financial reporting attributes impair the predictive ability of financial ratios for bankruptcy? Review of Accounting Studies, Forthcoming.
Brush, C.G., Manolova, T. S. and Edelman, L. F. (2008). Properties of emerging organizations: An empirical test, Journal of Business Venturing, 23 (5), pp. 547–566.
22
Castrén, O., Dées, S. and Zaher, F. (2010) Stress-testing euro area corporate default probabilities using a global macroeconomic model, Journal of Financial Stability, 6 (2), pp. 64-78. Chava, S. and Jarrow, R. (2004) Bankruptcy prediction with industry effects, Review of Finance,
8 (4), pp. 537-569.
Chava, S., Stefanescu, C. and Turnbull, S. (2011) Modelling the loss distribution, Management
Science, 57 (7) pp. 1267-1287.
Collett, D. (1994) Modelling Survival Data in Medical Research (London: Chapman & Hall). Cox, D. R. (1972) Regression models and life-tables, Journal of Royal Statistical Society Series,
B-74, pp. 187-220.
Cox, D. and Oakes, D. (1984) Analysis of Survival Data (London: Chapman & Hall).
Cooper, A.C., Gimeno-Gascon, F.J. and Woo, C.Y. (1994). Initial human and financial capital predictors of new venture performance, Journal of Business Venturing, 9 (5), pp. 371-395. Dietrich, J. R. and Kaplan, R. S. (1982) Empirical analysis of the loan classification decision,
Accounting Review, 57 (1), pp. 18-38.
Dechow, P. M., Sloan, R. and Sweeney, A. (1995) Detecting earnings management, Accounting
Review, 70 (2), pp: 193–225.
Dimov, D. and Shepherd, D (2005) Human capital theory and venture capital firms: exploring ‘‘home runs’’ and ‘‘strike outs’’, Journal of Business Venturing, 20 (5), pp. 1-21
Duffie, D. and Singleton, K. (2003) Credit Risk: Pricing, Measurement and Management (New Jersey: Princeton University Press).
Duffie, D., Saita, L. and Wang, K. (2007) Multi-period default prediction with stochastic covariates, Journal of Financial Economics, 83 (3), pp. 635-665.
Glantz, M. and Mun, J. (2008) The Banker's Handbook on Credit Risk: Implementing Basel II (London: Academic Press).
23
Jensen, M. C., and Meckling, W. (1976) Theory of the firm: Managerial behavior, agency costs, and ownership structure, Journal of Financial Economics, 3(4), pp. 305–360.
Jacobson, T., Lindé, J. and Kasper, R. (2005) Exploring interactions between real activity and the financial stance, Journal of Financial Stability, 1 (3), pp. 308-341.
Jarrow, R. and Turnbull, S. (1995) Pricing derivatives on financial services subject to credit risk,
Journal of Finance, 50 (1), pp. 53-85.
Jarrow, R., Lando, D. and Yu, E. (2000) Default risk and diversification: Theory and empirical implications, Mathematical Finance, 10 (2), pp. 179-196.
Kalbfleisch, J. and Prentice, R. (1980) The Statistical Analysis of Failure Time Data (New York: John Wiley & Sons).
Kaplan, E. and Meier, P. (1958) Non-parametric estimation from incomplete observations,
Journal of American Statistical Association, 53 (282), pp. 457–481.
Lawless, J. (1981) Statistical Models and Methods for Lifetime Data (Chichester: John Wiley & Sons).
Lawrence, C., Smith, L. and Rhoades, M. (1992) An analysis of default risk in mobile home credit, Journal of Banking & Finance, 2 (16), pp. 299-312.
Moody’s Investors Service (2000a) Moody’s Public Firm Risk Model: A Hybrid Approach to
Modelling Short Term Default Risk, March (New York: Moody’s).
Moody’s Investors Service (2000b) RiskCalc Private Model: Moody’s Default Model for Private
Firms, May (New York: Moody’s).
Mullins, J. W. (1996). Early growth decisions of entrepreneurs: The influence of competency and prior performance under changing market conditions, Journal of Business Venturing, 11 (2), pp. 89–105.
24
Narain, B. (1992) Survival analysis and the credit granting decision, in: L. C. Thomas, J. N. Crook and D. B. Edelman (Eds) Credit Scoring and Credit Control, pp. 109-121 (Oxford: OUP).
Risk Magazine (2000) Credit risk: A risk special report, March.
Siddiqi, N. (2006) Credit Risk Scorecards: Developing and Implementing Intelligent Credit
Scoring (New Jersey: John Wiley).
Shumway, T. (2001) Forecasting bankruptcy more accurately: A simple hazard model, Journal of
Business, 74 (1), pp. 101-124.
Stepanova, M. and Thomas, L. C. (2002) Survival analysis methods for personal loan data,
Journal of Operational Research Society, 50 (2), 277–289.
Storey, D. J. (1994). Understanding the Small Business Sector (London: Routledge).
Thomas, L. C. (2000) A survey of credit and behavioural scoring: forecasting financial risk of lending to consumers, International Journal of Forecasting, 16 (2), 149-172.
Westgaard, S. and Wijst, N. (2001) Default probabilities in a corporate bank portfolio: a logistic model approach, European Journal of Operational Research, 135 (2), pp. 338-349.
Willard, G. E., Krueger, D. A. and Feeser, H. R. (1992). In order to grow, must the founder go: A comparison of performance between founder and non-founder managed high-growth manufacturing firms, Journal of Business Venturing, 7 (3), pp. 181–194.
25 Table 1. Defaults and firms 1999-2005
Year Number of defaults Number of firms Cum. Default frequency
1999 44 2000 41 338 10.7% 2001 90 387 17.0% 2002 114 78 28.9% 2003 33 790 17.0% 2004 24 546 13.8% 2005 11 1 14.3% Total 313 2,184 14.3%
Table 2. Defaults by sector/industry 2000-2005
Industry 2000 2001 2002 2003 2004 2005 1-PRIMARY 9.8% 5.6% 11.4% 9.1% 12.5% 9.1% 2-MANUFACTURING 14.6% 6.7% 8.8% 15.2% 4.2% 27.3% 3-CONSTRUCTION 0.0% 2.2% 0.9% 6.1% 0.0% 0.0% 4-TRADE 17.1% 12.2% 27.2% 21.2% 16.7% 45.5% 5-HOSPITALITY 41.5% 33.3% 35.1% 45.5% 41.7% 18.2% 6-TRANSPORT 2.4% 15.6% 6.1% 0.0% 4.2% 0.0% 7-CONSULTANCY 14.6% 14.4% 4.4% 3.0% 4.2% 0.0% 8-REAL ESTATE 0.0% 5.6% 3.5% 0.0% 16.7% 0.0% 9-OTHER 0.0% 4.4% 2.6% 0.0% 0.0% 0.0%
26
Table 3. Survival rates after year of establishment
Year of establishment Firms
Years after establishment
0.5 1 2 3 4 1999 44 100.0% 100.0% 88.6% 45.5% 6.8% 2000 338 100.0% 99.4% 87.3% 74.0% 73.4% 2001 387 100.0% 91.0% 71.8% 70.5% 2002 78 94.9% 59.0% 57.7% 2003 790 99.5% 97.2% 97.0% 2004 546 99.3% 98.0% 98.0% 2005 1 100.0% 100.0% 100.0% Total 2,184 99.7% 96.7% 91.2% 88.0% 87.2%
Table 4. Average time-to-default
Year of establishment Firms Years after establishment
0.5 1 2 3 4 1999 44 2.7 3.6 4.4 2000 338 1.3 2.6 3.3 4.0 2001 387 1.7 2.4 3.1 2002 78 0.9 1.4 2.1 2003 790 0.9 1.1 2.1 2004 546 0.9 1.2 1.2 2005 1 Total 2,184 0.9 1.6 2.5 3.4 4.4
27 Table 5. Definition of the variables
Dependent variable
TIME-TO-DEFAULT Time-to-Default (years to first loan default) Independent variables: Financial indicators
TOTAL CREDIT Total bank credit (logarithm; million euros) SHORT-TERM DEBT/ ASSETS Short-term debt to total liquid assets
CASH FLOW/TOTAL DEBT Cash flow generated by the firm to total debt (bank credits, other loans, trade debts, etc.) DEPOSITS/TOTAL CREDIT Bank deposits to total bank credits and responsibilities (loans, guarantees, etc.)
Independent variables: Macroeconomic indicators
GDP Gross domestic product (real rate of change)
EURIBOR3M 3-month EURIBOR
LOAN RATE Average interest rate of loans to firms Independent variables: Non-financial indicators
TYPE OF MANAGEMENT Type of management (1=economic group, 2= partners, 3=owner, 4=owner part-time, 5=others managing) FINANCIAL SUPPORT Partners’ financial support to the company (1=unlimited, 2=limited, 3=limited and weak)
OWNERSHIP OF ASSETS Ownership of main operational assets (1=own, 2=own w/collateral, 3=leasing, 4=leasing without option to purchase, 5=rent) MANAGEMENT SKILLS Work experience and educational level (1=strong, 2=normal, 3=weak)
Industry
28
Table 6a. Averages for financial, macroeconomic and non-financial information
Table 6b. Percentage of firms per non-financial variables and respective categories
Variables Type of variable Non-default
status Default status Dependent variable
TIME-TO-DEFAULT continuous 0.00 2.31
Independent variables: financial indicators
TOTAL CREDIT continuous 9.48 9.32
SHORT-TERM DEBT/ TOTAL ASSETS continuous 76.31% 8.89%
CASH FLOW/ TOTAL DEBT continuous 3.05% 0.26%
DEPOSITS/ TOTAL CREDIT continuous 43.07% -6.49%
Independent variables: macro-economic indicators
GDP continuous 2.44% 0.94%
EURIBOR3M continuous 2.70% 3.59%
LOAN RATE continuous 5.01% 5.89%
Independent variables: non-financial indicators
TYPE OF MANAGEMENT categorical 3.36 3.58
FINANCIAL SUPPORT categorical 1.29 1.82
OWNERSHIP OPERATIONAL ASSETS categorical 1.98 2.94
MANAGEMENT SKILLS categorical 1.51 2.33
Independent variables: industry indicators
INDUSTRY/SECTOR Binary Refer to Table 2
Variables Type of variable Non-default
status Default status Independent variables: non-financial indicators
TYPE OF MANAGEMENT (=1) polychotomous 9.51% 5.75%
TYPE OF MANAGEMENT (=2) polychotomous 15.02% 3.51%
TYPE OF MANAGEMENT (=3) polychotomous 6.57% 24.28%
TYPE OF MANAGEMENT (=4) polychotomous 68.09% 59.74%
TYPE OF MANAGEMENT (=5) polychotomous 0.80% 6.71%
FINANCIAL SUPPORT (=1) polychotomous 71.14% 28.12%
FINANCIAL SUPPORT (=2) polychotomous 28.27% 61.66%
FINANCIAL SUPPORT (=3) polychotomous 0.59% 10.22%
OWNERSHIP OPERATIONAL ASSETS (=1) polychotomous 63.66% 34.50%
OWNERSHIP OPERATIONAL ASSETS (=2) polychotomous 3.15% 9.90%
OWNERSHIP OPERATIONAL ASSETS (=3) polychotomous 13.79% 13.42%
OWNERSHIP OPERATIONAL ASSETS (=4) polychotomous 10.58% 11.18%
OWNERSHIP OPERATIONAL ASSETS (=5) polychotomous 8.82% 30.99%
MANAGEMENT SKILLS (=1) polychotomous 53.23% 5.43%
MANAGEMENT SKILLS (=2) polychotomous 42.28% 56.23%
29 Table 7. Baseline model COX regressions
Panel 1 Panel 2 Panel 3
Parameters B S.E. p-value Exp(B) B S.E. p-value Exp(B) B S.E. p-value Exp(B) Independent variables: financial indicators
TOTAL CREDIT -0.19 0.04 0.000 0.83 -0.11 0.05 0.025 0.90 -0.03 0.05 0.604 0.97
SHORT-TERM DEBT/ TOTAL ASSETS -0.01 0.00 0.000 0.99 0.00 0.00 0.003 1.00 0.00 0.00 0.001 1.00
CASH FLOW/ TOTAL DEBT 0.00 0.00 0.069 1.00 0.00 0.00 0.053 1.00 0.00 0.00 0.186 1.00
DEPOSITS/ TOTAL CREDIT 0.00 0.00 0.230 1.00 0.00 0.00 0.244 1.00 0.00 0.00 0.165 1.00
Independent variables: macro-economic indicators
GDP -2.09 0.16 0.000 0.12 -2.32 0.18 0.000 0.10
EURIBOR3M 1.19 0.17 0.000 3.27 1.30 0.19 0.000 3.65
LOAN RATE -0.40 0.28 0.162 0.67 -0.11 0.29 0.708 0.90
Independent variables: non-financial indicators
TYPE OF MANAGEMENT (=1) -0.74 0.42 0.082 0.48 TYPE OF MANAGEMENT (=2) -1.02 0.35 0.004 0.36 TYPE OF MANAGEMENT (=3) -0.22 0.31 0.488 0.80 TYPE OF MANAGEMENT (=4) -0.32 0.28 0.246 0.72 FINANCIAL SUPPORT (=1) -0.80 0.29 0.006 0.45 FINANCIAL SUPPORT (=2) -0.59 0.26 0.022 0.55
OWNERSHIP OPERATIONAL ASSETS (=1) -0.33 0.21 0.117 0.72
OWNERSHIP OPERATIONAL ASSETS (=2) -0.26 0.25 0.310 0.77
OWNERSHIP OPERATIONAL ASSETS (=3) 0.12 0.22 0.602 1.12
OWNERSHIP OPERATIONAL ASSETS (=4) 0.08 0.25 0.755 1.08
MANAGEMENT SKILLS (=1) -0.49 0.51 0.340 0.61
MANAGEMENT SKILLS (=2) 0.24 0.17 0.154 1.28
Independent variables: industry indicators
PRIMARY -0.99 0.46 0.034 0.37 -0.76 0.65 0.244 0.47 -0.90 0.64 0.159 0.41 MANUFACTURING -1.39 0.47 0.003 0.25 -0.71 0.64 0.268 0.49 -0.89 0.63 0.159 0.41 CONSTRUCTION -1.62 0.60 0.007 0.20 -1.36 0.82 0.098 0.26 -1.50 0.82 0.069 0.22 TRADE -0.96 0.42 0.024 0.38 -0.77 0.64 0.228 0.46 -0.91 0.61 0.133 0.40 HOSPITALITY -1.22 0.42 0.004 0.29 -0.73 0.62 0.239 0.48 -0.71 0.59 0.229 0.49 TRANSPORT -1.31 0.44 0.003 0.27 -0.36 0.66 0.583 0.70 -0.48 0.65 0.463 0.62 CONSULTANCY -1.41 0.45 0.002 0.24 -0.64 0.69 0.358 0.53 -0.85 0.66 0.198 0.43
30
REAL ESTATE -1.01 0.45 0.026 0.37 -1.04 0.71 0.146 0.35 -1.03 0.66 0.121 0.36
Model Fit
Num. observations 2,184 2,184 2,184
-2 Log Likelihood 1,944 1,678 1,654
χ2 Log Likelihood comparison (change in -2LL) 266.5 24.0
Parameters added (difference of df) 3 4
Prob > χ2 0.000 0.000
All variables are defined in Table 5.
31 Table 8. Base model COX regressions (in-the-sample and out-of-sample)
In-the-sample Out-of-sample
Parameters B S.E. p-value Exp(B) B S.E. p-value Exp(B)
Independent variables: financial indicators
TOTAL CREDIT -0.08 0.05 0.099 0.92 -0.10 0.05 0.028 0.90
SHORT-TERM DEBT/ TOTAL ASSETS -0.01 0.00 0.000 0.99 -0.01 0.00 0.001 1.00
CASH FLOW/ TOTAL DEBT -0.01 0.00 0.000 1.00 0.00 0.00 0.164 1.00
DEPOSITS/ TOTAL CREDIT 0.00 0.00 0.659 1.00 0.00 0.00 0.792 1.00
Independent variables: industry indicators
PRIMARY MANUFACTURING -0.21 0.35 0.540 0.81 -0.11 0.34 0.748 0.90 CONSTRUCTION -0.74 0.34 0.031 0.48 -0.38 0.34 0.261 0.68 TRADE -0.66 0.48 0.167 0.52 -0.39 0.48 0.423 0.68 HOSPITALITY -0.51 0.30 0.088 0.60 -0.19 0.31 0.543 0.83 TRANSPORT -0.64 0.28 0.022 0.53 -0.35 0.29 0.236 0.71 CONSULTANCY -0.34 0.31 0.272 0.71 -0.15 0.32 0.633 0.86 REAL ESTATE -0.86 0.30 0.005 0.43 -0.57 0.31 0.066 0.56 Model Fit Num. observations 1,529 655 -2 Log Likelihood 1,789 2,059
32 Table 9. Base model COX regressions (in-the-sample and out-of-sample)
In-the sample Out-of-sample
Parameters B S.E. p-value Exp(B) B S.E. p-value Exp(B)
Independent variables: financial indicators
TOTAL CREDIT -0.07 0.05 0.121 0.93 -0.04 0.04 0.364 0.96
SHORT-TERM DEBT/ TOTAL ASSETS 0.00 0.00 0.014 1.00 0.00 0.00 0.024 1.00
CASH FLOW/ TOTAL DEBT 0.00 0.00 0.027 1.00 0.00 0.00 0.101 1.00
DEPOSITS/ TOTAL CREDIT 0.00 0.00 0.245 1.00 0.00 0.00 0.347 1.00
Independent variables: macro-economic indicators
GDP -2.23 0.15 0.000 0.11 -2.12 0.15 0.000 0.12
EURIBOR3M 1.23 0.16 0.000 3.42 1.17 0.16 0.000 3.23
LOAN RATE -0.75 0.24 0.002 0.47 -0.54 0.25 0.028 0.58
Independent variables: industry indicators
PRIMARY -0.68 0.48 0.159 0.51 -0.55 0.39 0.154 0.58 MANUFACTURING -0.56 0.45 0.223 0.57 -0.36 0.36 0.317 0.70 CONSTRUCTION -1.38 0.51 0.007 0.25 -1.22 0.44 0.005 0.30 TRADE -0.91 0.45 0.043 0.40 -0.64 0.35 0.068 0.53 HOSPITALITY -0.65 0.43 0.130 0.52 -0.53 0.33 0.112 0.59 TRANSPORT 0.02 0.47 0.963 1.02 0.23 0.37 0.534 1.26 CONSULTANCY -0.49 0.50 0.325 0.61 -0.33 0.40 0.400 0.72 REAL ESTATE -1.16 0.53 0.029 0.31 -0.90 0.46 0.049 0.41 Model Fit Num. observations 1,529 655 -2 Log Likelihood 1,802 2,071
33
Table 10. Base model COX – Categorical non-financial variables (contrast of each category against the last category)
In-the-sample Out-of-sample
Parameters B S.E. p-value Exp(B) B S.E. p-value Exp(B)
Independent variables: financial indicators
TOTAL CREDIT 0.02 0.05 0.752 1.02 0.01 0.05 0.763 1.01
SHORT-TERM DEBT/ TOTAL ASSETS 0.00 0.00 0.001 1.00 0.00 0.00 0.024 1.00
CASH FLOW/ TOTAL DEBT 0.00 0.00 0.039 1.00 0.00 0.00 0.399 1.00
DEPOSITS/ TOTAL CREDIT 0.00 0.00 0.140 1.00 0.00 0.00 0.282 1.00
Independent variables: macro-economic indicators
GDP -2.38 0.15 0.000 0.09 -2.28 0.15 0.000 0.10
EURIBOR3M 1.21 0.17 0.000 3.35 1.22 0.16 0.000 3.39
LOAN RATE -0.50 0.23 0.028 0.61 -0.34 0.25 0.183 0.71
Independent variables: non-financial indicators
TYPE OF MANAGEMENT (=1) -0.48 0.35 0.170 0.62 -0.55 0.36 0.120 0.58 TYPE OF MANAGEMENT (=2) -0.54 0.33 0.103 0.58 -0.74 0.34 0.028 0.48 TYPE OF MANAGEMENT (=3) 0.14 0.26 0.603 1.15 -0.03 0.27 0.922 0.97 TYPE OF MANAGEMENT (=4) -0.07 0.24 0.777 0.93 -0.18 0.24 0.457 0.84 FINANCIAL SUPPORT (=1) -0.75 0.28 0.008 0.47 -0.76 0.30 0.014 0.47 FINANCIAL SUPPORT (=2) -0.55 0.24 0.021 0.58 -0.63 0.27 0.022 0.54
OWNERSHIP OPERATIONAL ASSETS (=1) -0.37 0.19 0.047 0.69 -0.24 0.19 0.199 0.79
OWNERSHIP OPERATIONAL ASSETS (=2) -0.22 0.22 0.323 0.80 0.01 0.22 0.979 1.01
OWNERSHIP OPERATIONAL ASSETS (=3) 0.09 0.21 0.673 1.09 0.09 0.19 0.643 1.09
OWNERSHIP OPERATIONAL ASSETS (=4) -0.09 0.23 0.710 0.92 0.04 0.23 0.849 1.04
MANAGEMENT SKILLS (=1) -0.72 0.50 0.151 0.49 -0.63 0.51 0.220 0.53
MANAGEMENT SKILLS (=2) 0.08 0.15 0.580 1.09 0.18 0.16 0.263 1.20
Independent variables: industry indicators
PRIMARY -0.87 0.46 0.060 0.42 -0.64 0.37 0.088 0.53 MANUFACTURING -0.88 0.45 0.052 0.42 -0.54 0.37 0.149 0.59 CONSTRUCTION -1.67 0.52 0.001 0.19 -1.40 0.43 0.001 0.25 TRADE -1.14 0.44 0.010 0.32 -0.74 0.35 0.035 0.48 HOSPITALITY -0.73 0.42 0.084 0.48 -0.51 0.32 0.109 0.60 TRANSPORT -0.39 0.48 0.425 0.68 0.14 0.39 0.718 1.15
34 CONSULTANCY -0.71 0.49 0.154 0.49 -0.48 0.38 0.212 0.62 REAL ESTATE -1.41 0.49 0.004 0.24 -0.95 0.41 0.021 0.39 Model Fit Num. observations 1,529 655 -2 Log Likelihood 1,931 2,048
35
Table 11. Forecasting accuracy
Percentage of defaults predicted by the model in each decile
Panel 1 With financial accounting indicators Panel 2 With financial and macroeconomic indicators Panel 3 With financial, macroeconomic and non-financial information Decile 1 0.23 0.38 0.48 2 0.17 0.23 0.24 3 0.14 0.17 0.14 4 0.12 0.12 0.07 5 0.10 0.04 0.03 6 0.09 0.03 0.02 7 0.07 8 0.04 9 0.03 10
Table 12. Forecasting accuracy – area under the ROC curves
Area under the ROC curves
Panel 1 With financial accounting information Panel 2 With financial and macroeconomic indicators Panel 3 With financial, macroeconomic and non-financial information Area 0.71 0.86 0.90 Std. Error 0.01 0.01 0.01 Asymptotic Sig. 0.00 0.00 0.00
Asymptotic 95% Confidence Interval
Lower Bound 0.69 0.84 0.88