This thesis aims to create a system to manage the data flow of the sensor and monitor the ownership as well as the logistical process of sensor delivery. Consequently, at the end of this thesis, the system passed the testing process and was running on the company server for management purposes. Furthermore, the main goal of the project was to provide sensor suppliers with a method to remotely control the condition of sensors belonging to specific customers.
There are different users in this system, therefore, the system was also required for security and authentication methods. The purpose of these requirements was to ensure the performance and quality of the system at the end of the development process. First, data processing must be handled in a precise and well-structured way since the main objective of the project was to manage the data flow of the system.
To achieve this goal, the system architecture must be well designed and the functionality of each component must work properly. It was important that every component in the system worked closely and cooperatively with each other.
MaterialUI
The child component can also get data and function from the parent component using 'props' [2]. Use component concept: Separate components into different folders and files that help developers improve the quality of code structure and file structure, making it easier for them to manage and manipulate each component when they want to make a modification to the component. Uses JSX syntax which makes coding easier - With many supporting library packages - Fast in updating data and re-rendering - Components are reusable.
ForceGraph
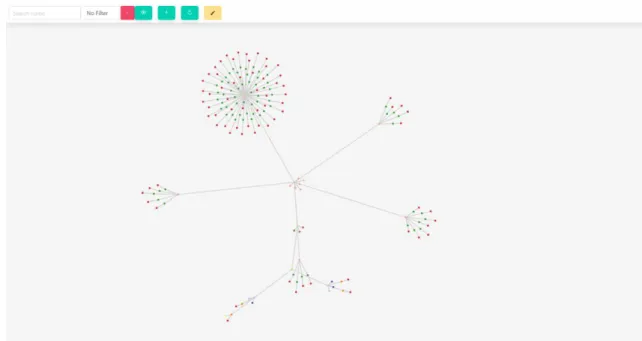
In this project, we use this library to create a web application for data visualization and data manipulation on a user-friendly web platform.
Expressjs
MQTT
After passing all security steps, the MQTT client can listen and send information to the broker. When the broker receives the package, they send this message back to all the customers who subscribe to the topic. There is no acknowledgment with a message QOS 0, but QOS 1 and 2 are acknowledged by the server and will send the message back until the recipient successfully receives the packet [7].
Subscription: MQTT clients can subscribe to multiple MQTT broker topics and receive specific data based on the topic they subscribe to. It allows the system to keep the Node.js application alive forever and automatically reload the application without downtime when the server restarts [8]. In this thesis project, PM2 is used to manage the running process of our API application and MQTT client; both applications are written in Node.js.
One of the key aspects of the MQTT client-broker connection is keep-alive, so it's important to use PM2 to monitor the runtime of this application.
Janusgraph
One of the most important concepts of the graph database is the relationship (or edge or link). Compared to the Graph database, the relational database also stores the relationship between objects, but it is represented as the relationship between two sets of data, while the relationship in the Graph database is created directly between two objects. The relationship can also store property to describe more details in the connection between objects.
Nodes that share the same label can be considered to be at the same level. Edges: There are 3 aspects needed to create an edge the start node, the end node and the relationship label. Object-oriented thinking: each node acts as an object and appears on the same platform as each other.
There is a query model that helps to search for nodes and update the data at the same time [10]. Flexible grouping: It is easy to group objects that have the same common ground: mark or connect to the same node, each small group that has common characteristics then creates a new group.
Node-Red
It differs from a relational database when it is difficult to group data because their properties are listed in different tables [10].
Development tools .1 Git
Visual Studio Code
Postman
3 SYSTEM ARCHITECTURE
- System Model
- MQTT broker and Client
- Front-end
- Hybrid mobile application
- Web application
- Back-end
- Database .1 Requirement
- Schema and data structure
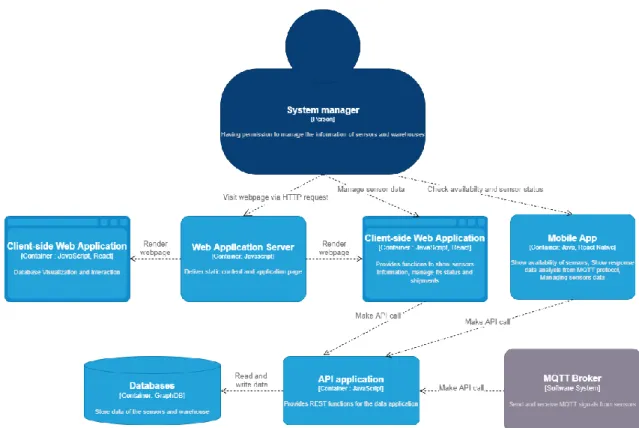
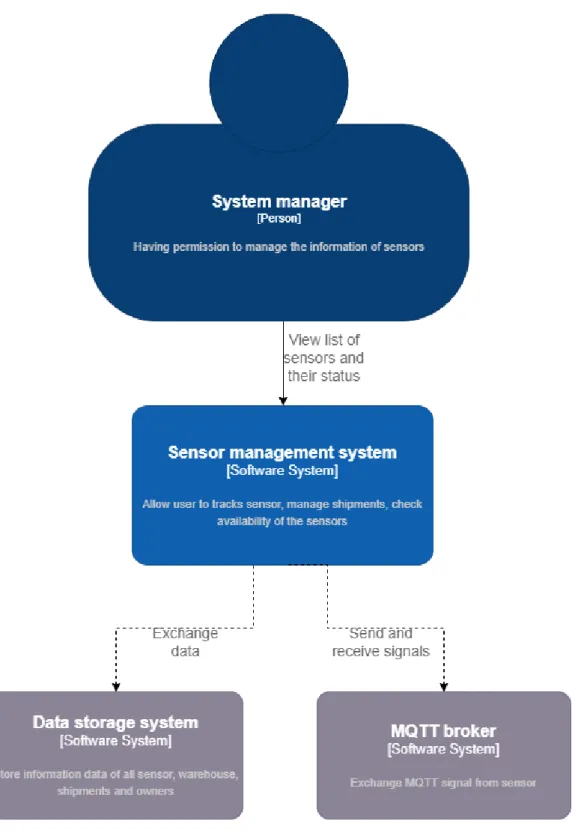
In Figure 3.1, the main user of the system or the system manager was the one who had permission to view and intervene in data processing; this person may be a sensor provider. This activity includes retrieving data from the database, creating the data structure and schema, and modifying the database. In Figure 3.2, the model shows the list of applications in the system and the life cycle of the entire system.
The API, which is connected to the databases, has access to read and modify data in the databases using queries. The client side uses the data received from the API and then displays it to the user. The main purpose of this model is to show all the functional modules needed in the system and the relationship between the components themselves.
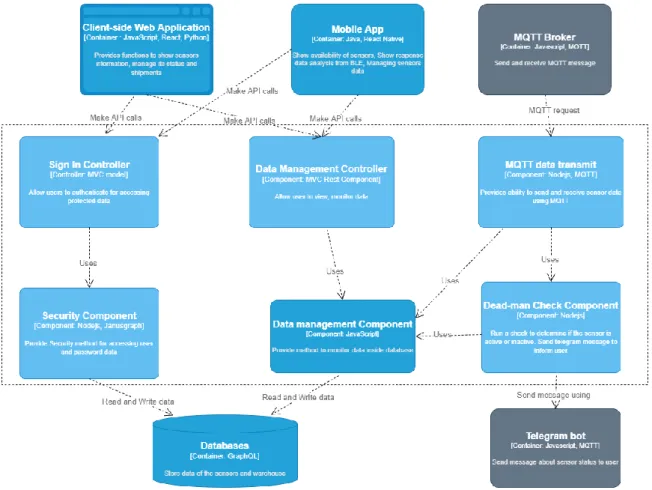
The front-end refers to the software layer that contains all applications and software related to the user interface. For sensor management systems, applications that belong to the front end include web applications and a mobile application. In terms of back-end development, the system uses RESTful API to manage the data flow from the databases to clients.
The system then also uses the API to respond to the client according to the request. The system's architecture includes clients, servers, and resources with requests managed via HTTP. Layered system: The progress involved in retrieving and processing data is invisible to the client [18].
The database used by the system is JanusGraph, a Graph database that stores data from sensors and system users. In the end, the expected output of the API services is a response to the client. The system must store data from a large number of sensors; in the future this number may increase to hundreds of thousands.
Based on the request, the JanusGraph database is applied to the project as a database type for the system. In the system, the system has different modules and one of those modules is sensor management.
4 IMPLEMENTATION
- API Application
- Routing
- Development and Deployment
- Web Application
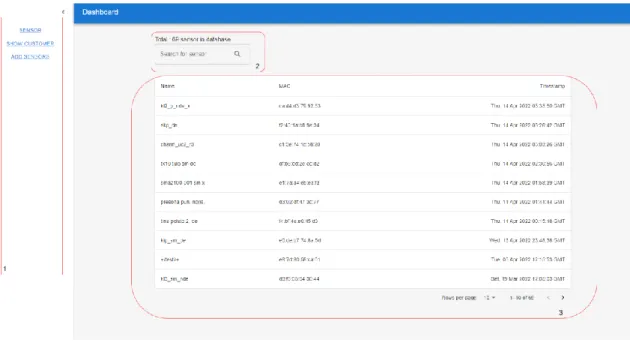
- Database Visualization module
- Sensor Management
- MQTT Client
- Data updating
- Deadman Check
- BLE Advertisement Mobile Application
One API route used in the system is to get node upstream when the API will find all nodes and the relation is a child of the target node. The app sends API requests to the backend server and gets responses with the data from sensors and owners. The purpose of the client is to act as a tool for managing sensor data through MQTT messages.
Most sensors send data through the MQTT protocol, the MQTT client has the mission to receive sensor data through a TCP connection to the MQTT broker and then use its algorithm to make UPDATE or ADD requests to the API . This buffer is created as an output of the message sending function produced by the sensor hardware. Each set of bytes in this buffer represents a measurement value in sensor data. After being parsed, the final result of the message is an object of readable sensor data.
The next step after receiving the analyzed data was to update this sensor data in the database via API. New sensor data is checked using their mac address whether the sensor already exists in the database or not. If the database has already stored the sensor, that sensor's data will be added.
If the first sensor sketch did not exist in the database, the sensor would be added for the first time. To perform this module, we have created an algorithm in which the control time is compared to the last time the sensor sent data. Because the time difference of each sensor is a maximum of 1-day time, every 24 hours the check will be done on the client.
The module then loops through all the sensors comparing the timestamp of each sensor's last update to the control time. On the other hand, other sensors that passed the test had active sensor status. When there is a change in sensor status, the Client will publish a message to the broker with the subject "status".
There are 2 stacks in this application, the first stack screen is scanning BLE sensors and the second one shows the connected sensor details and manipulates the sensor data using BLE services. The application also checks if the found sensors exist in the database, if it is an untracked sensor, the user can manually add the sensor to the database.
5 RESULT
The outcome of the project
The mobile application used BLE ads to scan and read information from sensors, which can broadcast their measurement data via a BLE signal. This technology allows users to read real-time measurement data from nearby sensors and change their internal configuration. In this project, data security features have been applied and developed to identify logins, users and consent.
This security system helps the data to be safely retrieved and updated with the user's permission; each user had his own access to certain data and had to provide an authentication identity for active access. The MQTT clients will automatically detect the change in the status of the sensor and update the status in the database. The warehouse module, which was planned to be implemented to support monitoring sensors, was not developed at the end of the project.
In addition, in the mobile application, the user should be able to connect to the sensor via BLE, but tests showed that it failed to provide this function.
Usability testing
Functional testing
Despite some features that were successfully developed, there are some requirements that this thesis did not meet.
6 CONCLUSION
17] Stardust Group, “Hybrid Apps: an overview of benefits, limitations and consequences for your testing phase”, 11 April 2022.
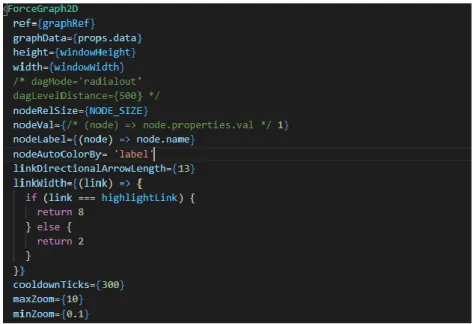
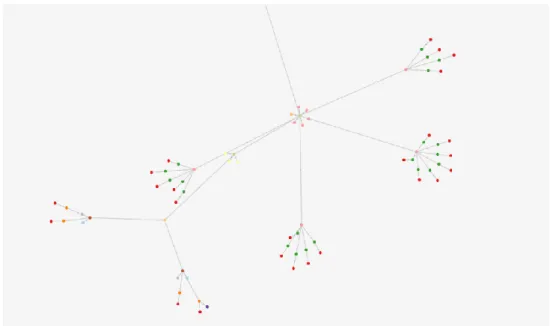
![Figure 2.1 How nodes and links are shown in Forcegraph [5]](https://thumb-eu.123doks.com/thumbv2/9pdfco/1891106.267272/12.892.187.533.413.947/figure-nodes-links-shown-forcegraph.webp)