In addition, the parameters of the fundamental analysis must be set in advance, according to the characteristics of the signal and the required quality of presentation. The role of the work is inspired by alchemy, the science of the transformation of matter: here the matter is any sounds that come from different instruments, and the transformation takes place in the electronic part and in the sound projection.
Sound signals
From the Plancherel identity (see [Gröchenig, 2001b], Theorem 1.1.2), we have that the integral of the spectral energy density over all frequencies gives the total energy of the signal. This representation can be inferred from the STFT of the signal as well as from other representations.
Time-frequency representations and energy densities
The disadvantage of the Wigner distribution is that the time-frequency distribution can reveal components that do not correspond to the analyzed signal, the so-called cross components (see Figure 1.1 for an example). So we have that the information we can get throughφγ(t) is concentrated in the so-called Heisenberg box associated to the atom (see Figure 1.2), that is a rectangle in the time-frequency plane, centered in (τγ, ωγ ), whose time and frequency sides are σt(γ) andσω(γ), respectively.
The spectrogram of a sound
Depending on the desired resolution of the analysis, the ratio between the box sides can be changed. Together with a small A, a measure of the spectral localization provided by the window is given by the amount of energy concentrated in the main lobe.
Adaptive time-frequency representations
20 1. CONTEXT, MOTIVATIONS AND OBJECTIVES OF THE WORK . a complete overview in the discrete case): for the tests in Section 4 we choose a fixed window function that is often used in the applications, the Hanning window with compact support [−12,12],.
Contributions of this work to the state of the art
We implemented a new Matlab code for the entire framework of analysis, automatic adaptation and reconstruction; various FFT-based reconstruction functions that vary with time or time-frequency adaptation are new extensions of existing ones (see [Balazs et al., 2011, Søndergaard et al.,]).
Frame theory in sound analysis and synthesis
- Frame theory: basic definitions and results
- Extensions of stationary Gabor frames
- Gabor Multipliers
- Sound transformation and re-synthesis by means of adaptive representations Having defined adaptive analyses, there are two major problems to solve: the
- Extended weighted frames approach
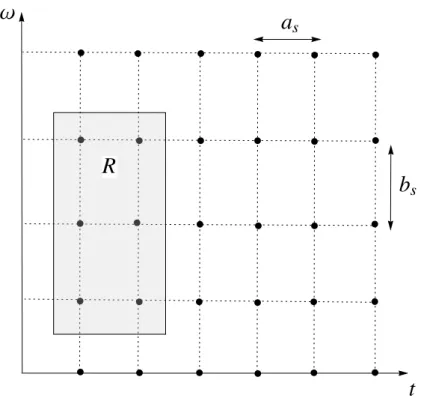
In the following, we use a compact form of the reconstruction formula (2.1.7) to focus on the analysis and synthesis operator. Similarly, the analysis operator C is given by the union of the analysis coefficients obtained with the individual frames G(gs, as, bs).
Ω 1Ω Nyq
Filter bank approach
This part of the work is the result of a collaboration with Ewa Matusiak and Monika Dörfler. Given these estimates, we want to approximate the original signal summing the truncated extensions; therefore, the reconstruction error we obtain is bounded by the sum of the error bounds for the filtered components. Spectral processing techniques often avoid manipulations in the signal domain, favoring modifications of the analysis coefficients, followed by the resynthesis.
Entropy and sparsity measures
Sparse problems and algorithms
The problem of representing f in a dictionary of atoms can be approached by decompositionf, through the usual scalar product hf, fliinH, with all the atoms in the dictionary. A dual approach is to search for a vector of coefficients cso that f can be written as a linear combination of the atoms weighted by the coefficients, . Another strategy is the convex relaxation of the ℓ0 minimization, adopted by algorithms such as LASSO (see [Tibshirani, 1994]), which solves the problem.
Rényi entropies as sparsity measures
The optimal eg choice depends on the signal and the search for analytical solutions would imply restrictions on the signal domain. We give in the following subsection a simple example where this is achievable, but in general we are not interested in analytical solutions to the problem: we rather focus our investigation on the solutions provided by the algorithm we have developed, to verify that the optimal choice determined by the measure gives the desirable resolution in terms of sound processing. Thus, we can improve the selection of the best solution depending on the specific application requirements, keeping the framework unchanged.
Rényi entropy measures of a spectrogram
To formally state this general notion, we consider the following theorem (by Walnut, [Walnut, 1992]), whose proof is based on the properties of the correlation function, defined as . The right-hand side of the inequality above depends only on τ,θ and not explicitly on (t1, ω1) and(t2, ω2), therefore it is sufficient to show that it converges to 0 asτ → 0 and θ →0. For the first term on the right-hand side, this follows from Lebesgue's theorem, for the second it follows from Beppo Levi's theorem [Brezis, 1983, theorems IV.2 and IV.1 respectively].
Biasing spectral coefficients through the α parameter
These vectors are a simplified model of the spectrogram frames whose coefficients correspond to a main peak, Npart partials with amplitude reduced by Rpart, and some noise whose amplitude varies proportionally with the Lparameter, from a negligible level to the same of the partials.
Rényi entropy evaluation of weighted spectrograms
The new idea introduced in [Liuni et al., 2011a] is to use Rényi entropies as sparsity measures for weighted time-frequency distributions: if we consider a weight function 0 ≤ w(k, l) ≤ ∞, we can weight here discrete spectrogram, that obtains a new distribution zk,l∗ =w(k, l)zk,l, which is not necessarily the spectrogram of a signal: nevertheless, by the definition of w(k, l), its entropy can still be evaluated out from ( 3.6.7). This value provides an information about the concentration of the distribution within the time-frequency domain emphasized by the specific weight function: As we show in subsection 5.2, this can be useful for adapting the fitting procedure, mainly for audio analysis purposes. Detection of Spectral Change in Sound Streams Using Rényi EntropiesIn this section, we take advantage of the ability to model spectral measures using means.
Spectral change detection in audio streams by means of Rényi entropies In this section, we exploit the possibility of modeling spectral measures by means
The information measures we consider can be applied to several different signal representations: in [Siegler et al., 1997] the divergence K is used in a GMM framework instead of the spectrogram. By rearrangement we mean a rearrangement of the frame coefficients, thus including the case of equality between frames. If on the other hand the entropy value of the new segment differs greatly from the predicted value, we assume that the new frame is not coherent with the previous one and thus a spectral change is detected.
A sparsity measure based on sinusoidal peaks
Our choice is motivated by the goal of devising a system that can be used in quasi-real time: that is, the computational complexity of the sparsity evaluation must be of the same order as the one of the spectral analysis system. The algorithm in [Röbel et al., 2004] (as well as the others analyzed in [Wells and Murphy, 2010]) is a frame-by-frame system, where the classification is performed on the audio for a single analysis -frame, without the need to acquire subsequent frames; therefore, considering its accuracy and computational complexity, it is a suitable candidate.
Algorithms and tests
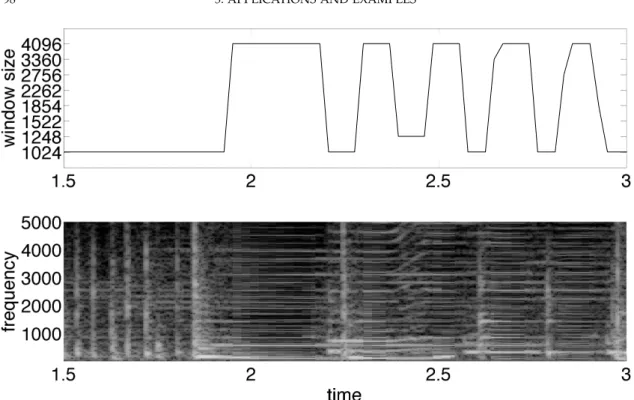
Automatic selection of the window size
We can thus interpret the following measure as the robustness of the solution to noise. Nevertheless, the overall concavity ensures a satisfactory stability of the solution of the problem (4.1.3), in the noise-free case given by the shortest window size. The redundancy of the analyzes considered in the first version of the algorithm, with the same analysis parameters and windows, would be.
Adaptation of the STFT based on sinusoidal modeling
For the experiments we show in the following sections and in the next chapter, this second version of the algorithm is used. We understand |S| = 6 evaluation iterations, fixing the second normalized frequency such that dif < f re(s) in iterations. This would clarify applications where one of the two measures should be preferred, as a criterion for local adaptation of the analysis resolution.
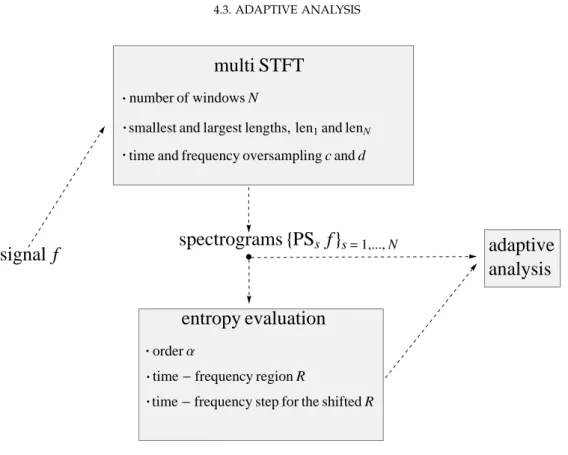
Adaptive analysis
If we associate the analysis coefficients at the points of the grid, we can represent the discrete spectrogram PSsf by means of the grid Λs. The adaptive global analysis is thus obtained as a union of the best local analyzes selected by the algorithm. The entropy evaluation is performed recursively on segments of the signal, taking into account the entire frequency spectrum.
Re-synthesis from adaptive analyses
We see that, as expected, the spectral energy of the signal is included in the overlay of the weighting functions, then the reconstruction error is definitively small compared to that obtained with a simple binary mask. The aim is to show that the reconstruction error obtained by both methods can be reduced by an appropriate choice of the overlap of the two masks according to the spectral energy of the signal. Thus, we see that the error spectral energy with overlapping weights is lower and more uniform.
Applications and examples
- Time adaptation
- Time adaptation with different masks
- Time-frequency adaptation
- Spectral change detection algorithm
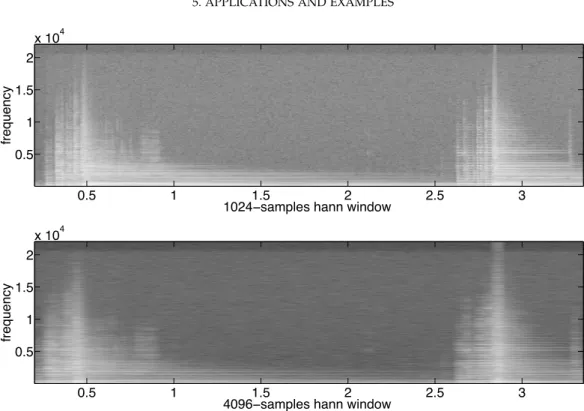
Spectrograms of an audio sample with tabla and sitar (see section 5.2): the two Hanning windows used have lengths of 1024 and 4096 points; in both cases the hop size is a quarter of the window length and the FFT size is twice the window length. The selected mask rises a window selection adapted to the frequency range where the first harmonic of the two instruments is predominant. Spectrogram of the reconstruction error given by the analysis-weight method on an audio sample with tabla and sitar (see section 5.3); the frequency range is limited around the overlap of the weighting masks, from 750Hz to 1.25kHz.
Conclusions and outlooks
Automatic adaptation of the spectrogram
As an alternative to the entropy-based criterion, in section 3.7 we introduce a further benchmark to determine the best local resolution of a spectrogram, based on the classification algorithm in [Röbel et al., 2004]: its features are analyzed using of some tests in section 4.2 showing that this is a valid and interpretable strategy for spectrogram adjustment. Appropriate validation of this method requires a further experimental phase: the efficient communication between the classification algorithm and our adaptive framework will require major implementation changes, thus becoming a task for future research activities in this direction.
Reconstruction from adapted analyses
Spectral change detection
Rényi entropies are defined for probability distributions: instead of applying them to a spectrogram, we can define distributions by an appropriate collection of audio descriptors, better suited to the speech; then the change detection will take place at a descriptor level, and the single coefficients in the distributions will have a more readable relation to the analyzed signal.
Bibliography
Representation of operators in the time-frequency domain and generalized Gabor multipliers.J. 2011). Linear time variant systems and Gabor Riesz bases. Time-frequency puzzle: adaptive and multi-layer Gabor expansions. International Journal for Wavelets and Multiresolution Information Processing, 1(5):1–23. Time-frequency transfer function calculus (symbolic calculus) of linear time-varying systems (linear operators) based on a generalized underdistributed theory. Journal of Mathematical Physics.