Elle prend en compte l'extension de la paroi de la tumeur (stade T), l'existence et le nombre de ganglions lymphatiques envahis (stade N), ainsi que la présence ou l'absence de métastases (stade M) (Figure 1). Plusieurs types de cellules immunitaires ont été détectés au niveau du site tumoral : les cellules du système immunitaire inné (comme les cellules dendritiques [17] ) et du système immunitaire adaptatif (comme les T helper 1 ou Th1 [18] [19] ). Les cellules NK (natural killer), les macrophages, les lymphocytes T γδ ou NKT (natural killer T) peuvent être recrutés directement au site tumoral.
FIGURE 5 – Les mécanismes d'échappement de la tumeur au système immunitaire. Mécanismes d’évasion des tumeurs du système immunitaire. Il a également été suggéré que les cellules cancéreuses antigéniques seraient enfouies au cœur de la tumeur solide. D’un autre côté, le stroma tumoral pourrait empêcher la libération efficace des antigènes tumoraux [64].
La tumeur peut mettre en place des mécanismes qui empêchent le déclenchement de la réponse immunitaire. Le rôle du système immunitaire dans le contrôle de la progression tumorale a été établi dans des modèles murins. Nous avions précédemment démontré l’importance de la réponse immunitaire et notamment une forte densité de lymphocytes T (CD3+) et T mémoire (CD45RO+) (article 1 [140]).

Biomolecular network reconstruction identifies T cell homing factors associated with survival in colorectal cancer
ACCEPTED MANUSCRIPT
The natural evolution of a cancer also involves antagonistic interactions of the tumor with the defense mechanisms of the host 6, 7. Furthermore, the presence of a specific intratumoral TCR repertoire has been correlated with the survival of the patient. In summary, these data showed that the phenotypes of the intratumoral immune cells are strongly associated with specific chemokines and adhesion molecules, indicating a high degree of functional coordination.
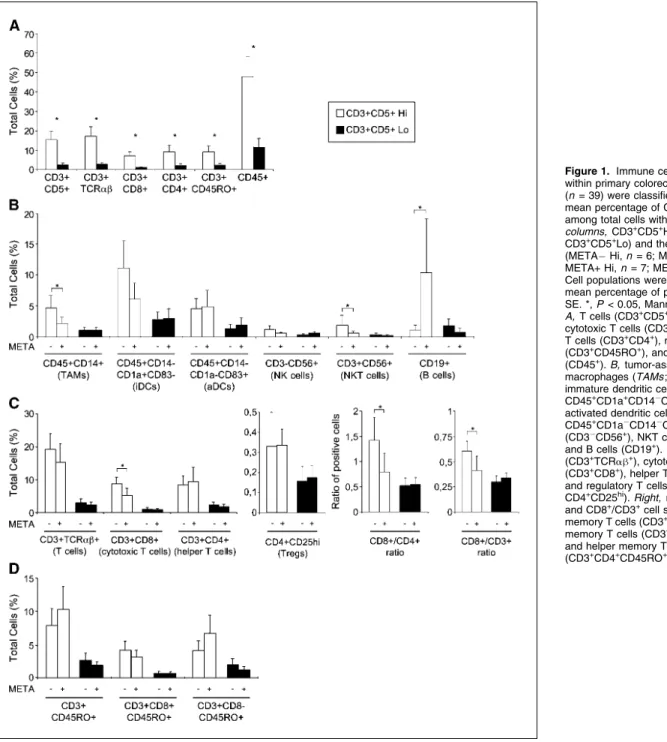
The results firstly showed that all Vβ and most CDR3 lengths are present within the tumor of the patients (Figure 4, A and C). We applied such an integrated approach and performed global analyzes of the phenomenon (large-scale flow cytometry experiments), transcriptome, tissue microarrays of specific tumor regions and T-cell repertoire analysis, in the tumor microenvironment of patients with colorectal cancer. Third, the presence of a specific intratumoral TCR repertoire correlated with patient survival.
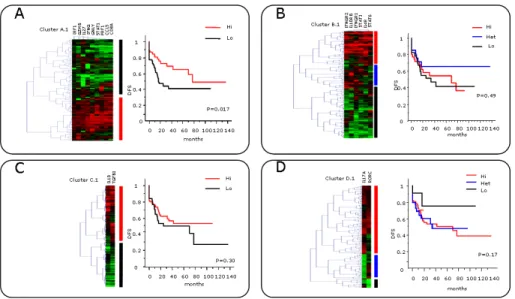
The node sizes of the network were based on the hazard ratio for DFS (Supplementary Table 1). The edge weights of the network were based on the integrated score of the pairwise uncentered Pearson correlation value between the 47 RT-PCR genes and the combined edge scores for all genes predicted in silico provided by STRING (see Supplementary Methods for details). Gene expression levels of 108 colorectal tumors (cohort 1) were analyzed by real-time quantitative PCR. A) Kaplan-Meier curves for the duration of DFS, according to the expression of the predicted genes (CX3CL1, CXCL9, CXCL10, CCL2, CCL5, CCL11 and MADCAM1) were performed.
T cell repertoire analyzes were performed on tumors from 10 randomly selected colorectal cancer patients (A to J) using the quantitative expression of the 26 TCR Vβ chain families. These quantitative data were represented by the height of the peak in the TcLandscapes (panels A, C) and on the histograms (panels B, D). The CDR3 lengths of the TCRs were shown in the histograms (panels A, B). C, D) Kaplan-Meier curves illustrate overall survival of patients according to specific TCR expression at the median of the data set.
The integrity and quantity of the RNA were evaluated on a bioanalyzer-2100 (Agilent Technologies, Palo Alto, CA). The data were expressed as the ratio Vβ/HPRT and their quantities were represented by the height of the peak in the TcLandscapes and on the histograms. The network node sizes are based on the Hazard Ratio for DFS determined using the median cut-off approach (Table S1).
The network edge weights are based on the integrated score of the pairwise uncentered Pearson correlation value between the 49 RT-PCR genes and the combined edge scores for all genes provided by STRING.

Abstract
Introduction
Results
The frequency of patients "Hi" (or "Lo") was calculated in each of these 6 groups. In the early stages, the frequency of patients "Hi" was higher than in the late stages (fig. 5B). In a given T stage, the frequency of patients "Hi" was higher in groups of patients with relapse than without relapse.
In the group Th1 cytotoxic hi, patients with low expression of Th17 cluster genes had a better survival than patients with high expression level of Th17 cluster genes. Likewise in the group Th1 cytotoxic lo, patients with low expression of Th17 cluster genes had a better survival than patients with high expression level of Th17 cluster genes. Patients (n=126) were classified according to the T-stage (A). B) frequency of patients with high (black columns) and low (white columns) expression of IL17A classified by T stage and relapse.
High densities in the two CD8 regions were represented in histograms 1–3, heterogeneous densities in histograms 4–6, and low densities in histograms 7–9. High densities in the two regions of IL17 were represented in histograms 1,4,7, heterogeneous densities in histograms 2,5,8 and low densities in histograms 3,6,9. Patients with low IL17 density in both tumor regions had better disease-free survival than patients with high IL17 density (fig. 8B).
In contrast, 50% of patients in the HiHi group had tumor recurrence at one year. On the contrary, patients with high density of CD8, T-Bet or FOXP3 had a better disease-free survival than patients with low density (Fig. The combination of the CD8 and IL17 markers defined groups of patients with very different outcome.
It is striking that in the group of patients with heterogeneous density of CD8, patients with low density of IL17 had a better disease-free survival while patients with high density of IL17 had a poor prognosis (fig. There was no relapse in the group of patients with low density of IL17 cells while 80% of patients in the high density group relapse.
Discussion
Conclusion
Bibliography
Supplemental figure
Les données ont été obtenues pour 464 patients au centre de la tumeur et pour 471 patients au front de progression. Le groupe de patients fortement infiltrés au centre de la tumeur et peu infiltrés dans le front de progression (Hi Lo, courbe bleue) présente une courbe de survie intermédiaire. FIGURE 14 – Représentation graphique de la densité de cellules CD3+ et FoxP3+ dans chaque région de la tumeur.
Les cellules FoxP3+ font partie d’un groupe qui comprend des lymphocytes T au centre de la tumeur. Les patients présentant un ratio élevé dans les deux régions de la tumeur ont une meilleure survie sans récidive que les patients présentant un faible ratio dans les deux régions. Les patients présentant un rapport discordant entre les deux régions tumorales ont une survie sans récidive intermédiaire.
Ces groupes s'appliquent au milieu et à l'avant de la progression tumorale. FIGURE24 – Extrait de la matrice de corrélation entre microARN et données des cellules immunitaires innées. Les parties A, B et C proviennent de la matrice de corrélation entre les microARN et les cellules immunitaires innées.
Ces patients ont de faibles densités de lymphocytes T et aucune coordination de la réponse immunitaire. Patients présentant une densité élevée de cellules CD8+ (marqueur Th1) dans les deux zones de la tumeur, quelle que soit la densité de cellules IL17+. marqueur Th17) ne s’est pas reproduit. En revanche, les patients présentant une faible densité de cellules CD8+ dans les deux zones tumorales ont un mauvais pronostic.
Les patients présentant une densité inégale dans les deux zones de la tumeur (hétérogènes) peuvent être séparés en utilisant la densité des cellules IL17+. Cependant, l'étude de la densité cellulaire FoxP3+ in situ révèle une association avec un bon pronostic des patients (données non publiées). De plus, cet effet sur le pronostic des patients ne reflète pas une augmentation parallèle de la densité des cellules FoxP3+ et des lymphocytes T CD3+.
Aucun microARN prédictif de survie n'a été décrit dans les cellules immunitaires de notre cohorte.
ClueGO: a Cytoscape plug-in to decipher functionally grouped gene ontology and pathway annotation networks
ClueGO provides the ability to calculate enrichment/depletion tests for terms and groups as left-sided (Enrichment), right-sided (Depletion), or two-sided (Enrichment/Depletion) tests based on the hypergeometric distribution. The relationship between the selected terms is defined based on their shared genes in a similar way as described by (Huanget al., 2007). Based on this matrix, a term-term similarity matrix is calculated using probability-corrected kappa statistics to determine the association strength between the terms.
Finally, the created network represents the terms as nodes connected to each other based on a predefined kappa score level. The kappa score level threshold can initially be adjusted on a positive scale from 0 to 1 to restrict network connectivity in a customized manner. The functional groups are created by iteratively merging initially defined groups based on the predefined kappa score threshold.
Functional groups, represented by their most important (leading) term, are visualized in the network, which allows insight into their mutual relationships. As an alternative to clustering kappa scores, a GO hierarchy using parent-child relationships can be used to create functional groups. When comparing two gene clusters, another original feature of ClueGO allows you to switch the visualization of groups in the network to the distribution of clusters by expression.
ClueGO is an easy-to-use Cytoscape plugin to analyze the interrelationships of terms and functional groups in biological networks. Our tool is easily extendable to new organisms and identification types, as well as new annotation sources that can be included in a transparent, plug-in-like manner. GO::TermFinder: Open source software to access gene ontology information and find significantly enriched gene ontology terms related to a list of genes. Bioinformatics.
GOlorize: a Cytoscape plugin for network visualization with Gene Ontology-based layout and coloring. Bioinformatics. The protein information and property explorer: an easy-to-use, rich client web application for the management and functional analysis of proteomic data. Bioinformatics.