HAL Id: hal-00598995
https://hal.archives-ouvertes.fr/hal-00598995
Submitted on 8 Jun 2011
HAL is a multi-disciplinary open access archive for the deposit and dissemination of sci- entific research documents, whether they are pub- lished or not. The documents may come from teaching and research institutions in France or abroad, or from public or private research centers.
L’archive ouverte pluridisciplinaire HAL, est destinée au dépôt et à la diffusion de documents scientifiques de niveau recherche, publiés ou non, émanant des établissements d’enseignement et de recherche français ou étrangers, des laboratoires publics ou privés.
Modular approach for modeling a multi-energy district boiler
Julien Eynard, Stéphane Grieu, Monique Polit
To cite this version:
Julien Eynard, Stéphane Grieu, Monique Polit. Modular approach for modeling a multi- energy district boiler. Applied Mathematical Modelling, Elsevier, 2011, 35 (8), pp.3926-3957.
�10.1016/j.apm.2011.02.006�. �hal-00598995�
Modular approach for modelling a multi-energy district boiler
Julien Eynard, Stéphane Grieu1 and Monique Polit
ELIAUS laboratory, University of Perpignan Via Domitia, 52 Avenue Paul Alduy, 66860, Perpignan, France; {julien.eynard; grieu; polit}@univ-perp.fr
Abstract: the present paper deals with the modelling of a district boiler (city of La Rochelle, west coast of France), as part of the OptiEnR research project. This "multi- energy" boiler supplies domestic hot water and heats residential and public buildings, usingmainlywoodandsometimesfuelorgasifnecessary.TheOptiEnR research project focuses on optimizing the performance of the boiler. Its main objective is tominimizethe useoffossilenergy,stockingrenewableenergyduringlow-demand periods and using it when peak-demand is high. Becauseofboth the complexity of the plantasawholeand thestrong interactions between the sub-systems (the wood boiler, the gas-fuel oil boiler, thebreakingpressurebottle,thecogenerationplant, the hot water distribution network), a modular approach has been proposed. According to what information is available, a combination of white, grey and black boxes (Hammerstein-Wiener models) has been used to carry out the modelling process. To answer for thelackofinformation,additional parameterswere proposed and identified. The model has been first used in simulation during heating periods, with the aim of optimizing both the parameters of the boilers control systems and the use of wood, gas and fuel oil. Next, it will be used, when adding to the plant a thermal storage unit and implementing a Model Predictive Controller, to improve its functioning, especially reducing the coverage rate of the fossil energy boiler.
Keywords:multi-energydistrictboiler;hotwaterdistributionnetwork;modelling process;
Hammerstein-Wiener model; identification; simulation; white, grey and black boxes.
Nomenclature
Sampling time (s)
Time index (-)
Wood boiler engaging (-)
Gas-fuel oil boiler engaging (-)
Daily consumption of wood (kg)
Cumulative consumption of wood (kg)
Real-time consumption of gas (m3)
Daily consumption of gas (m3)
Cumulative consumption of gas (m3)
Real-time consumption of fuel oil (l)
Daily consumption of fuel oil (l)
Cumulative consumption of fuel oil (l)
Number of tappet strokes per five minutes (wood boiler) (-)
Outdoor temperature (°C)
Distribution network set-point temperature (°C)
Wood boiler set-point temperature (°C)
Gas-fuel oil boiler set-point temperature (°C)
Cascade set-point temperature (°C)
Temperature of the water entering the wood boiler (°C)
Temperature of the water leaving the wood boiler (°C)
Flow of the water passing through the wood boiler (m3/h)
Temperature of the water entering the gas-fuel oil boiler (°C)
Temperature of the water leaving the gas-fuel oil boiler (°C)
Smokes temperature (gas-fuel oil boiler) (°C)
Flow of the water passing through the gas-fuel oil boiler (m3/h)
Temperature of the water entering the collecting hydraulic circuit (°C)
Temperature of the water leaving the collecting hydraulic circuit (°C)
Flow of the water passing through the collecting hydraulic circuit (m3/h)
District boiler ambient temperature (°C)
Temperature of the water entering the cogeneration plant (°C)
Temperature of the water leaving the cogeneration plant (°C)
Flow of the water warmed up by the cogeneration plant (m3/h)
1Corresponding author. Tel.: +33 468662202; fax: +33 468662287.
Power provided by the cogeneration plant (W)
Energy provided by the cogeneration plant (Wh)
Temperature of the water entering the distribution network (°C)
Temperature of the water leaving the distribution network (°C)
Flow of the water entering the distribution network (m3/h)
Temperature of the water entering the breaking pressure bottle (°C)
Temperature of the water leaving the breaking pressure bottle (°C)
Flow of the water leaving the breaking pressure bottle (m3/h)
Water differential pressure (distribution network) (bar)
Water differential pressure set-point (distribution network) (bar)
Horizontal flow inside the breaking pressure bottle (m3/h)
Vertical flow inside the breaking pressure bottle (updraft flow) (m3/h)
Vertical flow inside the breaking pressure bottle (downdraft flow) (m3/h)
Opening percentage of the valve of the distribution network feed pump (%)
Thermal power consumed by the distribution network (W)
Production flow (m3/h)
Production power (W)
Production energy (Wh)
Temperature of the water passing through the internal circuit of the cogeneration plant, before being cooled down by the “cogeneration/network” exchanger (°C)
Temperature of the water passing through the internal circuit of the cogeneration plant, after being cooled down by the “cogeneration/network” exchanger (°C)
Opening percentage of the valve of the fan-heater unit (%)
Fan-heater power dissipation (W)
Temperature of the water cooled down by the pressure regulator (°C)
Temperature of the water warmed up by the “engine/cogeneration” exchanger (°C)
1. Introduction
Managing energy demand, promoting renewable energy and finding ways to save energy are worldwide concerns as well as innovative solutions to fight the global energy crisis (mainly caused by both the rarefaction of fossil fuels and an excessive energy consumption: many experts believe thatby2015thesupplyofoilandnaturalgaswillbeunabletokeepupwithdemand[1]).Renewable energy is one of the ways to limit both GreenHouse Gases (GHG) emissions and the impact of climatechangeonenvironmentandhealth.ThatiswhytheEuropeanCouncil’sambitiousobjectives of saving 20% of the energy consumption compared to projections for 2020, of reducing of at least 20% the GHG emissions compared to the 1990 level and, finally, of raising the share of renewable energy sources in its final energy consumption from around 8.5% in 2005 to 20% in 2020 then to 50% in 2040 plays a central role in the EU energy policy [2].
Figure 1. The OptiEnR project. In red, the district boiler model presented in the paper.
AspartoftheOptiEnRresearchproject, the present paper, the second of a series of three [3]
dealing with the optimization of the performance of a district boiler,focusesonits analysis and modelling. The just-mentioned projectbegan in late 2008 and finished in late 2010. It involves researchers from the ELIAUS laboratory of the University of Perpignan Via Domitia (south of France) and engineers from two French companies, Cofely GDF-SUEZ [4] and Weiss France [5].
Cofely GDF-SUEZ is currently the leading European brand for environmental and energy efficiency services while Weiss France designs, manufactures and installs automatic boiler rooms
for all types of wood, biomass, wastes and fluids. The district boiler will be described later inthe present paper(section 2)and issituated atLa Rochelle (westcoast of France). It is managed by CofelyGDF-SUEZ,suppliesdomestichotwaterandheatsresidential andpublicbuildings,using mainlywoodandsometimesfuelorgasifnecessary.TheOptiEnRprojectfocusesonimprovingthe performance of the plant (first optimizing the parameters of the boilers control systems), using a model-based predictive controller to manage a to-be-implemented thermal storage unit (while adding new pumps). Its mainobjectiveistominimizetheuseoffossilenergy,stockingrenewable energyduringlow-demand periods and using it when peak-demand is high. The project consists of the following successive tasks (Figure 1): the first task is to forecast outdoor temperature and thermal powerconsumption(ofthehotwaterdistributionnetwork) [3];thesecondtaskfocuses on modelingthedistrictboiler;thethirdtaskdeals with studying the feasibility of adding to the plant athermalstorageunit and finding the most adequate storage material; the fourth task is to model the thermal storage while thefifthtaskfocuseson optimizing the boiler functioning using both a Model Predictive Controller (MPC)[6-7] andthe forecastedparameters (first task).The present paper deals with the second task, the next paper of the series dealing with the tasks 3 to 5.
Taking a look at the state of the art about the modelling of district boilers, one can highlight some interesting works. First, Curti et al. proposed in 2000 [8] an "environomic" approach for modelling and optimizing a district heating network based on both centralized and decentralized heat pumps, cogeneration and/or gas furnace. Because adapting the delivery temperature to the most exigent users is detrimental to the overall system performance, the authors proposed to centralize its management. Its environmental characteristics are introduced into the proposed model through pollution damage cost terms and a new form of pollution penalty functions, which adapt to the system's changing emissions and to local and global pollutant conditions. Although a centralized management can be effective, such an orientation is questionable in case of multi- component systems or when the behaviour of some components and/or the internal organisation of the plant (and, as a consequence, the way these elements impact each other) is not easy to understand. Next, Dias et al. [9] modelled a wood boiler via a detailed energy and exergy analysis.
Inefficiencies in a process are well pinpointed when carrying out this kind of study because an exergy analysis allows quantifying the types, causes, and locations of losses. Such an approach can be considered to model all the type of gas and wood boilers, used to produce hot water.
However, it can be hard to conduct in case of very complex systems (such as multi-energy systems dealing with several energy resources) or when information is (partially) missing or corrupted.
Although exergy analysis is a very efficient tool for process optimization and understanding, performing such an analysis at the district boiler of La Rochelle was not possible. Gonzalez- Bustamante et al. [10] proposed a method to model the transients in a natural gas line which supplies a boiler at a stream-electric power plant. The proposed solution permits to both carrying out a dynamic analysis of the boiler and designing regulation and control tools at a reasonable cost for industrial projects. However and because of its specificity, this method can be hardly applied to others boilers. Niu et al. [11], Prasad [12] and Mahlia et al. [13] works focused on modelling boilers used to produce electricity. Niu et al. [11] highlighted that industrial boilers will behave differently due to manufacturing or assembly tolerance. In addition, the performance of a boiler will vary at different times of its service life. That why their paper deals with both the modelling and the simulation of a boiler unit to highlight such an issue. In the boiler model, heat transfer in the combustion chamber is simulated by the zone method while heat transfer in the primary and the secondary superheaters, in the reheater and in the economizer is simulated by lump parameter analysis. The main feature of the method used is that the respective models of the major components have been coupled sequentially according to the boiler configuration. Thus, the authors assume that the method they proposed may be applied to different boiler systems with different configurations. However, one can highlight that a thorough understanding of the various phenomena involved is absolutely necessary. Finally, the uncertainly factors, such as, for examples, water tube depositsorcomponentsdeterioration,areconsideredby modification factors which are determined fromon-linemeasurements.Prasad’s paper [12] deals with the theoretical performance of a biomass-fuelled boiler/steam power cogeneration system. He based the system performance on the known and assumed properties of the biomass fuel (its size, elemental composition or moisture content), on energy content of the combustible constituents (fuel) and on load profiles. As a consequence, this approach can be hard to implement if the just-mentioned properties are not well defined or when they vary in time. Mahlia et al. [13] developed a state- space dynamic model for a palm wastes boiler. The unique feature of the boiler is that it uses
wastesintheformoffiberandshellfromthepalmoilprocessingasitsfuels.Specificcharacteristics of oil palm waste boilers are non-uniform fuel feed, compositions, sizes and moisture content of the fuel. The boiler unit has been divided into several sub-systems. The linearized model consisted of ten first-order simultaneous equations. All of these works [8-13] are reallyinteresting butdonotmatchwiththeconstraints imposed by the multi-energy district boiler of La Rochelle (where information is partially missing), its proper characteristics (for example, the cogeneration plant produces electricity and warms a part of the cold water coming back from the distribution network) and the goal set by Cofely GDF-SUEZ. Of course, efficiently modelling a boiler requires expert knowledge about physical parameters. When information is partially missing, one can use alternative and well-known methods, such as bond graphs, fuzzy logic, artificial neural networks or genetic algorithms. Bouamama et al. [14] used bond graphs to model a steam generator installation consisting of various complex industrial components, such as a boiler or a condenser.
As shown by the authors in their paper, bond graph modelling is a suitable tool to represent the model structures of such processes along with their control system instrumentation. A structural analysisofthemodelallowedtheauthorstodeterminethefaultsignatures.Hardwareredundancies in the sensor placement have also been highlighted. Finally, a supervision platform including reconfiguration strategies has been proposed. However, and because bond graphs are designed around the conservation principles of physics, they are only suitable for the description of physical systems. Chemistry is a border-line case. For the present study, the complexity of the district boiler of La Rochelle makes hard to use this tool. Lu et al. [15] developed a nonlinear power plant (a 200 MW oil-fired drum-type boiler-turbine-generator unit) model, taking into account physical principles and using artificial neural networks. Practical aspects of neural network modelling were investigated to ensure sufficient perturbations covering proper dynamic and load conditions. The simulation results showed that the accuracy of artificial neural network models depends greatly on the training data and is satisfactory within normal operating scope.
Artificial neural networks were also used by Romeo and Gareta [16] for monitoring a biomass boiler. The authors highlight that biomass combustion produces fouling in boiler heat transfer equipment causing a reduction of steam output and boiler efficiency. That is why artificial neural networks were used to predict a set of operational variables and the fouling state of the boiler.
However, more research is required for minimize the fouling effect once it has been detected. As one knows, multilayer feedforward neural networks are a class of universal and parsimonious approximators. Such networks can be used to model and/or control complex and nonlinear systems.However,theirgeneralizationcapabilityisstronglyrelatedtotherelevanceofthetraining examples used. That is why, due to the limited quantity of historical data available at the district boiler of La Rochelle, such an approach has not been considered. Finally, Ghaffari et al. [17]
presented a soft computing approach for modelling electrical power generating plants with the aim of characterizing the essential dynamic behaviour of the plant sub-systems. The proposed approach consisted of fuzzy logic, artificial neural networks and genetic algorithms. The data measured from a complete set of field experiments is the basis for training the models, including theextractionoflinguisticrulesandmembershipfunctionsaswellasadjustingtheotherparameters of the fuzzy model. The genetic algorithm has been used to optimize the training procedures.
According to all the just-mentioned considerations and because of both the complexity of the district boiler of La Rochelle as a whole and the strong interactions between the sub-systems (the wood boiler, the gas-fuel oil boiler, the breaking pressure bottle, the cogeneration plant…), a modular approach has been proposed for modelling the plant. According to what information is available (provided by measurement campaigns or taking into consideration expert knowledge about the sub-systems functioning and the boilers control systems), a combination ofwhite,grey and blackboxes has been used. With white boxes, which are used when one can easily describe the interactions between physical parameters, experimental data are only used to validate the developed models. Both grey boxes [18] (in this case one needs to find appropriate model inputs and outputs, thanks to some physical considerations and/or analyzing the process dynamic properties; experimental data allow, first, optimizing both the model topology and parameters [19-20] and, secondly, validating this model)andblackboxes(withthiskindofmodels,nophysical considerations are taken into account; a standard topology is used and, as when using grey boxes, one needs to find appropriate model inputsandoutputsand to optimize, thanks to experimental data,themodelparameters)[18]areusedincaseof missing information aboutphysicalbehaviour.
Letusnotethatinsomecases,additionalparameterswereproposedand identified to answer for the lack of information. The developed model has been first used in simulation during heating
periods, withtheaimofoptimizingboththe parameters of the boilers control systems and the use of wood, gas and fuel. As previously mentioned, the modelwillbeused,whenaddingtotheplanta thermalstorageunitandimplementingapredictiveoptimalcontroller,tooptimizeitsfunctioning, especially reducing the coverage rate of the fossil energy boiler.
2. The district boiler of La Rochelle
The district boiler of La Rochelle, whose synopsis is shown in Figure 2, is composed of a breaking pressure bottle, a cogeneration plant and two thermal boilers. The first one, a large 4.5 MWwoodboiler,usesrenewableenergy (it is fed with woodchip). The second one, a 7 MW gas-fuel oil boiler, uses fossil energy. Both boilers have smokes and air-to-water heat exchangers. They supply hot water to the collecting hydraulic circuit according to a temperature set-point which is defined from outdoor temperature. During the cold season (from October to May), the wood boiler is continuously running while its heating power is adapted to the demand. The gas-fuel oil boiler functions during very cold periods only, when the wood boiler fails to respond to the demand. The primaryhydrauliccircuit(3000m3),or"distributionnetwork",supplieshotwatertoheatresidential and public buildings (for example schools), for a total of 2700 accommodations. Domestic hot water is also produced, for a total of 3500 accommodations. The cogeneration plant, connected to the "return" part of the primary hydraulic circuit, produces electricity using gas and warms up the cold water before it goes back to the collecting hydraulic circuit. The breaking pressure bottle pulls apart the two hydraulic circuits, because of the difference between their respective flows.
Figure 2. Synopsis of the district boiler of La Rochelle. In black, the main components of the plant and in red, blueandgreen,the modifications proposed to improve its performance.
The coverage rates of the three heat generators are 50% (wood boiler), 15 to 20% (gas-fuel oil boiler) and 30 to 35% (cogeneration plant), respectively. To minimize the gas-fuel oil boiler coverage rate, we proposed to add a thermal storage unit to the plant (Figure 2) with the aim of stocking hot water when the demand is low and using it when the demandcan’t be met by the wood boiler. This is a classical solution to optimize the functioning of boilers used to heat buildings [21-23]. Thus, the gas-fuel oil boiler will be only used when both the hot water demand is very high and the thermal storage unit is empty. The flow of the water passing through this unit ( ) will be adjusted thanks to the control of the thermal storage feed pump ( ). With the aim of optimizing the use of this thermal storage unit and reducing thefossilboilercoveragerate, a model predictive controller will define over the next 4 hours and 30 minutes the optimal sequence of and the wood boiler set-point temperature ( ), taking into consideration some parameters measured at the district boiler as well as both the forecasted outdoor temperature ( ) and thermal power consumption (of the distribution network) ( ). The wood boiler ( ) and gas-fuel oil boiler ( ) feed pumps are controlled using a standard on/off controller. is the distribution network feed pump (Figure 2).
3. Experimental data
For most of the experimental parameters used to model the multi-energy district boiler of La Rochelle, isequalto300seconds(5minutes).Forsomeparametersmeasuredevery15 minutes or every hour only, data were interpolated (i.e. upsampled) to be in agreement with the just mentioned sampling time. Measurement campaigns were carried out during the winter period of 2009, from early January to late March. During this period, the district boiler behaviour is fully representative of a typical behaviour for such a plant.
4. Modelling of the district boiler 4.1. Proposed approach
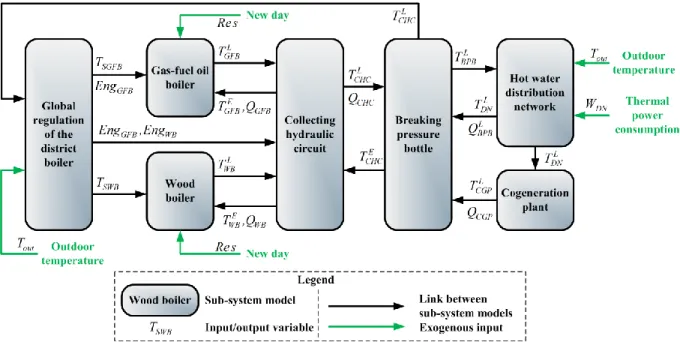
As previously mentioned, because of both the complexity of the district boiler of La Rochelle as a whole and the strong interactions between sub-systems, a modular approach is proposed for modelling the plant. First, a data processing phase allowed eliminating abnormal (acquired) data and upsampling data with a too-high sampling rate. Let us also note that some relevant but not- measured parameters have been estimated thanks to appropriate information. Next, for each parameter to be modelled, both the model topology (a differential, algebraic or logical equation) and the model inputs are defined. An iterative process of optimisation has been performed to identify the coefficients of themodels. We used the trust-region reflective Newton method for nonlinear least-squares to solvetheminimizationproblem[24-26]. Analysingtheresults allows validatingthechosentopologies (ifa result isnot satisfactory, oneneeds to think about another model topology and to find the right equation coefficients again). With the boiler parameters correctly described, using optimized differential, algebraicoflogicalequations,sub-models (about sub-systems such as the wood boiler, the gas-fuel oil boiler, the breaking pressure bottle, the cogeneration plant…), which inputs are only exogenous ones, are defined. A second iterative processof optimisation is carried out to adjust the sub-models coefficients. Finally, when the sub- modelsaccuracyisasgoodaspossible,thesemodelsarecombinedtoobtainthedistrictboilermodel.
Figure 3. Modular approach for modelling the district boiler of La Rochelle.
Figure3 depicts the way the district boiler of La Rochelle is modelled, via a modular approach based on interconnected sub-models. Only twoexogenousmodelinputsareconsidered:theoutdoor temperature and the thermalpowerconsumption of the distribution network. These inputs are forecasted over the next 4h30, as requested by the boiler operators and taking into consideration the main objective of the OptiEnR project. The forecasting methodology deals with the concept of time series and uses a wavelet-based multi-resolution analysis and Artificial Neural Networks (ANN) [3, 27-29]. Substituting the prediction task of an original time series of high variability by
the prediction, using ANN, of its wavelet coefficients on different levels of lower variability (according to different frequency domains) was the mainideawhen developing this methodology.
Then, the reconstruction of the target sequences was performed by simply summing up these coefficients. With simulations, one can understand the way the outdoor temperature and the thermal power consumption of the distribution network impact on the district boiler behaviour.
4.2. Global regulation of the district boiler
Thedistribution network ( ), the wood boiler( ) and the gas-fuel oilboiler ( )set- pointtemperatures, the cascade set-point temperature ( ) aswellas the way the two boilers are engaged or stopped ( and ) are specified according to both the outdoor temperature ( )andthetemperatureofthewaterleavingthecollectinghydrauliccircuit( ) (section 4.5.3).
The network set-point temperature is the temperature we want for the water in the primary hydraulic circuit.
Figure 4. Global regulation of the district boiler (in brackets, the model equations).
4.2.1. Distribution network set-point temperature
The distribution network set-point temperature is calculated using a piecewise affine linear function of outdoor temperature.Thisfunctioniscomposedoffourlinearpieces, defined according tothefollowingcoordinates ,whichrespective parameters need to be identified. As a result, one can model the way the network set-point temperature is evolving, using conditional (algebraic) equations (1). , and are defined by equations (2) and (3), respectively:
Onecanreformulatethejust-mentionedequationsystem (1)(both and remain unchanged) using logical (algebraic) equations, and , in the following way (4):
(1)
(4) (2) (3)
4.2.2. Wood boiler set-point temperature
The wood boiler set-point temperature is the temperature we want for the water leaving this boiler. As for the network set-point temperature, it is calculated using a piecewise affine linear function of outdoor temperature. Again, the function coefficients need tobe identified. As a result, onecanmodelthewaythewoodboilerset-pointtemperatureisevolving,using the following logical (algebraic) equations (5), and :
and
Let us remember that we describe the way the wood boiler functions thanks to . This is a binary variable. We suppose the wood boiler to be continuously functioning. It stops only in case of failure but we do not consider such an event ( ). As a consequence, .
4.2.3. Gas-fuel oil boiler engaging
The working of the gas-fuel oil boiler is relatively complex. First, this boiler only works when outdoor temperature is below 0°C. If so, shutdown and restart sequences depend on the difference between and . If this difference is greater than 3°C ( ), with , during a continuousand minimal period oftime( ) of 10 min, the gas-fuel oil boiler starts working. It works until 1°C ( ), with . Let us note that theboiler can only stop working ifit was in service during thelast 2 hours and 10 minutes ( ). These values were provided by Cofely GDF-SUEZ. The way the gas-fuel oil boiler functions is described by the following equation system (6), with , , and reporting if outdoor temperature is below 0°C, if just before the gas-fuel oil boiler stops, the outdoor temperature was higher than 0°C, if isgreaterthan3°C and if, due to outdoor temperature, the gas-fuel oil boiler has to stop working, respectively. seconds and min are the engagingandstopping delays. is the time index while is the sampling time:
Letusnote,first,that willbeusedtocorrectlyformulatethegas-fuel oil boiler set-point temperature (section 4.2.4) and, secondly, that and were optimised to satisfy experimental data.
4.2.4. Gas-fuel oil boiler set-point temperature
The gas-fuel oil boiler only works when the global regulator orders, with the aim of beingin agreementwiththedistributionnetworkset-pointtemperature.That iswhywe want to be
(5)
(6)
equal to zero when the gas-fuel oil boiler does not work and equal to the network set-point temperature when it does. First we use to define the cascade set-point temperature ( ) as follows (7):
With the aim of avoiding a too-abrupt start-up of the gas-fuel oil boiler, caused by a set-point temperature higher than the initial temperature of the water inside the boiler, is filtered.
However, whenthegas-fueloilboilerhastobestopped,it has to be done immediately tolimitthe consumptionoffossilenergy.Forthatpurpose, willbeused.Accordingtothejust-mentioned considerations, is defined in the following way, with and two coefficients to be identified and the time index (8):
4.2.5. Identification results
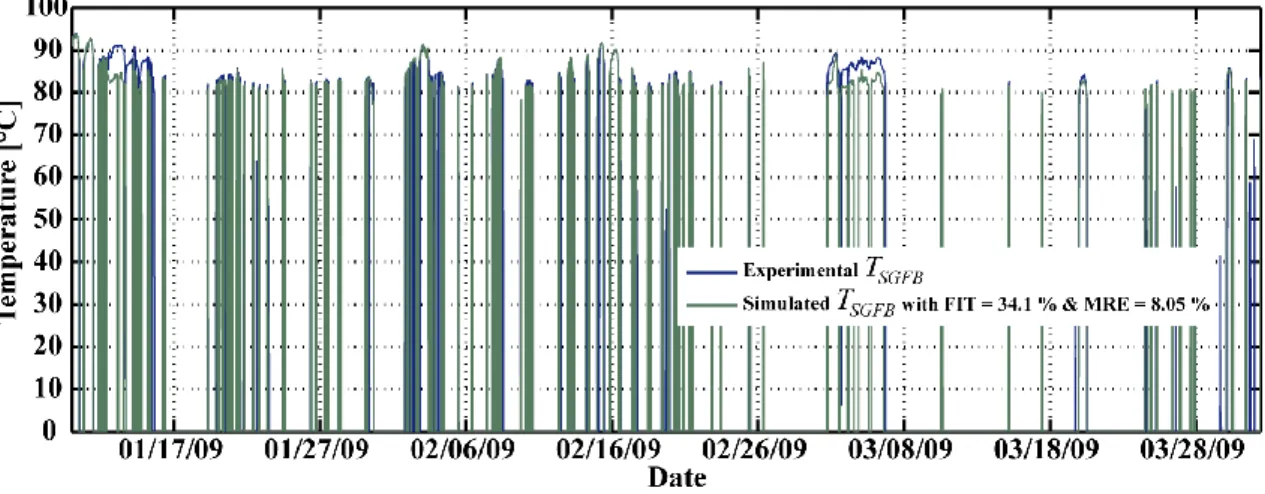
Table 1 (Appendix) summarizes the results of the identification process. Over-all, these results can be considered assatisfactory,inparticularforboththedistributionnetwork( )(Figure 4) and the woodboiler ( ) (Figure 5) set-point temperatures which are only calculated using outdoortemperature.Experimental( )andsimulated( )dataarecomparedcalculating theMean Relative Error (MRE) and the curve fitting (FIT), a widely-used similarity criterion (9):
Figure 4. Distribution network set-point temperature.
Figure 5. Wood boiler set-point temperature.
(7)
(8)
(9)
Figure 6. Gas-fuel oil boiler set-point temperature.
Both the FIT and the MRE are about 65% and 3%, 53% and 7% and 34% and 8% for , and respectively. Let us note that, because of uncertainty about the way the gas-fuel oil boiler is engaged or stopped ( ), the results for both the cascade ( ) and the boiler ( ) (Figure 6) set-point temperatures are not so good, but still consistent.
4.3. Wood boiler
Figure 7 describes the design of the 4.5 MW wood boiler, the way the water passing through the boiler is warmed up (section 4.3.1), as well as all of the parameters used to model its functioning.
Figure 7. The wood boiler.
(11) 4.3.1. Wood boiler working
The wood boiler is the main component of the district boiler of La Rochelle (Figure 7). It uses ground woodchip to heat cold water. Let us note that this wood has to meet criteria such as the size of the pieces, the dust rate or about humidity. However, the wood qualitydoesnotremain the same all the time. As a result, this impacts on both the working and the performance of the boiler.
The wood pallets come from a silo on a treadmill then are dumped gradually into a lock. Its filling up is done until the wood reaches the desired level, what represents a mean weight of about 37 kg. A tappet allows the wood to enter inside the boiler. As a consequence of this mechanism, the volume of injected wood may vary significantly. Inside the boiler, the wood is burned step-by-step, in both the fireplace and the combustion chamber, and the ashes are removed. The cold water is firstwarmedupwhilepassingthroughanair-to-waterheatexchanger (in the combustion chamber) then, in a second heat exchanger, using hot smokes, filtered and evacuated through a smokestack.
Let us note that the functioning of the wood boiler is impacted by the presence of clinker as well as dirtying. It is also related to the regulation of influential parameters. First, the temperature of thewaterleavingtheboileriscontrolled,usingaclassical PID controller with saturation, to follow thenetworkset-pointtemperature.Asecondcontroller regulates, through a fan used for recycling the smokes, the temperature inside the combustion chamber. Both the temperature set-point and the exact way the controller impacts on the behaviour of the fan are unknown. Next, the oxygen rate in the smokes leaving the boiler is regulated thanks to the opening of shutters (one wants 12% of oxygen in these smokes). Finally, the suction inside the fireplace is regulated around 160 Pa, via the control of a smoke extractor fan. Let us note that all the just-mentioned controllers work separately but are linked one another. Because of the lack of information about these regulations and because many influential parameters are not measured, we focused on the most significant regulation i.e. the regulation of the temperature of thewaterleavingtheboiler and the woodconsumption,relatedtothetappet.Asaconsequence,weidentified ablackboxHammerstein- Wiener [30-35] model composed of a linear and two nonlinear blocks (N-L-N) [36]. The model of the wood boiler has four inputs and four outputs. The four inputs are the temperature of the waterentering thewoodboiler ( ), theboilerset-point temperature ( ) (section 4.2.2.), the flow of the water passing through the boiler ( ) and the parameter . Thankstodailyresets ( ),one can calculate both the daily and the cumulative consumptions of wood. The fouroutputs are the number of tappet strokes perfiveminutes( ),the just mentioned and parametersand, finally,thetemperatureofthewaterleavingtheboiler( ) (Figure 8).
Figure 8. Wood boiler model (in brackets, the model equations).
First, a nonlinear static transformation (a piecewise affine linear function,composedoften linearpieces,isused),isappliedtotwo( and )ofthethreemodelinputs(10):
Becauseitcan onlytaketwovalues,theflowofthewaterpassingthroughtheboiler doesnot undergo the transformation. The piecewise affine linear function used is defined, ,with
, and if , and otherwise (11):
(10)
(12)
(13)
(14) (15)
(16) (17) is the break point of coordinates , . The identification process allows finding therightcoordinatesofthesebreakpoints.The linear block makes use of , and to produce
(12) and (13), with the time index:
The second (output) nonlinear block (again a piecewise affine linear function,composedoften linear pieces, is used) uses and to produce the two outputs of the Hammerstein-Wiener model i.e. the number of tappet strokes per five minutes ( ) (14) and thetemperatureofthe waterleavingthewoodboiler( ) (15):
4.3.2. Wood consumption
Asmentionedinsection4.3.1,boththedaily( )and the cumulative ( ) consumptions of wood are deduced from the number of tappet strokes per five minutes ( ). The mean weight ofthewoodintroducedintotheboilerbythetappetisabout37 kg( ).Withthisvolume, onecan easily calculate the quantity of wood consumed during one day (16) as well as during the considered period(17),with at6a.m.,and otherwise,and thetimeindex:
4.3.3. Identification results
Tables 2 to 7 (Appendix) present the results of the Hammerstein-Wiener model identification.
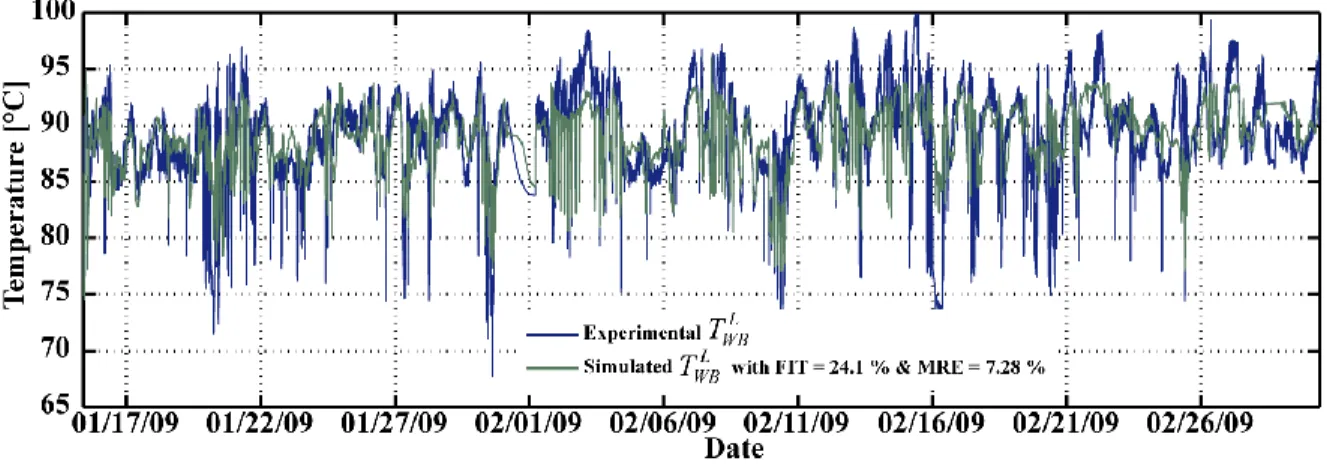
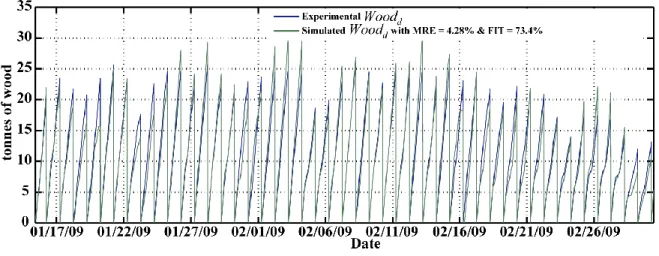
Tables2( )and3( )dealwiththeparameters of the input nonlinear block. Tables 4 ( ) and 5 ( ) are about the parameters of the linear block. Finally, tables 6 ( ) and 7 ( ) deal with the parametersoftheoutputnonlinearblock.Boththedaily( )(Figure 9)andthecumulative ( )consumptionsofwoodarewellmodelled.However,thevariabilityof and (Figure 10)isunderestimated(neverthelessthetemperatureofthewaterleavingtheboileriswellmodelled).
Figure 9. Temperature of the water leaving the wood boiler.
Figure 10. Daily consumption of wood.
OnecannotethatboththeFITand the MREabout24% and 7% for the temperature of the water leaving the wood boiler ( ) and about 73% and 4% for the daily consumption of wood ( ).
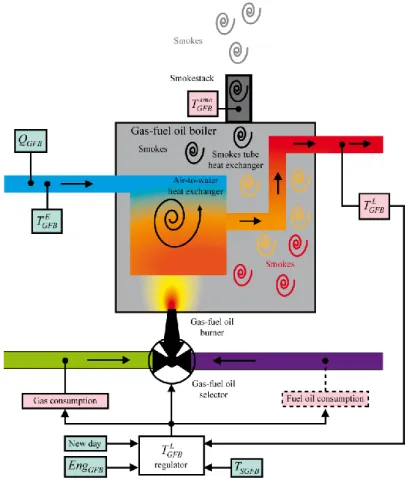
4.4. Gas-fuel oil boiler
Figure 11 describes the design of the 7 MW gas-fuel oil boiler, the way the water passing through the boiler is warmed up (section 4.4.1), as well as all of the parameters used to model its functioning.
Figure 11. The gas-fuel oil boiler.
4.4.1. Working of the gas-fuel oil boiler
The gas-fuel oil boiler is a 7 MW boiler. As previously mentioned, it functions during very cold periods,onlywhenthewoodboilerfailstorespondtothe hot water demand. Its engaging is related to the difference between and (section 4.2.3). Because a special rate about 6000 m3 of gas
(18)
(19)
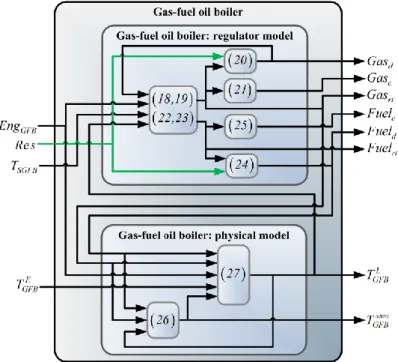
(20) isallowedeverydaytoCofelyGDF-SUEZ( ),gasisfirstconsumed.Iftheboilermustcontinue to run, fuel oil is used (in this case gas is much more expensive than fuel oil). Thecoldwateris firstwarmed up,thanksto the flame of the gas (or fuel oil) burner, while passing through a first air-to-water heat exchanger, then, in a second heat exchanger, using hot smokes. The model of the gas-fuel oil boiler regulator has four inputs and sixoutputs.Thefourinputsare the parameter (section 4.3.1), the way the boiler is engaged ( ),thetemperature ofthewaterleaving theboiler( ) as well astheboilerset-point temperature ( ). The sixoutputs are the real- time ( ), daily ( ) and cumulative ( ) consumptionsofgasandfuel oil. In addition, the gas-fuel oil boiler physical model deals with the variations of both the temperature ofthewaterleavingtheboiler( )andthesmokes temperature ( ), related to the consumption of gasand fuel oil.The model has four inputs, the real-time consumptions of gas ( )andfueloil( ),thewaytheboilerisengaged( )(section4.2.3)andthetemperature of the water entering the boiler ( ), and the two mentionedoutputs ( and ) (Figure 12).
Figure 12. Gas-fuel oil boiler model (in brackets, the model equations).
4.4.2. Gas consumption
The gas consumption is regulated from the difference between theboilerset-point temperature ( ) and the temperature of the water leaving the boiler ( ). Because we do not know how this regulation is carried out, we need to identify all the parameters of the model describing this process. isdefinedasfollows,with if and0 if , and the minimal and maximal volumes of gas usable to feed the burner respectively (19), theboilerset-point temperature, the temperature of the water leaving the boiler, , and three parameters to be identified and the time index (18):
Thedailyvolumeofgasconsumed( )iscalculatedusingthe parameter (toreset , everyday at 6 a.m.) (section 4.3.1) (20). With this calculation, one can check ifthedailyvolumeof gasconsumedhasreached,ornot, ( ).Aspreviouslymentioned, when this happens and if the boiler must continue to run torespondtothe hot water demand, fuel oil is used:
(21)
(22)
(23)
(24) (25)
(26) Finally, with the calculation of (the cumulative consumption of gas), one can observe the consumption evolution during the considered period. This allows validating the proposed model by comparing the real and modelled consumptions of gas (21) during this period:
4.4.3. Fuel oil consumption
Duetothelackofinformationleading to uncertainlyabouthowfueloilconsumptionisregulated and becausenomeasurements are carried out at the district boiler of La Rochelle, the way this parameter is modelled is similar to what we have done with gas consumption (section 4.4.2). A transformation coefficient defines the energy ratio between 1 m3 of gas and 1 litreoffueloil.Withthemodel,onecanestimatethereal-time( ),daily( )andcumulative ( )volumesoffuel oilconsumed.Assuming that thegas-fuel oilboilerisproducingthe same quantity of energy, whatever the combustible used, we developed the model considering the respective high and low heating values of gas ( and ) and fuel oil ( and )as well as, for each of the two combustibles, the ratiosbetweenthese two values.Letus rememberthatthegrossorupperheatingvalueistheamountofheatproducedfromthecomplete combustionof a specificamountofcombustible. It is obtained when all products of the combustion are cooled down to the temperature before the combustion and when the water vapour formed during combustion is condensed. The net or lower heating value is obtained by subtracting the latent heat of vaporization of the water vapour formed by the combustion from the gross heating value. (22-23)isdefined asfollows,with thewaytheboiler is engaged, the Boolean parameter defined in section 4.4.2, the boiler set-point temperature, the temperature of the water leaving the boiler, , , , and the minimal and maximal volumes of fuel oil usable to feed the burner respectively (23) and the time index:
Finally, equations (24) and (25) define the daily ( ) and cumulative ( ) consumptions of fuel oil respectively, in the same way we have done with gas consumption:
4.4.4. Smokes temperature
Aspreviouslymentioned,afterbeingwarmedupwhilepassingthroughafirstair-to-water heat exchanger, the cold water is warmed up again, using the hot smokes which are leaving the gas- fuel oil boiler. As a consequence, one needs first to understand how the smokes temperature ( ) evolves with the aim of accurately modelling the temperature of the water leaving the boiler ( ) (section 4.4.5). The smokes temperature (26) is related to the real-time consumption of gas ( ) or fuel oil ( ) and, as just mentioned, to the temperature of the water leaving the boiler. , , , and are parameters to be identified and is the time index:
4.4.5. Temperature of the water leaving the boiler
Thetemperatureofthewaterleavingthegas-fuel oil boiler( )isgivenbyequation(27), with, as previously mentioned, the way the boiler is engaged, the temperature of the water entering the boiler, the smokes temperature, the real-time consumption of gas, thereal-timeconsumptionofoilfuel, , , , , , , , , and the
(27) parameterstobeidentifiedand thetimeindex.Equation(26)allowstakingintoaccount the gas- fueloilboilerdynamicsrelatedtoitsfunctioningmode(letus remember that this boiler functions during very cold periodsonly,whenthewoodboilerfailstorespondtothe hot water demand):
4.4.6. Identification results
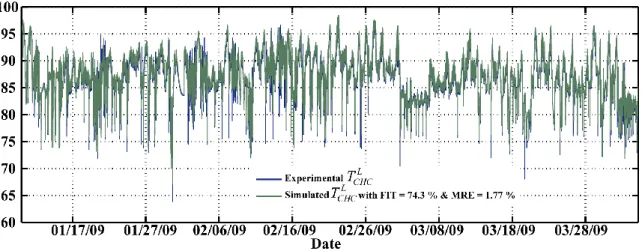
Table 8 (Appendix) deals with the identification process of the parameters of the gas-fuel oil boiler model. Over-all, the model accuracy can be considered as satisfactory. First, one can highlightthatboththedaily ( ) (Figure 13) andthecumulative( ) consumptionsofgasare well modelled, even if the modelled real-time consumption of gas ( ) is not so accurate. The temperature of the water leaving the boiler ( ) (Figure 14) is also well modelled, in particular when the boiler is running. If not, the difference between the real and the modelled temperatures of the water leaving the boiler is not significant because this water does not join the collecting hydraulic circuit. Finally, let us note that the model performance is strongly related to the boiler engaging ( ) which is not easy to model (section 4.2.3). Both the FIT and the MRE are about 76% and 3% for the daily consumption of gas and about 44% and 9% for the temperature of the water leaving the gas-fuel oil boiler.
Figure 13. Daily consumption of gas.
Figure 14. Temperature of the water leaving the gas-fuel oil boiler.
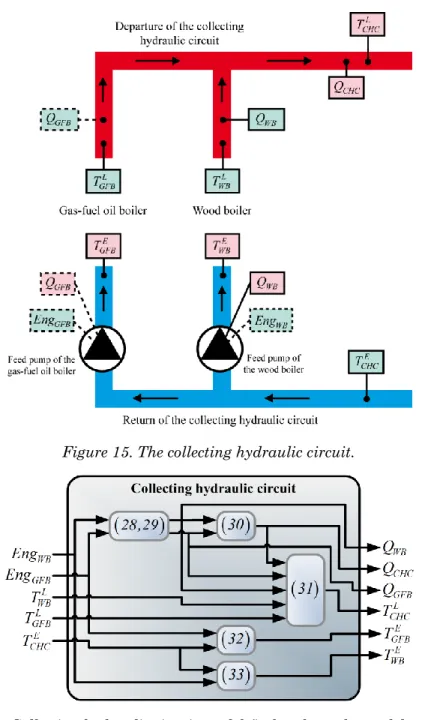
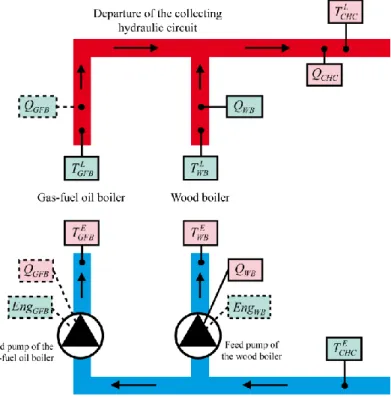
4.5. Collecting hydraulic circuit
The modelling of the collecting hydraulic circuit (Figure 15) deals with both the flow and the temperature of the water passing through the circuit. First, the proposed model describes the thermodynamic behaviourofthewateratthe "departure" part of the circuit.Wemodelledtheflow of the water passing through both the wood and the gas-fuel oil boilers, knowing which valves are open, and we used this parameter to estimate both the flow and the temperature of the water entering the collecting hydrauliccircuit.Theproposedmodelalsodealswiththethermodynamic behaviourofthewateratthe"return"partofthecircuit.Inthissense, we modelled the temperature of the water entering the boilers thanks to both the temperature of the water back from the collecting hydraulic circuit and the flow of the water passing through the boilers. The model of the circuithasfiveinputsandsixoutputs(Figure16).Thefiveinputsare , , , and
. The six outputs are , , , , and .
Figure 15. The collecting hydraulic circuit.
Figure 16. Collecting hydraulic circuit model (in brackets, the model equations).
4.5.1. Flow of the water passing through the gas-fuel oil boiler
First,letusnotethat,becausethesamplingtimeislargeincomparisonwiththetimethepump needs to feed the boiler, we do not take into consideration the pump inertia. As a consequence, the
(28)
(29)
(30) (31)
(32) flow of the water passing through the gas-fuel oil boiler ( ) remains a priori unchanged when the stateofthecollectinghydrauliccircuitisstable.Whenthegas-fueloilboilerworksalone(i.e.
while ), its nominal flow is about 344 m3.h-1 ( ). When the two boilers work at the same time ( and ), this nominal flow is about 319 m3.h-1 ( ).
Algebraic equation (28) describesthe waytheflow of the water passing through the gas-fuel oil boiler has been modelled, with and describing the way the two boilers are engaged or stopped:
4.5.2. Flow of the water passing through the wood boiler
Again, and becausethesamplingtimeislargeincomparisonwiththetimethepump needs to feed the boiler, we do not take into consideration the pump inertia. As a result, the flow of the water passing through the wood boiler ( ) remains a priori unchanged when the stateofthe collecting hydraulic circuit is stable. When the wood boiler works alone (i.e. while ), its nominal flow is about 265 m3.h-1 ( ). When the two boilers work at the same time (i.e. and ), this nominal flow is about 246 m3.h-1 ( ). Algebraic equation (29)describes thewaythe flowof the water passing through the wood boiler has been modelled, in the same way we have done with :
4.5.3. Flow and temperature of the water leaving the collecting hydrauliccircuit
The water leaving the collecting hydraulic circuit is the mix of the water leaving the gas-fuel oil boiler and the water leaving the wood boiler. As a consequence, its flow ( ) is equal to the sum of (the flow of the water passing through the wood boiler) and (the flow ofthewaterpassingthroughthegas-fueloilboiler)(30).Itstemperature( )isofcoursedependent on (the temperature of the water leaving the wood boiler) and on (the temperature of the water leaving the gas-fuel oil boiler). It can be expressed as the weighted mean of (to which is assigned ) and (to which is assigned ) compared with (31):
4.5.4. Temperature of the water entering the gas-fuel oil boiler
Thecoldwater entering thegas-fuel oilboileristhewaterback fromthe collecting hydraulic circuit. Iftheboilerisworking( ),itstemperature( )isalmostthesame(theslightly difference is due to thermal losses in the tubing) as thetemperature of the water enteringthe collecting hydraulic circuit ( ). If not ( ), a water gate separates the boiler from the circuit and, as a consequence, (in this case, this is the temperature ofthe residual water present in the lock) decreases slightly. The proposed model deals with a first-order dynamics whenthegas-fueloilboilerworks (allowing adapting to ) while it deals with a third-order dynamics when the boiler is stopped ( , with the district boiler ambient temperature). As a result, one can model the way is evolving, using the following logical (differential) equations (32), with thewaythegas-fueloilboilerisengagedorstopped, ,
, , , , , and the parameters to be identified and the time index: