HAL Id: insu-00614926
https://hal-insu.archives-ouvertes.fr/insu-00614926
Submitted on 6 Feb 2014
HAL is a multi-disciplinary open access archive for the deposit and dissemination of sci- entific research documents, whether they are pub- lished or not. The documents may come from teaching and research institutions in France or abroad, or from public or private research centers.
L’archive ouverte pluridisciplinaire HAL, est destinée au dépôt et à la diffusion de documents scientifiques de niveau recherche, publiés ou non, émanant des établissements d’enseignement et de recherche français ou étrangers, des laboratoires publics ou privés.
Sulfur Degassing From Volcanoes: Source Conditions, Surveillance, Plume Chemistry and Earth System
Impacts
Clive Oppenheimer, Bruno Scaillet, Robert S. Martin
To cite this version:
Clive Oppenheimer, Bruno Scaillet, Robert S. Martin. Sulfur Degassing From Volcanoes: Source Conditions, Surveillance, Plume Chemistry and Earth System Impacts. Reviews in Mineralogy and Geochemistry, Mineralogical Society, 2011, 73, pp.363-421. �10.2138/rmg.2011.73.13�. �insu-00614926�
Sulfur Degassing From Volcanoes: Source Conditions, Surveillance, Plume Chemistry and Earth System Impacts
Clive Oppenheimer1,2 Bruno Scaillet1 and Robert S. Martin4
1 Centre National de la Recherche Scientifique-Institut National des Sciences de, l’Univers, Université d’Orléans, Université François Rabelais de Tours, Institut des Sciences de la Terre d’Orléans, 1a rue de la Férollerie, Orléans 45071, France
2 Department of Geography, University of Cambridge, Downing Place, Cambridge CB2 3 EN, United Kingdom
3 School of Biological and Chemical Sciences, Queen Mary, University of London, United Kingdom, co200@cam.ac.uk
INTRODUCTION
Despite its relatively minor abundance in magmas (compared with H2O and CO2), sulfur degassing from volcanoes is of tremendous significance. It can exert substantial influence on magmatic evolution (potentially capable of triggering eruptions); represents one of the most convenient opportunities for volcano monitoring and hazard assessment; and can result in major impacts on the atmosphere, climate and terrestrial ecosystems at a range of spatial and temporal scales. The complex behavior of sulfur in magmas owes much to its multiple valence states (−II, 0, IV, VI), speciation (e.g., S2, H2S, SO2, OCS and SO3 in the gas phase;
S2−, SO42−
and SO32−
in the melt; and non-volatile solid phases such as pyrrhotite and anhydrite), and variation in stable isotopic composition (32S, 33S, 34S and 36S; e.g., Métrich and Mandeville 2010). Sulfur chemistry in the atmosphere is similarly rich involving gaseous and condensed phases and invoking complex homogeneous and heterogeneous chemical reactions. Sulfur degassing from volcanoes and geothermal areas is also important since a variety of microorganisms thrive based on the redox chemistry of sulfur: by reducing sulfur, thiosulfate, sulfite and sulfate to H2S, or oxidizing sulfur and H2S to sulfate (e.g., Takano et al. 1997; Amend and Shock 2001; Shock et al. 2010). Understanding volcanic sulfur
degassing thus provides vital insights into magmatic, volcanic and hydrothermal processes;
the impacts of volcanism on the Earth system; and biogeochemical cycles. Here, we review the causes of variability in sulfur abundance and speciation in different geodynamic contexts;
the measurement of sulfur emissions from volcanoes; links between subsurface processes and surface observations; sulfur chemistry in volcanic plumes; and the consequences of sulfur degassing for climate and the environment.
Geodynamics and the geochemical behavior of sulfur
The sulfur released by magmas in volcanic emissions may derive from three different sources:
dissolved in the silicate liquid, present in a coexisting gas phase at depth, or from the
breakdown of sulfur-bearing minerals. Both the amount of sulfur locked in solid compounds (essentially sulfates and sulfides) and that dissolved in silicate melt under pre-eruptive conditions can be accurately measured. The greatest unknown in assessing the budget of sulfur that can potentially be sourced from degassing magmas comes from the presence of an
―excess‖ gas phase at depth, i.e., in the reservoir where the magma resides for a certain time prior to eruption (Shinohara 2008). This possibility introduces the difficulties of establishing the sulfur content of the gas phase in addition to the abundance of gas relative to minerals and silicate melt phases. Neither variable can be assessed by direct observation or geophysical investigations. We rely, therefore, on indirect means to estimate the abundance of gas and its sulfur content at depth. In the following subsections, we first consider the case for subduction zone magmas, concerning which considerable progress has been achieved in recent years, and then review the evidence for hot spot and ocean ridge environments.
Subduction zones
Although prior research had already suggested the presence of a gas phase at depth in arc magmas (Rose et al. 1982), the first eruption for which the case for an ―excess‖ gas phase was strongly articulated was that of El Chichón in 1982, thanks to the efforts of the late Jim Luhr.
He carried out detailed petrological work on this sulfide- and sulfate-bearing andesitic magma (Luhr et al. 1984 Luhr 1990). Scaling estimates of pre-eruptive dissolved sulfur (measured in crystal-hosted melt inclusions) by the eruption magnitude suggested a sulfur release as much as two orders of magnitude lower than the SO2 measured by satellite remote sensing
techniques (see later section). This great discrepancy between observations and petrologic estimates led Luhr et al. (1984) to suggest that the ―excess‖ sulfur (i.e., that missing from the petrological calculation) was most probably stored in a coexisting gas phase in the reservoir.
This approach revealed a similar picture for the next major sulfur-rich volcanic cloud, that released by the 1991 Plinian eruption of Mt. Pinatubo in the Philippines. Here again,
comparison between remote sensing measurements and petrological calculations led Westrich and Gerlach (1992) to conclude the existence of an ―excess‖ gas phase in which most of the sulfur was stored prior to eruption. An alternative scenario for sulfur release during the Pinatubo eruption involving anhydrite breakdown during decompression was proposed (Rutherford and Devine 1996) but such a mechanism is not supported on kinetic grounds (Gerlach et al. 1996). The evidence for excess sulfur stored in a gas phase has been reported since for a number of other active volcanoes, including Mt. St. Helens (USA, Gerlach and McGee 1994), Redoubt (USA, Gerlach et al. 1994), Nevado del Ruíz (Colombia, Williams et al. 1986; Sigurdsson et al. 1990), several Chilean volcanoes (Andres et al. 1991; Matthews et al. 1999) and Anatahan (Mariana Islands) during its 2003 eruption (de Moor et al. 2005).
Thanks largely to satellite remote sensing estimates, there is, therefore, compelling evidence supporting the concept that arc magmas, in particular those of evolved composition, can hold a significant part of their sulfur budget in a gas phase at depth. The observed sulfur budgets point to a gas phase amounting to a few wt% of the magma, with a sulfur content (of the gas) of up to a few wt%.
Another method used to retrieve gas abundance in magma reservoirs is based on the
geochemical behavior of trace elements that are prevalent either in the silicate melt or in the gas phases (Wallace and Edmonds, 2011 this volume). If the partition coefficients of those elements are known, then it is possible to calculate the amount of a gas phase in the reservoir given a series of melt inclusions related to each other by a gas-melt fractionation process.
Based on this assumption, it is possible to evaluate the amount of gas present in the various parcels of magma sampled by the melt inclusions. Such an approach has been applied successfully to the Bishop Tuff eruption (Wallace et al. 1995, 1999) and also to the 1991 Pinatubo eruption (Wallace and Gerlach 1994). Of particular importance is the latter case because the calculated abundance of gas in the reservoir (up to 5 wt%) corresponds to a sulfur
yield similar to that measured independently by satellite remote sensing (around 9 Tg S).
Consideration of percolation theory led Wallace (2001) to conclude that this value might represent a fluid mechanical threshold. In other words, a magma reservoir cannot sustain more than 5 wt% of gas, beyond which all excess gas arising from further crystallization or
supplied from deeper levels to the upper regions of the reservoir, is lost via percolation of gas through a permeable bubble network to the top of the reservoir and into the hydrothermal system.
The sulfur content of gas in a magma reservoir can be also estimated from thermodynamic calculations. Using standard concepts of homogeneous equilibria in the C-O-H-S system, as pioneered by Holloway (1977, 1987), it is possible to calculate the abundance and nature of volatile species present in the gas phase. Given the potentially wide range of application of such an approach, its basic principles are summarized here.
The gas phase is modeled in the C-O-H-S system, which typically accounts for over 95 mol%
of the bulk composition of volcanic gases. Halogens are next in abundance (Aiuppa et al.
2009) but though they potentially affect sulfur solubility in relatively oxidized silicate melts (Botcharnikov et al. 2004; Webster et al. 2009), their role in affecting sulfur behavior in magmatic gases is neglected here for simplicity. Species typically considered are H2O, H2, CO2, CO, CH4, S2, SO2, H2S and O2. The five coupled equilibria that govern the abundances of these species in the gas are:
with the corresponding equilibrium constants:
where fi is the fugacity of species i. In such a system at any fixed pressure (P) and temperature (T), the knowledge of three additional intensive parameters constrains species‘ proportions (Holloway 1987).
The equilibrium constants Ki can be computed from standard thermodynamic databases (Symonds and Reed 1993). The additional relationships needed are:
where Xi is the mole fraction of species I, and γi the fugacity coefficient (a correction for non- ideality; γi = 1 for an ideal gas) at pressure P and temperature T. Several equations of state (EOS) enable calculation of the fugacity coefficient of the main species of interest (see, for instance, Ferry and Baumgartner 1987) but, in the context of the present review, we focus on low-pressure conditions (<300 MPa) where most magmatic reservoirs reside, and for which there is thus little difference between the various EOS outcomes. In the following, use will be made of the classic MRK EOS introduced to geologists by John Holloway in 1977.
The most straightforward way to apply the above approach is to rely on information given by melt inclusions regarding pre-eruptive dissolved volatiles. Conventional micro-analytical tools (FTIR, SIMS, EMPA) permit accurate determination of the most common volatile species dissolved in silicate glasses, notably the bulk contents of H2O, CO2 and S (Ripley et al. 2011, this volume). Once these quantities are known, it suffices to have appropriate
thermodynamic models of volatile solubilities (e.g., Dixon et al. 1995; Zhang 1999; Moretti et al. 2003; Behrens et al. 2004; Clemente et al. 2004) to shift from concentrations to
corresponding fugacities (i.e., f H2O, fCO2 or fS2), which are the input parameters needed to solve the above set of equations (e.g., Anderson et al. 1989; Scaillet and Pichavant 2003, 2005). In general, thermobarometry based on mineral-mineral or mineral-melt equilibria (see Putirka 2008) provides further constraints on both temperature and fO2. The main unknown variable with respect to most active volcanoes is the reservoir depth, which can be evaluated either from phase equilibria (e.g., Rutherford et al. 1985; Johnson and Rutherford 1989;
Martel et al. 1998; Cottrell et al. 1999; Scaillet and Evans 1999; Costa et al. 2004; Di Carlo et al. 2006), or from gas saturation systematics as first shown by Anderson et al. (1989) for the Bishop tuff for the C-O-H system. In the latter method, one seeks the pressure value which, for a given set of T, f H2O, and fCO2conditions, fulfills the constraint of ∑Xi = 1.
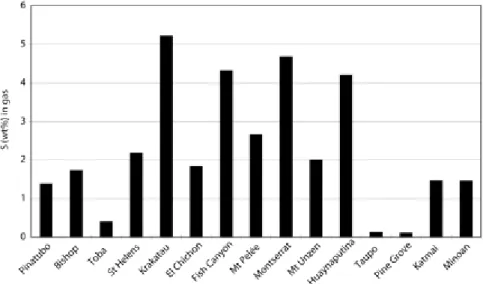
Application of this thermodynamic approach to the C-O-H-S sytem was first attempted by Scaillet and Pichavant (2003) for several recent arc eruptions, for which the key intensive variables mentioned above were reasonably well known. The results are shown in Figure 1, where it can be appreciated that the sulfur content in the gas amounts, at most, to 5–6 wt% (or less than 6 mol% of H2S and SO2) for the investigated samples. Another important aspect is the considerable variability between magmas of the studied eruptions, with sulfur content as low as 0.1 wt% (less than 0.1 mol%) in some cases. This is despite the fact that all considered eruptions represent a single tectonic environment, namely subduction-zone volcanism. The reasons for such variability are certainly complex and include source heterogeneity (in terms of sulfur content); the vagaries associated with the various fractionation mechanisms that can affect a magma between its source and the shallow reservoir; and the different types of
interactions between host rocks and magma or during magma mixing, both of which are commonplace in arc environments.
Figure 1. : Plots of sulfur concentration of the pre-eruptive gas phase for several historical eruptions in arc settings. The sulfur content has been calculated using a thermodynamic approach (see text and Scaillet and Pichavant 2003).
Whatever the causes, such diversity clearly indicates that evaluating the actual sulfur content of the gas phase present in a reservoir feeding any active volcano needs to be carried out on a case-by-case basis. It was also shown by Scaillet and Pichavant (2003) that in order to make the volcanic gas data match with computed gas composition at depth, the reservoir must already be saturated with at least 1 wt% gas phase, a conclusion consistent with evidence from remote sensing observations discussed above. The calculation of the deep-gas composition also reveals that it is, in general, somewhat richer in sulfur species‘ than
corresponding volcanic exhalations, with the sum of sulfur-bearing species approaching a few mol% (for evolved magma compositions such as dacites), whilst in gases from volcanic arcs, sulfur-bearing species abundances are less than 1 mol% (see Symonds et al. 1994). This difference is obviously related to the fact that, upon ascent and with reduced pressure, the water originally dissolved in the silicate liquid in the reservoir (generally in the range 4–7 wt%) is almost totally lost to the gas phase, which thus becomes very water rich. Another difference worthy of note is the fact that high-pressure gases are generally dominated by H2S, while the reverse is observed in volcanic gases, as a result of the pressure effect on equilibria governing the relative abundance of H2S and SO2 (see below).
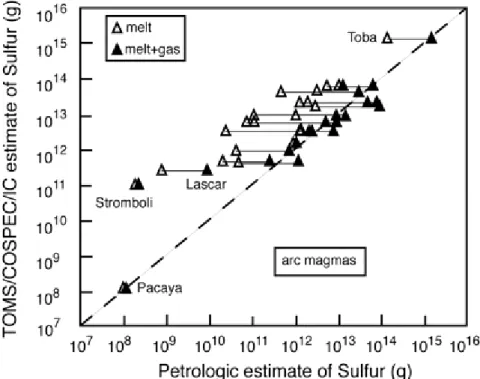
This same method has been applied to volcanoes in non-arc settings by Scaillet et al. (2003), with the goal of estimating atmospheric sulfur yields of several major volcanic eruptions capable of impacting climate at a regional-to-global scale. Figure 2 compares the amounts of sulfur released by several eruptions, as derived by the improved petrologic approach, with those obtained by remote sensing techniques. In the derivation of petrologically-based values it is assumed that the magma coexisted with 5 wt% gas. Clearly, the generally good
agreement observed between the two data sets supports the idea that most magmas contain a significant proportion of gas prior to eruption. Except for some outliers, the extended database provided by Scaillet et al. (2003) confirms that the sulfur content of the gas phase in silicic-to- intermediate arc magmas is always below 10 wt%, with an average of around 3 wt%. When
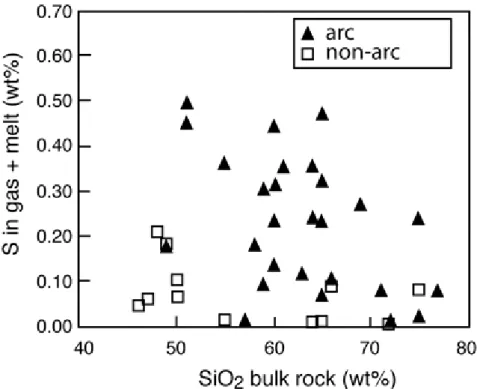
plotted against silica content of the magma, only a weak negative correlation appears: mafic magmas showing a tendency to be slightly richer in sulfur than silicic ones (Fig. 3). The lack of a more pronounced negative correlation contradicts the common view that silicic magmas tend to be poorer in sulfur than mafic ones, because of their intrinsic lower sulfur solubility:
the latter fact is more than compensated for by the propensity of the gas phase to hold any sulfur present in the system (e.g., Scaillet et al. 1998; Keppler 1999, 2010), especially under oxidized conditions (Scaillet et al. 1998).
Figure 2. : Plot showing comparison of sulfur yields for several historical volcanic eruptions estimated from remote sensing data (Table 3) and petrological and thermodynamic
constraints, assuming that the gas phase in the pre-eruptive reservoir amounts to 5 wt% (from Scaillet et al. 2003). The results for sulfur yields obtained only from melt degassing are also shown.
Figure 3. : Plot of relationship between the bulk content of S in various magmas erupted at arc and non-arc volcanoes versus the magma SiO2 content (from Scaillet et al. 2003
However, it must be pointed out that mafic arc magmas seldom erupt and among those rare cases, only a handful have had their pre-eruptive conditions well constrained. The currently available information on the sulfur content of gas in mafic arc magmas relies on a very
limited data base. One of the best understood arc basalts is that erupted by Stromboli volcano, whose plumbing system is constrained by both phase equilibria (Di Carlo et al. 2006;
Pichavant et al. 2009), detailed melt inclusion work (Métrich et al. 2001; Bertagnini et al.
2003, 2008), and volcanic gas emission data (Allard et al. 1994; Burton et al. 2007a; Aiuppa et al. 2010; Allard 2010). Here, the observations point to a deep reservoir located at pressures of 200–300 MPa, and connected to a very shallow reservoir residing at pressures equivalent to around 10–30 MPa. This, in turn, feeds the persistent, mildly explosive activity that typifies Stromboli. The calculation of the gas phase composition in the deep reservoir at 200–300 MPa (Scaillet and Pichavant 2005) indicates a sulfur content in the range of 0.3–6 wt%, which is similar to that inferred for more silicic compositions. It is worth stressing that these
calculations depend strongly on fS2, which remains difficult to constrain for H2O-rich arc basalt, owing to the lack of appropriate thermodynamic models for sulfur solubility in hydrous mafic liquids. This is clearly an area where more experimental work is needed. It is thus difficult to know whether the Stromboli case is widely representative of other mafic arc magmas in respect of their sulfur content and yield. Other basaltic volcanoes should have the nature of their plumbing systems better elaborated in order to answer this important question.
Ocean ridge environments
Although most magmas by volume are produced and erupted at ocean ridges, very little is known about pre-eruptive gas composition for this tectonic setting. This is due in large part to the difficulties of observing and sampling submarine volcanism. One of the closest analogs is seen in the rifting, diking and volcanism of the Afar region (Ferguson et al. 2010), though it is
also a challenging place to conduct fieldwork. Hence, despite collection of some relevant volcanic gas composition data (e.g., Giggenbach and Le Guern 1976; Gerlach 1980), we lack modern petrological data (volatiles in melt inclusions) for corresponding magmas, suitable for constraining system behavior at depth as achieved for subduction zones (e.g., Scaillet and Pichavant 2003). Icelandic volcanism has been better studied, with some detailed information on dissolved volatiles present in magma reservoirs (Métrich et al. 1991; Moune et al. 2009) but here, too, there are very few data on related magmatic gas compositions. Therefore, for this volumetrically important category of magmas we must calculate gas composition at depth using available constraints on dissolved volatiles, which have been well established for a number of dredged oceanic basalts (see Wallace and Edmonds 2011, this volume).
One salient feature of mid-ocean ridge magmatism is its very dry character, dissolved H2O lying in the range of 0.1–0.5 wt%, or even less than 0.1 wt% (Saal et al. 2002). Dissolved sulfur contents are also well characterized, falling in the range of 800–1200 ppm for primitive end members (Wallace and Carmichael 1992; Saal et al. 2002). Carbon dioxide
concentrations are more controversial: some argue that mid-ocean ridge basalts (MORB) are gas-undersaturated under pre-eruptive conditions (Saal et al. 2002), while others (e.g., Sarda and Graham 1990) argue for CO2 contents of magmas well above solubility values at
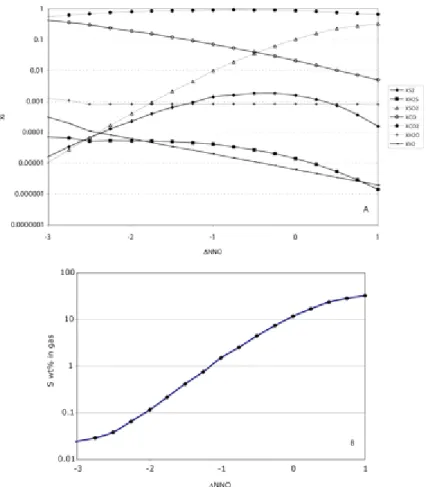
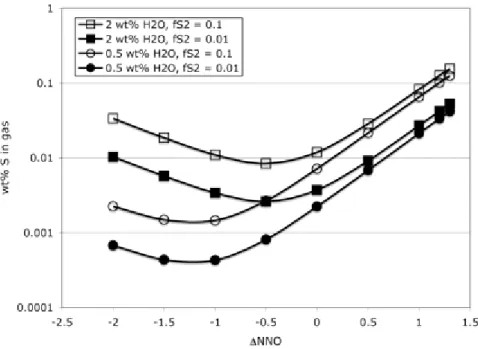
pressures of magma storage in the upper oceanic crust (100–200 MPa). Since the case for undersaturation has been disputed on thermodynamic grounds (Scaillet and Pichavant 2004), we show in Figure 4 the calculated C-O-H-S gas phase composition as a function of fO2 at 1280 °C and 40 MPa for fixed melt H2O content of 0.08 wt% and sulfur melt content around 800 ppm, which are averages for primitive MORB melts (Saal et al. 2002) (note that the bulk CO2 content of the magma need not be known to carry out the calculations since fixing fH2O
and fS2 (at a given P and T) automatically fixes fCO2, and hence XCO2, in the gas). These data can be taken to illustrate the possible sulfur contents of the gas phase coexisting with MORB in reservoirs associated with axial ridges.
Figure 4. : Plots of (a) the variation of fluid species abundances versus f (in log units relative to the nickel-O2 nickel oxide buffer), calculated for volatile conditions of H2O = 0.06 wt%
and 850 ppm dissolved sulfur, which correspond to primitive Mid Ocean Ridge Basalts (Saal et al. 2002). The calculations were made for a pressure of 40 MPa and a temperature of 1280
°C. (b) Evolution of the sulfur content of the gas phase with fO2, corresponding to the gas composition shown in (a).
These calculations illustrate a well-known feature, that the species abundances in the gas phase vary a lot with fO2, with CO2 being the most abundant species in MORBs (Mathez 1984). Sulfur-bearing species are generally present below 1 mol% at fO2below NNO−1, with corresponding sulfur concentration in the gas being below 1 wt% for this fO2 range, or even below 0.1 wt% at around NNO−3. In contrast, at fO2greater than NNO−1, SO2 abundances increase quite significantly to the point that it becomes the second most abundant gas species (after CO2), with sulfur concentration exceeding 20 wt% at around NNO+1. This illustrates the important point that, besides fS2 (or melt sulfur content), the master variable required is precise knowledge of redox state. This remains an inssue: despite decades of effort by various groups (e.g., Christie et al. 1986; Carmichael 1991; Ballhaus 1993; Bézos and Humler 2002;
Li and Lee 2005; Mallmann and O‘Neill 200λ) there is still no consensus on whether MORBs are either strongly (i.e., fO2< NNO−2), or moderately (FMQ-NNO) reduced, or could even share the same redox state as mafic arc magmas (Mallmann and O‘Neill 200λ). If one accepts that most MORBs have pre-eruptive fO2at or below NNO−2, then the sulfur fraction stored in the gas is small, below 1000 ppm, with a negligible contribution to the bulk amount of sulfur degassed. In contrast, if the MORB fO2 is around NNO, sulfur contained in the gas approaches or may even exceed 10 wt%, in which case the gas phase contribution to eruptive loss of
sulfur becomes important, or even dominant, relative to that dissolved in the melt phase, although we have few constraints on the amounts of gas present in the reservoir.
Gas compositions collected from subaerial volcanoes associated with divergent plates (Ardoukoba, Erta ‗Ale, Surtsey; see Giggenbach and Le Guern 1976; Allard et al. 1977;
Gerlach 1980; Sawyer et al. 2008a) have sulfur contents in the range of 10–30 wt%. If those volcanic centers are representative of their deep-oceanic counterparts, it may indicate that MORBs are more oxidized than generally believed. To conclude, the redox state of magmas at divergent plates still needs to be better evaluated—a conclusion that also applies to many, if not all, other magmas! This issue remains a priority for improving our understanding of sulfur-related magmatic processes.
Hot spots
The few hot spots where volcanism is presently active include Hawaii and Réunion. We also include Etna in this discussion although its tectonic setting is especially complex and
contested (e.g., Schiano et al. 2001) with chemical characteristics of the magmas pointing to either hot spot or arc settings. Thus, any conclusions drawn from the Etna case should be viewed cautiously. Volcanic gas emissions from both Hawaii and Etna have been studied in considerable detail over the last half century, both using conventional approaches, as
summarized below and by Symonds et al. (1994), and with more recently developed ground- based remote sensing tools (see below). Volcanic gases emitted at la Réunion are less well characterized as there is little degassing between eruptions (e.g., Toutain et al. 2002). In all three cases, a wealth of microanalytical work aimed at determining pre-eruptive dissolved volatile contents has been undertaken (e.g., Dixon et al. 1997; Bureau et al. 1998, 1999;
Wallace and Anderson 1998; Dixon and Clague 2001; Wallace 2002; Spilliaert et al. 2006).
Despite some significant variations between the three volcanoes, it appears that hot spots fall roughly in between oceanic and arc magmas, in terms of their pre-eruptive H2O contents (0.4– 3 wt%) and redox state (NNO-NNO+1), although considerable uncertainties remain
concerning redox state evaluation or significance (Gerlach 2004a; Roeder et al. 2004). The pre-eruptive melt sulfur contents are somewhat higher than for MORBs at comparable levels of FeO content, ranging between 1000 to 2000 ppm (Bureau et al. 1999; Dixon and Clague 2001), and reaching 3000 ppm in the H2O-rich variety of basaltic magma erupted at Etna (Spilliaert et al. 2006).
The gas phase composition in the magma reservoir of hot-spot volcanoes can be computed, as illustrated for MORBs, assuming a pressure depth for the shallow reservoir in the range 100– 200 MPa and various contents for key volatiles, based on petrological data summarized above. Figure 5 shows the variations of sulfur content of the gas phase as a function of fO2, for various H2O contents and fS2. For the latter, petrological investigations indicate that fS2 of hot- spot related basalts is within the range of 0.1–100 kPa (Wallace and Carmichael 1992). As already pointed out for MORBs, these calculations show clearly that, in general, the sulfur content of gas remains below 0.1 wt% at fO2 below NNO (hence, to a first approximation, the gas contribution to the bulk sulfur budget can be ignored). Above this fO2 threshold, the sulfur content can increase dramatically, even becoming the dominant constituent of the gas phase.
Note that, under fairly reduced conditions (NNO–2), the gas can become quite sulfur-rich if the magma has a dissolved H2O content of 3 wt% or more. However, such elevated H2O levels have not been documented for reduced terrestrial basalts (but see Gaillard and Scaillet 2009 for the case of Mars).
Figure 5. : Plot of variation in S content of gas versus fO2 (in log units relative to the nickel- nickel oxide buffer), calculated for 100 MPa total pressure for a range of volatile contents and corresponding fugacities (H2O and S) corresponding to the conditions inferred for present day hot spot related basalts (see text).
Volcanic gases measured at other hot spots are essentially similar to those of Kilauea (Gerlach 1980, 1993), which have sulfur contents in the range of 20–30 wt%, regardless of their more or less primitive character (i.e., degassed right after their arrival in the shallow reservoir or subsequently following equilibration with local conditions). Mt. Etna gases analyzed during the volcano‘s 1λ70 eruption are the most sulfur-rich volcanic gases so far collected, with a total sulfur content exceeding 50 wt% and a SO2/H2S molar ratio of around 100 (Huntingdon 1973; Gerlach 1979). The more recent activity has shown a significant decline in sulfur content of emitted gases (Allard et al. 2005), although Etna remains today one of the main sustained volcanic sources of sulfur to the atmosphere (Allard et al. 1991; Allard 1997). These two examples seem thus to suggest that hot-spot activity may coincide with elevated rates of sulfur emission. The high sulfur content of gases released also seems to indicate that magma redox state in the hot-spot context is somewhat oxidized relative to that of MORB.
This evidence once again highlights the important role of redox conditions in gas phase composition. In terms of the sulfur yield of past eruptions to the atmosphere, little can be said without good constraints on redox. The problem can be even more complex when
decompression-related effects on magma fO2 are taken into account. Recent modeling efforts, though rudimentary, indicate that volatile loss during decompression may strongly alter magma redox state (Moretti et al. 2003; Burgisser and Scaillet 2007; Burgisser et al. 2008;
Gaillard and Scaillet 2009), adding further ―noise‖ to the direct interpretation of volcanic gas data in terms of magma storage or generation conditions. Modeling the interplay between decompression and redox state of magmas and related gases is clearly another fruitful avenue for future research.
Flood basalts and silicic parts of large igneous provinces
Interest in the potential global impacts of effusive volcanism has been fueled by the
coincidence of several of the mass extinctions that punctuate the fossil record with the flood basalt episodes of large igneous provinces (LIPs; Rampino and Stothers 1988; Wignall 2001;
Oppenheimer 2011). Estimated sulfur yields of such provinces are exceptional (e.g.,
Thordarson et al. 1996), and Ar-Ar chronometry has shown that the immense volumes of lava associated with flood basalts (> 106 km3) are erupted in comparatively short time periods For instance, the 30-Ma-old Ethiopian Plateau basalts erupted in under 1 Ma (Hofmann et al.
1997) while the main eruptive phase of the Deccan traps (65.5 Ma old) was over within 0.5 Ma (Courtillot and Renne 2003). Such rapid eruption rates imply correspondingly high fluxes of sulfur and other volatiles to the atmosphere.
Self et al. (2008) analyzed melt inclusions in samples of the Deccan basalt and estimated that for each cubic kilometer of lava erupted, at least 3 Tg of SO2 were released into the
atmosphere (plus a comparable amount of HCl). An individual pulse of 1000 km3 of magma would therefore release 4–5 Gt of SO2(at least 200× as much as Pinatubo‘s eruption in 1λλ1).
We have very little idea how long each flow took to erupt but estimates vary from years to a few decades. A 10-year duration would correspond to a mean annual eruption rate of 100 km3 of lava and 10–20× more sulfur than emitted by Pinatubo in 1991, whose sulfate aerosol veil resulted in a 0.3–0.4 °C global average cooling for 2–3 years (see below; Hansen et al. 1996).
Such massive eruption intensities along with the expanse of active lava covering the surface are thought to have generated especially energetic fire fountains and vigorous atmospheric updrafts, enabling a substantial fraction of the released sulfur gases to reach the stratosphere.
Here, they would have oxidized to form a sulfate aerosol veil capable of climate forcing.
The estimates based on basaltic melt inclusions (Sharma et al. 2004; Self et al. 2008) set a lower limit on sulfur outgassing since, for equilibrium partitioning between melt and gas, any pre-eruptive magmatic gas must hold a finite amount of sulfur. In view of the preceding discussion of the importance of knowing fO2 in order to evaluate the distribution of sulfur between silicate melt and gas phases (oxidized magmas tend to store a significant quantity of their sulfur inventory in the gas phase), an important factor in assessing the environmental impacts of flood basalt events is their redox state. Flood basalts with fO2in the range of NNO−
to NNO+1 could yield sulfur outputs far higher than those estimated from melt inclusions alone. If, in contrast, the basalts have a lower redox state, then the sulfur content of the gas phase would be of negligible significance in calculating total sulfur emissions. Detailed investigations of volatile distribution have been carried out for the volcanoes of Hawaii, the modern archetype of the plume, or hot spot, regime viewed as parental to flood basalts. These have documented great regional variability in magma volatile contents and redox states (Dixon et al. 1988, 1991, 1997; Dixon and Clague 2001). If the Hawaiian plume can be considered as representative of hot spot magmatism through geological time, then the associated sulfur degassing is likely to have been very variable in time and space.
A further point to be stressed is that, along with the enormous quantities of basalt, flood provinces can include a silicic component (e.g., the Ethiopia-Yemen (30-Ma-old) and Etendeka-Paraná (133-Ma-old) provinces). The behavior of sulfur in such environments suggests that the silicic end-members could contribute significantly to LIP sulfur budgets (Scaillet and Macdonald 2006). A critical factor is the Al/(Na+K) molar ratio of rhyolites.
Peralkaline rhyolites have much higher sulfur solubilities than metaluminous magmas and, as a result, could convey comparable amounts of sulfur as the mafic counterpart of LIPs. In
contrast, metaluminous rhyolites with much lower sulfur solubilities and different mode of production (i.e., by remelting previously dehydrated crust leading to particularly H2O- and S- poor magmas, see Scaillet and Macdonald 2006), could be expected to have diminished impacts on the atmosphere and climate for eruptions of the same magnitude. This may be one reason for the limited correlation apparent between the intensity of environmental changes and the magnitude of coincident flood magmatism (Wignall 2001).
MEASURING VOLCANIC SULFUR EMISSIONS
Gas emissions from volcanoes are sourced within magmatic plumbing systems and their associated hydrothermal systems. Their vigor and chemical and isotopic composition can reveal much about subterranean processes, especially concerning the chemistry,
differentiation, storage and transport of magmas and the relationships between degassing and eruptive style. The importance of gas emissions was recognized by early pioneers of
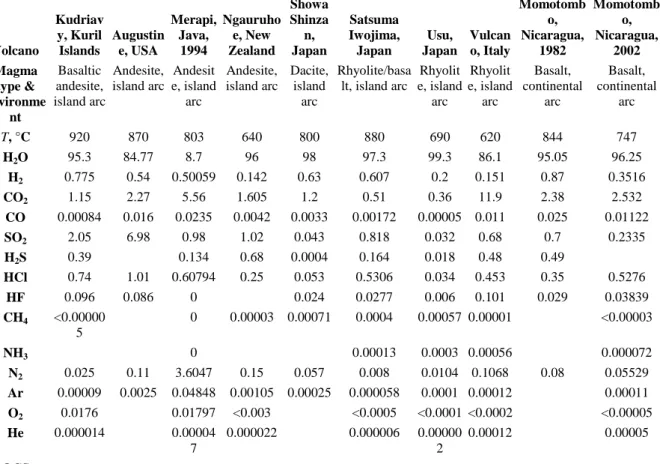
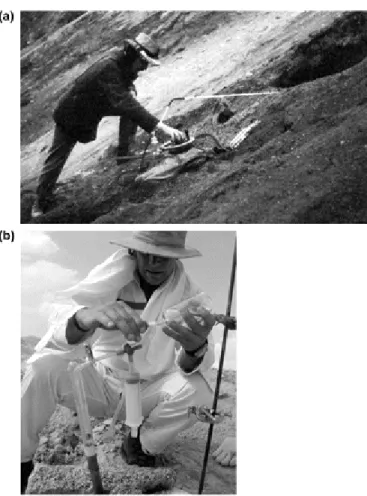
volcanology, including Frank Perret and Thomas Jaggar, who bubbled fumarole gases into bottles of alkaline solution to trap the acidic species for subsequent analysis (Fig. 6a; Perret 1909, 1950; Jaggar 1940). This sampling method remains relevant today, with incondensable species held in the bottle‘s head space also studied (Table 1)
Table 1. : Representative compositions of high-temperature volcanic gas samples* in mol%.
Data from compilations in Giggenbach (1996), Oppenheimer (2003), Fischer (2008) and from individual analyses in Gerlach (1980), Oppenheimer et al. (2002b), Oppenheimer and Kyle (2008) and Sawyer et al. (2009).
Volcano
Kudriav y, Kuril Islands
Augustin e, USA
Merapi, Java, 1994
Ngauruho e, New Zealand
Showa Shinza
n, Japan
Satsuma Iwojima, Japan
Usu, Japan
Vulcan o, Italy
Momotomb o, Nicaragua,
1982
Momotomb o, Nicaragua,
2002 Magma
type &
environme nt
Basaltic andesite, island arc
Andesite, island arc
Andesit e, island
arc
Andesite, island arc
Dacite, island
arc
Rhyolite/basa lt, island arc
Rhyolit e, island
arc
Rhyolit e, island
arc
Basalt, continental
arc
Basalt, continental
arc
T, °C 920 870 803 640 800 880 690 620 844 747
H2O 95.3 84.77 8.7 96 98 97.3 99.3 86.1 95.05 96.25
H2 0.775 0.54 0.50059 0.142 0.63 0.607 0.2 0.151 0.87 0.3516
CO2 1.15 2.27 5.56 1.605 1.2 0.51 0.36 11.9 2.38 2.532
CO 0.00084 0.016 0.0235 0.0042 0.0033 0.00172 0.00005 0.011 0.025 0.01122
SO2 2.05 6.98 0.98 1.02 0.043 0.818 0.032 0.68 0.7 0.2335
H2S 0.39 0.134 0.68 0.0004 0.164 0.018 0.48 0.49
HCl 0.74 1.01 0.60794 0.25 0.053 0.5306 0.034 0.453 0.35 0.5276
HF 0.096 0.086 0 0.024 0.0277 0.006 0.101 0.029 0.03839
CH4 <0.00000 5
0 0.00003 0.00071 0.0004 0.00057 0.00001 <0.00003
NH3 0 0.00013 0.0003 0.00056 0.000072
N2 0.025 0.11 3.6047 0.15 0.057 0.008 0.0104 0.1068 0.08 0.05529
Ar 0.00009 0.0025 0.04848 0.00105 0.00025 0.000058 0.0001 0.00012 0.00011 O2 0.0176 0.01797 <0.003 <0.0005 <0.0001 <0.0002 <0.00005
He 0.000014 0.00004
7
0.000022 0.000006 0.00000
2
0.00012 0.00005
OCS
Volcano
Tolbachik , Kamchatk
a, 1976
Kliuchevsk oi, Kamchatk
a
Poas, Costa Rica
Galeras, Colombi
a, 1991
Mt. St.
Helens, USA
Oldoinyo Lengai, Tanzania
, 1999
Nyiaragon go, DR Congo, 2005
Erta
‘Ale, Ethiop ia
Erebus, Antrarctic
a, 2004
Kilaue a, USA, 1918**
*except Lengai, Erebus and Nyiragongo, which were measured by open-path FTIR spectroscopy
** sample J-8 in Gerlach (1980) already adjusted for N2 and Ar and with Cl2 reported as HCl Magma
type &
environme nt
Basalt, continental
arc
Basalt, continental
arc
Basalt/andesi te, continental
arc
Andesite, continent
al arc
Dacite, continent al arc
Carbonati te, continenta
l intraplate
Basanite, continental
intraplate
Basalt, incipie
nt oceanic
ridge
Phonolite, continental intraplate
Basalt, ocean island
T, °C 1020 1100 940 642 710 570–590 1100 1130 >1000 <1200
H2O 98 97.73 95 91.48 98.9 75.6 70.54 79.4 57.9 37.11
H2 0.55 0.59 0.9 0.285 0.4 1.49 0.49
CO2 0.04 0.12 1.35 5.98 0.88 24.4 23.68 10.4 36.4 48.91
CO 0.0001 0.0012 0.012 0.0136 0.003 0.0787 0.86 0.46 2.33 1.5
SO2 0.05 0.09 2.83 0.8415 0.27 0.0197 4.55 6.78 1.4 11.87
H2S 0.002 0.5725 0.62
HCl 1.06 1.42 0.38 0.716 0.15 0.26 0.42 0.69 0.08
HF 0.28 0.25 0.015 0.062 0.03 0.11 1.27
CH4 <0.0001 0.0004 0.00003
NH3
N2 0.004 0.1 0.041 0.12 0.18
Ar 0.000032 0.000025
O2
He 0.00032
OCS 0.0023 0.01
*except Lengai, Erebus and Nyiragongo, which were measured by open-path FTIR spectroscopy
** sample J-8 in Gerlach (1980) already adjusted for N2 and Ar and with Cl2 reported as HCl
Figure 6. : Sampling volcanic emissions the traditional way: Frank Perret on Vesuvius and Patrick Allard on Erta ‗Ale.
Of course, since Perret‘s time, analytical capabilities have developed tremendously, and this manner of gas collection continues to yield the most comprehensive analyses of the chemical and isotopic composition of volcanic gas emissions. However, such sampling is challenging for sustained geochemical surveillance, especially when fumaroles are inaccessible or levels of volcanic activity preclude safe approach. This section focuses on the principal sampling and sensing methods applied to measurements of sulfur emissions from volcanoes. It introduces direct sampling and sensing apparatus, ground-based or airborne ultraviolet spectroscopy (Correlation Spectrometer and successors), ground-based infrared spectroscopy (Fourier transform spectroscopy), and satellite remote sensing, including the important role of the Total Ozone Mapping Spectrometer, Ozone Monitoring Instrument, Infrared Atmospheric Sounding Interferometer and other ultraviolet and infrared sensors, for measuring the SO2 emissions from major eruptions.
Direct sampling
Conventional analyses of volcanic gases have been made by collection of samples directly from fumarole vents using evacuated bottles and caustic solutions, and subsequent laboratory analysis (Symonds et al. 1994). The classic ―Giggenbach bottle‖ (Fig. 6b, Giggenbach 1975;
Giggenbach and Goguel 1989; Giggenbach and Matsuo 1991; Giggenbach et al. 2001) consists of an evacuated glass or quartz vessel partially filled with NaOH or, alternatively, ammonia (NH4OH) solution (Sortino et al. 2006). Sampling is carried out by bubbling gas
through the solution via tubing inserted into the volcanic vent. Hydrogen sulfide and SO2 readily condense according to reactions such as:
The aqueous phase species can be analyzed by ion chromatography. The remaining gaseous species collect in the headspace and are usually analyzed by gas chromatography. A reagent such as Cd(OH)2 or AgNO3 can be used to separate H2S (which reacts with Cd2+ to precipitate CdS, or with Ag+ to precipitate Ag2S) for subsequent analysis (after conversion to sulfate) by ion chromatography (Picardi 1982; Montegrossi et al. 2001, 2008; Aiuppa et al. 2005b). Other solid phases, including Sx, can be quantified (e.g., by progressively oxidizing them and
analyzing the anions by ion chromatography).
Various activated substances such as silica gel have also been used to trap volcanic gas species for subsequent laboratory analysis, e.g., by gas chromatography (Naughton et al.
1963). Base-treated filters and diffusion tubes provide another means to trap acid species, and can be deployed around crater rims and in the vicinity of gas sources (e.g., Allen et al. 2002;
Aiuppa et al. 2004; Martin et al. 2010b). These have been used in studies of SO2 plume dispersion and exposure (Allen et al. 2000; Delmelle 2002; Longo et al. 2005; Aiuppa et al.
2007a; Bhugwant et al. 2009) while rainwater collectors and sulfation plates have been used to map and investigate sulfur deposition (Delmelle et al. 2001, 2003; Aiuppa et al. 2006).
Studies of the aerosol phase in volcanic emissions (of which sulfate is often the most abundant component) have been carried out using particle filters. Such filter-based methods have been extended to characterize aerosol size distribution and chemistry (e.g., Mather et al.
2004b; Martin et al. 2008; Ilyinskaya et al. 2010). The volatiles scavenged out of eruption clouds by ash particles, which then sediment to the ground, can also be studied analytically by leaching samples with distilled water (e.g., Edmonds et al. 2003b; Witham et al. 2005)
Although such approaches offer very high sensitivity, measurements can be difficult and often hazardous to obtain, and complications can arise from post-collection reactions. Also, the typical delays in obtaining results (where laboratory analysis is required) can limit their value in volcanic crisis management.
In situ sensing
One particularly promising approach to volcanic gas surveillance is the application of
electrochemical sensors. These sensors contain an electrolyte, which is exposed to ambient air (and the volcanic emissions) by diffusion (with or without the aid of an air pump). The
ensuing redox chemistry generates a current that is proportional to the target gas abundance.
Their disadvantages include sensor drift and imperfect specificity to target gases. This
represents a significant problem because of the cocktail of gases typically found in a volcanic plume; for example, most commercially available H2S sensors are cross-sensitive to SO2 but because they are mass-manufactured for a wide-range of industrial and consumer applications they are cheap. They have been tested in a number of configurations, and appear capable of reliable SO2 and H2S (and other species) measurements (particularly when combined with, for instance, non-dispersive infrared sensors for CO2 measurement; e.g., Aiuppa et al. 2005a;
Shinohara 2005; De Vito et al. 2007; Witt et al. 2008; Roberts et al. 2011). An important
development is that long-term installations (using Wi-Fi or cell-phone networks, or satellite telemetry) are beginning to provide valuable and near-real time insights into the relationships between surface emissions and magmatic processes (e.g., Aiuppa et al. 2007b, 2010).
Another promising field technique established some while ago, though yet to be more widely used in volcanology, is the portable gas chromatograph (Le Guern et al. 1982; Diaz et al.
2002). Its advantage is its sensitivity and the wide range of species that may be quantified, including H2S and H2.
Ultraviolet spectroscopy
A striking aspect of volcanic emission measurements is the prominence of observations of sulfur dioxide (Oppenheimer 2010). Considering that the most abundant volcanic vapors are water and carbon dioxide and that sulfur species (including hydrogen sulfide) typically account for less than 5 mol% of the gases emitted, it is not immediately obvious why sulfur has been such a focus of study. The reasons are the comparative ease with which SO2 can be measured in the atmosphere and because S is a useful tracer of magmatic processes The former aspect is due to its electronic absorption spectrum which provides a strong fingerprint against the ultraviolet background light in the daytime sky. Ultraviolet sensing using the sky as source eliminates one typical problem with optical spectroscopy—the need for precise alignment of the spectrometer with respect to the light source. All that is necessary is to collimate some sky light through a telescope and direct it into the spectrometer.
The particular importance of ultraviolet sensing of volcanic plumes is that it represents the most straightforward means for estimating degassing rates (which are difficult to measure based on point sampling). The flux of SO2 from a vent or crater can be measured by recording the column density of all the SO2 molecules contained in a (generally though not necessarily) vertical section of the whole plume, and computing the product of the integrated column cross section of SO2 and the plume speed. In practice, the plume may be traversed roughly
perpendicularly to the wind direction while pointing the spectrometer‘s telescope up from the ground, or scanned from a fixed position. Thanks to the diffuse sky ultraviolet source, the pointing direction of the telescope is not critical. Acknowledging the significance of gas flux measurements in volcanic hazard assessment, this subsection will review in greater depth the development and application of ultraviolet remote sensing and spectroscopy in volcanology.
The Correlation Spectrometer (COSPEC).
The first remote sensing instrument to become widely used for volcanic plume monitoring was the Barringer Research ―COSPEC‖, or Correlation Spectrometer (Williams-Jones et al.
2008). The COSPEC was introduced four decades ago to measure industrial SO2 and NO2 sources (Moffat and Millán 1971; Hoff and Millán 1981), but its value for measuring volcanic emissions was quickly recognized (Stoiber and Bratton 1978; Stoiber et al. 1983). Early volcanological interest addressed the question of whether changes in SO2 flux could be associated with magma migration and eruptive style. For instance, Malinconico (1979) reported a positive correlation between increasing SO2 flux and eruptive vigor at Mt. Etna.
The Correlation Spectrometer went on to play a prominent monitoring role during many volcanic crises, crucially helping to discriminate magmatic origins of volcanic unrest. Of particular note, COSPEC played a vital role in civil emergency planning during the unrest of Mt. Pinatubo in 1991. As seismic unrest increased two weeks before the magmatic
denouement, so did the SO2 flux, supporting the view that a substantial magma body was
connecting with the surface. This interpretation prompted the civil evacuation credited with saving tens of thousands of lives (Daag et al. 1996).
COSPEC measurements have also been influential in recognizing the importance of magma convection, permeability and gas separation (e.g., Francis et al. 1993; Kazahaya et al. 1994;
Oppenheimer et al. 2002a). Furthermore, as COSPEC observations were made at more and more volcanoes around the world, the compiled data yielded another important result, namely the first estimates of the global emission of volcanic SO2 (discussed in a later section).
The COSPEC design goal was to build a system capable of minimizing all ―noise‖ (including those due to light absorption and scattering by other atmospheric constituents) in order to measure a single species (e.g., SO2). The result was an instrument that yields an estimate of the quantity of SO2 in the field of view (measured, for instance, in units of mass per unit area of the atmospheric column). While this greatly simplified data retrieval and processing, it made it difficult to assess potential errors arising from wavelength shifts, light scattering and solar-elevation effects, thermal and mechanical distortions, and so on. Also, the COSPEC response depended on the correlation mask used and the abundance of gases present. An alternative approach is to measure wide-band spectra with sufficient spectral resolution to be able to model trace-gas abundances. With the COSPEC long out of production now, a new generation of ultraviolet spectrometers has come to the fore in the realm of volcano
surveillance (Oppenheimer 2010).
Ultraviolet Differential Optical Absorption Spectroscopy (DOAS).
The common approach to recording an ultraviolet spectrum is use of a diffraction grating to disperse the light received by an optical telescope coupled to the spectrometer. Spectra are typically collected using a CCD detector array onto which the dispersed light is focused.
Analysis of the spectra and determination of trace-gas abundances are widely carried out with a methodology known as differential optical absorption spectroscopy, or DOAS (Platt and Stutz 2008). A key approach of DOAS is the removal of fluctuations in the recorded spectrum that result from molecular and aerosol scattering in the atmosphere. Because their spectral dependence is of lower frequency than that associated with the electronic structure of absorbing molecules, appropriate signal processing yields absorption spectra suitable for modeling. Another trick widely used in DOAS practice is to obtain atmospheric spectra with and without the emissions of interest present. In the case of volcanic emissions, this can be achieved by collecting ―background‖ or ―clear sky‖ spectra from either side of the plume.
All the plume spectra are then divided by the out-of-plume background spectrum. This reduces interferences caused by background atmospheric absorption and the solar spectral structure (Fraunhofer lines). Specific gases can be identified by their characteristic absorption spectra, and their abundances derived from the strength of the absorption, following the Beer- Lambert formula:
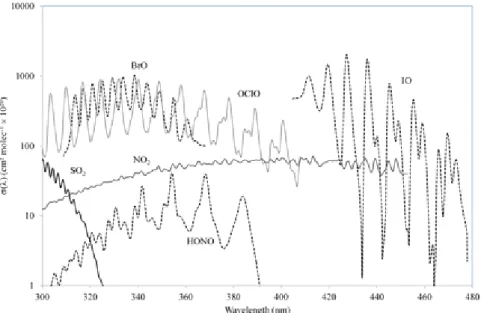
where I( ) is the observed intensity of radiation at wavelength , I0( ) is the original intensity of radiation before interaction with the sample, σ( ) is the absorption cross section of the absorbing molecule at wavelength , and N is the mean concentration of the species over the path-length L of the sample. In general practice, the logarithm of the ratio spectrum is computed, and then SO2 (and other gas species) amounts can be calculated by scaling reference spectra of the gases of interest (obtained
via laboratory experiments: Fig. 7) until they match the observed spectrum. The scaling factors thus identified, along with the known abundances for the reference spectra, determine the gas column amounts in the plume.
Figure 7. : Plots of absorption cross sections in the ultraviolet and visible regions of the spectrum for several gases: SO2, NO2, BrO, HONO, IO and OClO (convolved with a
Gaussian function of 1.21 nm full-width-at-half-maximum). Data courtesy of Vitchko Tsanev (University of Cambridge).
The first volcanological DOAS observations were made in 1992 from a scientific vessel that cruised the Mediterranean downwind of Etna, Stromboli and Vulcano (Edner et al. 1994;
Weibring et al. 1998, 2002). A bulky ultraviolet spectrometer was employed, and it was operated alongside a COSPEC and a lidar (light detection and ranging) system that was also capable of SO2 measurements (see below). At that time, COSPEC represented the state of the art for remote geochemical surveillance of volcanoes, and its pre-eminence was not
challenged by the expensive and more operationally complex DOAS and laser-based instruments. But this picture changed in early in the 2000s owing to the commercial availability of ultraviolet spectrometers built around low-cost CCD detectors and mass- produced optical benches. They were cheaper, smaller and less power consumptive than anything else on the market and could be controlled via USB connection to a portable computer.
The first volcanological measurements with this new generation of spectrometer were made at Masaya (Nicaragua) in 2001 (McGonigle et al. 2002; Galle et al. 2003). Several competing spectrometers are now available (Kantzas et al. 2009), and there has been tremendous
innovation in the application of the new technology as volcanologists have been quick to seize on the potential of such cheap, adaptable and capable devices. One of the first tasks required was to confirm good agreement between DOAS-based estimates of SO2 emissions and those obtained by COSPEC. This was particularly important for volcano observatories switching to the new technology (Elias et al. 2006). The next development was the more imaginative deployment of the miniature ultraviolet spectrometers (Fig. 8). Observational platforms for traverse-style measurements have included pedestrians (McGonigle et al. 2002; Mori et al.
2006), fixed-wing aircraft, helicopters and ultra-light aircraft (Grutter et al. 2008) and a remote-controlled helicopter (McGonigle et al. 2008).
Figure 8. : Photographs of portable ultraviolet and infrared sensing systems for plume measurements: (a) INGV-Catania‘s Mini-COSPEC in operation on Mt. Etna; (b) compact ultraviolet spectrometer set up for walking traverses on Erta ‗Ale volcano (the spectrometer is near the laptop‘s keyboard; (c) one of the first scanning systems for ultraviolet sensing of SO2
emissions, in use on Stromboli; (d) FTIR spectrometer during measurements on Erebus volcano, Antarctica.
With respect to gas-flux measurements, considerable attention has to be given to the estimation of plume transport speeds. It is widely acknowledged that uncertainty in plume speed (typically a few tens of %) dominates errors in measurements of SO2 and other gas fluxes. A consistent approach to constraining plume speed is therefore essential. Absorption- correlation methods using spatially distributed instruments (McGonigle et al. 2005; Williams- Jones et al. 2006) or a multi-beam instrument (e.g., Johansson et al. 2009b; Boichu et al.
2010) are arguably the most rigorous means to record plume velocity accurately (see below).
By virtue of recording spectra, broadband UV spectroscopy has the capability of detecting multiple gas species. Measurements of H2S/SO2 ratios have been accomplished at Vulcano, Italy, using a compact ultraviolet spectrometer and an ultraviolet lamp (O‘Dwyer et al. 2003; Aiuppa et al. 2005a). The use of an artificial source along with comparatively short path- lengths is required because the H2S-absorption feature is in the shorter-wavelength region of the ultraviolet spectrum that is not transmitted over long paths in the atmosphere. Another
species that can be measured by DOAS in the ultraviolet region (but at longer wavelengths) is BrO. This species is of significance for its impact on atmospheric ozone and measured
SO2/BrO ratios combined with SO2 flux estimates for a number of volcanic plumes worldwide are beginning to provide a picture of the regional and global importance of volcanogenic reactive bromine emissions (Oppenheimer et al. 2006; Bobrowski and Platt 2007; Bobrowski et al. 2007; Bani et al. 2009; Boichu et al. 2011).
Operational surveillance.
The sustained surveillance carried out by volcano observatories demands a high degree of automation of monitoring systems. This saves the time and expense of repeated fieldwork;
enables networks of sensors to be developed; protects staff from prolonged exposure in hazardous areas; and permits more time to be spent on data analysis, synthesis and interpretation. The low power requirements and cost of the new generation of ultraviolet spectrometers have spurred development of autonomous SO2 monitoring stations. However, to measure SO2-degassing rates, fixed installations must mimic the traverse method of flux estimation by scanning the sky sequentially in a plane that intersects the plume. This can be readily achieved by rotating the field of view of the spectrometer around the sky by use of a stepper motor to which a plane mirror is attached. Combined with a telemetry system and powered by solar energy, such a station may operate autonomously, transmitting spectra back to the volcano observatory. The first scanner development applied to volcanic-plume
measurements was reported by McGonigle et al. (2002, 2003). This was a portable system designed for rapid, campaign installation, but it was soon superseded by Montserrat Volcano Observatory‘s autonomous ultraviolet DOAS stations (Edmonds et al. 2003a). Subsequently, scanner networks were installed at Tungurahua volcano, Ecuador (Arellano et al. 2008), Stromboli (Burton et al. 2009) and Etna (Salerno et al. 2009a,b). Two European projects (DORSIVA and NOVAC; www.novac-project.eu/) have taken this concept even further through the development of a scanning system that has now been installed at seventeen volcanoes worldwide (Galle et al. 2010).
One complication in obtaining a flux measurement with a scanning instrument is that uncertainty in the plume height corresponds directly to uncertainty in the flux estimation.
Since the measurements are made radially within a plane that intersects the plume, the
measurement from a single instrument cannot discriminate between a high, wide plume and a low, narrow plume (with correspondingly lower SO2 flux), even if the two have identical SO2
mixing ratios and thicknesses. Thus, plume height must be determined accurately if the scanner is to yield a reliable measurement of flux. This can be achieved crudely through simple scaling between wind speed and plume height, through more sophisticated dispersion modeling, or, ideally, from the observations themselves. Arguably the most robust procedure is the tomographic reconstruction of the plume‘s SO2 cross section, demonstrated by Wright et al. (2008), Kazahaya et al. (2008) and Johansson et al. (2009a). Nevertheless, tomographic approaches rely on assumptions about distribution of SO2 in the cross section, and are
computationally costly to implement.
A further important benefit of scanning systems is their capability for rapid flux
measurements. In practice, plume scans may be made within a few minutes, providing a high time resolution. This can reveal rapid variability in source emissions, which might, for instance, relate to fluctuating magma flow to the surface. When two-dimensional CCD
detectors are used (one dimension representing the spectral information), it is possible to build an image with a scanning system, yielding valuable information on gas distribution within a