HAL Id: hal-00804345
https://hal.archives-ouvertes.fr/hal-00804345
Submitted on 25 Mar 2013
HAL is a multi-disciplinary open access archive for the deposit and dissemination of sci- entific research documents, whether they are pub- lished or not. The documents may come from teaching and research institutions in France or abroad, or from public or private research centers.
L’archive ouverte pluridisciplinaire HAL, est destinée au dépôt et à la diffusion de documents scientifiques de niveau recherche, publiés ou non, émanant des établissements d’enseignement et de recherche français ou étrangers, des laboratoires publics ou privés.
Volumetric analysis of medial temporal lobe structures in brain development from childhood to adolescence.
Shiyan Hu, Jens C Pruessner, Pierrick Coupé, D Louis Collins
To cite this version:
Shiyan Hu, Jens C Pruessner, Pierrick Coupé, D Louis Collins. Volumetric analysis of medial temporal lobe structures in brain development from childhood to adolescence.. NeuroImage, Elsevier, 2013, 74C, pp.276-287. �10.1016/j.neuroimage.2013.02.032�. �hal-00804345�
Volumetric Analysis of Medial Temporal Lobe Structures in Brain Development from Childhood to Adolescence
Shiyan Hua,∗, Jens C. Pruessnera,b, Pierrick Coup´ec, and D. Louis Collinsa
aMcConnell Brain Imaging Centre, Montreal Neurological Institute, McGill University, Montreal, Canada
bMcGill Centre for Studies in Aging, Faculty of Medicine, McGill University, Montreal, Canada
c LaBRI CNRS, UMR 5800 Universit´e, Bordeaux, France
Abstract
Puberty is an important stage of development as a child’s sexual and physical characteristics mature because of hormonal changes. To better understand puberty-related effects on brain de- velopment, we investigated the magnetic resonance imaging (MRI) data of 306 subjects from 4 to 18 years of age. Subjects were grouped into before and during puberty groups according to their sexual maturity levels measured by the puberty scores. An appearance model-based automatic segmentation method with patch-based local refinement was employed to segment the MRI data and extract the volumes of medial temporal lobe (MTL) structures including the amygdala (AG), the hippocampus (HC), the entorhinal/perirhinal cortex (EPC), and the parahippocampal cortex (PHC). Our analysis showed age-related volumetric changes for the AG, HC, right EPC, and left PHC but only before puberty. After onset of puberty, these volumetric changes then correlate more with sexual maturity level, as measured by the puberty score. When normalized for brain volume, the volumes of the right HC decrease for boys; the volumes of the left HC increase for girls; and the volumes of the left and right PHC decrease for boys. These findings suggest that the rising levels of testosterone in boys and estrogen in girls might have opposite effects, especially for the HC and the PHC. Our findings on sex-specific and sexual maturity-related volumes may be useful in better understanding the MTL developmental differences and related learning, memory, and emotion differences between boys and girls during puberty.
Keywords: Puberty, Medial temporal lobe structures, Volumetric change, Puberty score, and Sex-maturity.
(a) (b) (c) (d)
Figure 1: MR images of children brains from 4 to 18 years old. (a) 4 years old, (b) 8 years old, (c) 12 years old, and (d) 18 years old.
1 Introduction
Recent studies have shown that the human brain tends to develop in waves with different parts of the brain developing at different times rather than the entire brain growing at an even pace (Thompson et al., 2000; Gogtay et al., 2004). In particular, at birth, the human brain has developed more than 100 billion neurons, and has reached 25% of the adult brain size. In the first 6 years after birth, the brain grows very quickly, reaching 80% of the adult size at the age of two, 90% by the age of four, and almost 100% around the age of six (Dekaban, 1978; Pfefferbaum et al., 1994). After that, the overall brain size does not increase significantly but the connections or synapses between neurons are continuously developing to form a complex network of neuronal pathways (Paus et al., 1999).
Because of such continuous development, the tissues and structures inside the brain, such as the gray matter (GM), white matter (WM), and cerebrospinal fluid (CSF), demonstrate gradual volumetric changes. These changes can be analyzed and characterized on magnetic resonance (MR) images. As an illustration, Fig. 1 shows MR images of the brains of four subjects aged 4, 8, 12, and 18, from which we can see that as age increases, the T1-weighted (T1w) contrast between the gray matter and white matter increases. Age-related change in the gray matter and white matter have been reported by many researchers (e.g., Jernigan et al., 1991; Filipek et al., 1994). Furthermore, recent studies have suggested that brain development is regionally specific and that some regions may demonstrate sex-specific development patterns (Sowell et al., 1999, 2004b; Blanton et al., 2004; Witte et al., 2010;
Bellis et al., 2011). In addition, several large scale longitudinal studies have focused on characterizing the growth pattern of cortical areas in children (Giedd et al., 1999; Sowell et al., 2004a). Thus, it is of interest to characterize brain development at a local structure level.
Of human brain structures, medial temporal lobes are an important part of the limbic system responsible for learning, memory, and emotion (Barense et al., 2005; Baxter, 2009). Located at the mesial wall of the temporal lobe, they consist of several inter-connected structures that include the temporal pole, the hippocampus (HC), the amygdala (AG), and three surrounding cortical areas, namely the entorhinal cortex (ERC), the perirhinal cortex (PRC), and the parahippocampal cortex (PHC) (e.g., Pruessner et al., 2000, 2002; Squire et al., 2004). Among them, the HC is the most studied component of the MTL memory system and is a main contributor to the memory-related information acquisition and spatial navigation; the AG is heavily involved in emotional and social processing, such as feeling of fear and anxiety; the ERC is the main interface between the HC and the neocortex and contributes to the formation and optimization of spatial memories; the PRC participates in visual perception and memory, while the PHC is engaged in scene recognition and social context.
Neurodegenerative changes in MTL structures have been closely associated with specific brain disorders (Mori et al., 1997). Volumetric changes in the HC and ERC are important markers of early stages of Alzheimer’s disease, and temporal lobe epilepsy (Wang et al., 2005; D¨uzel et al., 2006; Coup´e et al., 2012). Larger AG volumes are associated with depression (Zetzche et al., 2006), and have been found in anxiety disorders as well.
Such findings have intrigued and motivated researchers to quantitatively analyze, using magnetic resonance imaging (MRI) and structure segmentation techniques, the MTL structures from imaging data to characterize shape and volumetric changes, ultimately to help early diagnosis of neurological diseases, locate the pathological changes for brain disorders, monitor disease progression, and evaluate efficacy of drug treatments. Studies have further revealed that volumetric changes of MTL structures may have different characteristics before and during puberty, due to the rapid pace of inter-neuron connection and synapse development as a child’s sexual and physical characteristics mature because of hormonal changes (Giedd et al., 1997, 2006; Bramen et al., 2011). Certain hormones are believed to induce the formation of new synapses (McEwen et al., 2001; Kretz et al., 2004). One example is estrogen, whose concentrations increase dramatically with the onset of puberty, and which has been shown to be linked with increased dendritic branching of neurons rich in estrogen receptors (Liu et al., 2008; Woolley et al., 1990). Due to the high densities of estrogen/androgen steroid hormone receptors especially in the HC and AG, we hypothesized to find puberty-related changes particularly in these MTL structures (Loy et al., 1988). In the meantime, the rapid maturation process of MTL structures also faces increasing risks to developmental disorders during adolescence when there are dramatic physical, emotional, and social changes, associated with the potential onset of many neurological
diseases and psychiatric disorders such as depression, physical abuse, and schizophrenia (Lewinsohn et al., 1994; Pelcovitz et al., 2000; Harrop and Trower, 2001). In this context, analysis of brain structure volumetric changes before and during puberty may help understand part of the complex development of MTL structures.
There has been much research work on studying the volumetric changes of MTL structures of children. In particular, Giedd et al. (1997, 1999, 2006) found a linear increase of white matter over age and an inverted “u” shape for the developmental trajectory of cortical gray matter for children from 4 to 18 years old. In addition, they also documented the volumetric changes for certain MTL structures. Specifically, the AG and HC volumes were found increased with age for both boys and girls, but the AG volume increased faster for boys than girls while the HC volume increased faster for girls than boys. Age-related increase of the hippocampus and amygdala volumes from young children to young adults were also reported by Sowell and Jernigan (1998) and Suzuki et al. (2005). Apart from age-related differences, the sex-specific differences on volumes of temporal-limbic and frontal regions in young healthy adults were observed by Gur et al. (2002). A recent study (Neufang et al., 2009) indicated that the gray matter development in certain brain regions coupled with sexual maturation and puberty hormones might have organizational effects on brain development. Sex differences were also found associated with medial temporal lobes and cortical gray matter, a region that has high sex steroid hormone receptor densities (Simerly et al., 1990), based on a study of 80 adolescent boys and girls from Bramen et al. (2011). They further reported that the puberty-related maturation of three structures: the HC, the AG, and cortical gray matter were different for boys and girls and the volumetric changes of these three structures for sexually mature adolescents demonstrated a sex- specific difference: larger volumes for more sexually mature boys as compared with smaller volumes for sexually mature girls. Another study from Witte et al. (2010) showed that in young adulthood, sex hormones had organizational effects on regional gray matter, resulting in functional diversities and congruence between female and male brains. It has been found that sex-specific hormonal changes may further moderate the redistribution of cerebral functions. For example, a functional MRI study on the redistribution of cerebral functions from Killgore et al. (2001) with 19 children and adolescents found there was a sex-specific difference in the patterns of amygdala and prefrontal activation during adolescent maturation when stimulated with photographs of faces expressing fear. Apart from the studies on healthy young adults, there are also studies on young patient populations. For example, Jacobsen et al. (1998) studied ten adolescent patients and reported volume reductions of medial temporal lobe structures correlated with ongoing illness in childhood-onset schizophrenia. Mattai
et al. (2011) found significant volumetric or trajectory differences in hippocampus between childhood- onset schizophrenia patients and healthy subjects. However, to the best of our knowledge, while many studies have focused on the HC and AG, no studies have analyzed the developmental changes of these structures together with the ERC, PRC, and PHC, before and after puberty.
In this paper, we investigated the volumetric changes of individual structures of medial temporal lobes before and during puberty. The motivation for our study was to analyze the effect of physical and sexual maturity on the development of medial temporal lobes. Unfortunately, research evidence on structures other than the HC and AG is sparse possibly because of the complexity and time required to manually segment structures of the parahippocampal gyrus, in the absence of automated techniques.
In our study, a dataset with 306 subjects from 4 to 18 years old (Evans and the Brain Development Cooperative Group, 2006) was considered, and a two-stage segmentation method (Hu et al., 2011b) was employed to automatically segment medial temporal lobe structures from the dataset. Our findings can help us better understand the sex-specific and sexual maturity-related MTL structure developmental differences and these developmental differences might be useful to investigate cognitive and behavioral differences that start occurring between boys and girls during puberty.
2 Material and method
2.1 Subjects selection and MR imaging protocol
The MRI dataset used in our study comes from the MRI study of normal brain development, sponsored by the National Institutes of Health (Evans and the Brain Development Cooperative Group, 2006;
Waber et al., 2007). This dataset is known locally as the NIH Pediatric Database, or NIHPD project.
The entire dataset is divided into two subsets: The first subset, also known as Objective 1, is for children from 4 to 18 years old, while the second subset, also known as Objective 2, is for children from birth to 4 years old at the time of recruitment (Evans and the Brain Development Cooperative Group, 2006; Waber et al., 2007). In our study, we chose to analyze Objective 1 data only for these considerations: (a) the datasets Objective 1 and Objective 2 use different MR imaging protocols and neuropsychological test batteries, (b) the difference in intensity contrast between those two datasets is large, and (c) we are interested in studying the impact of puberty on brain development. This dataset, i.e., Objective 1, has been recently analyzed by the Brain Development Cooperative Group (2012) and their study reported total and regional gray matter (GM) volume, white matter (WM) volume, and cerebrospinal fluid (CSF) volume. In this study, we chose to concentrate on the MTL structures of
Objective 1 data, to study the effects of puberty on their development. Further, it has been argued that volume decreases of parahippocampal gyrus, and in particular its substructures ERC and PRC, may be an important marker of neurodegeneration and dementia late in life (Xu et al., 2000), but few papers have been published on the ERC, PRC and PHC, possibly because of the complexity in segmenting these structures. Since there is an important gender difference in the incidence of dementia, it is possible that volumetric changes have their origin during puberty, and thus we argue that it is of interest to characterize these patterns early in life.
The healthy children included in this study were selected after careful screening on medical, neu- rological, genetic, and psychiatric conditions that might affect brain development. In particular, all children in Objective 1 were screened by phone interview and on-site evaluation using a standard neu- ropsychlogical assessment including performance based testing and questionnaires to cover intellectual level, language, visuospatial function, memory, executive function, academic skills, and psychologi- cal adjustment (Evans and the Brain Development Cooperative Group, 2006; Waber et al., 2007).
Information related to sexual development for these children were also evaluated using the pubertal development scale (PDS) (Petersen et al., 1988), and recorded as the puberty score. PDS has been found to be both reliable and valid in ascertaining pubertal status for subjects (Petersen et al., 1988).
The puberty score is a self-rating scale based on the pubertal development scale questionnaire (Petersen et al., 1988). The questionnaire uses the growth of secondary sex characteristics like pubic hair, skin change, growth spurt, girls menstruation, girls breast growth or boys voice change, as a puberty index to assess the physical and sexual maturity of each child. Each questionnaire has five questions and the score for each question, except for girls menstruation, ranges from 1 to 4. Girls menstruation was accessed by a binary value (“NO” or “YES”). In this study, “NO” was assigned to “1”, and “YES” was assigned to “4”. In order to compute puberty level through one variable that could be implemented across all subjects in the analysis, we decided to average the scores across all questions to arrive at a continuous variable for quantification of pubertal status. Note that not all children were given this pubertal development test. In particular, children under the age of 10 were examined by a neurologist to determine if a pubertal development test was needed. If it was not needed, the puberty score 1 was assigned for those children. Otherwise, those children, together with children above the age of 10, were given this pubertal development test with the assistance of a neurologist and parents. In this study, 64 out of 133 children under the age of 10 were determined to not need a pubertal development test after being examined by a neurologist, and they were assigned the minimal value of 1 for the regression analyses presented here.
The MRI data were collected from six pediatric study centers across the United States using 1.5T Siemens or GE scanners. The MR images were acquired using a uniform MRI primary or fallback protocol. Three types of MR images, namely, T1-, T2-, and PD-weighted MRI images were generated.
In the Objective 1 primary protocol, the T1-weighted scan was acquired with 3D RF-spoiled gradient- echo acquisition with TR=22 - 25ms, TE=10 - 11ms, flip angle=30o, and a resolution of 1mm3 voxels;
while the PD/T2 scan was a fast/turbo spin echo sequence with TR=3500ms, TE=15 - 17ms, 105 - 119ms, flip angle = 90o, and a resolution of 2×1×1mm3 voxels. Both scans were acquired with sagittal volume excitation. Subjects that were unable to remain still for the primary protocol were scanned with a faster fallback protocol that was based on 3mm thick axial multi-slice acquisitions. As the two acquisitions are very different, only data acquired with the primary protocol will be analyzed here.
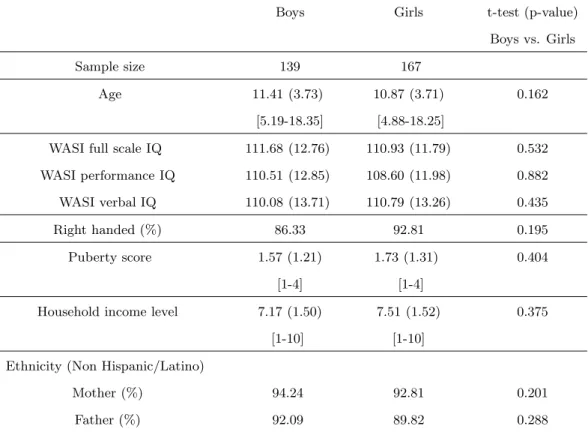
A total of 430 children were enrolled in Objective 1. Among them, MRI data was acquired on 336 subjects with the primary protocol. Of these, one subject missed sex information, 12 subjects did not have puberty information, and 17 subjects missed intra-cranial cavity volumes (ICC). Thus, MRI data of 306 subjects are used in our study. The characteristics of these 306 children and adolescents are presented in Table. 1. There were no significant group differences between boys and girls on the sample size, average age, handedness, average puberty score, average IQ, average household income level, and ethnicity.
2.2 Segmentation method
A two-stage segmentation method, i.e., the appearance model-based method with patch-based local refinement (Hu et al., 2011b), was used to segment each of individual medial temporal lobe structures (AG, HC, EPC=ERC+PRC, PHC) from T1-weighted MR images. Here, EPC stands for entorhi- nal/perirhinal cortex and it is a structural combination of the ERC and PRC, which were jointly segmented by the automatic segmentation approach due to the fact that there was no clear intensity boundary between them in MR images. First, this segmentation method uses an active appearance modeling as the first stage to capture the global shape of the structure (Hu and Collins, 2007; Hu et al., 2011a) and identify an initial structure border. Then, a nonlocal patch-based segmentation method (Coup´e et al., 2011) is applied to locally refine the segmentation along the identified initial structure border. The combination of the appearance modeling and non-local means techniques takes advantage of the global shape constraints derived from the first stage appearance modeling and the local intensity properties analyzed by the second-stage. The two-stage segmentation method is summarized below.
Table 1: Characteristics of healthy MRI subjects (N=306)
Boys Girls t-test (p-value)
Boys vs. Girls
Sample size 139 167
Age 11.41 (3.73) 10.87 (3.71) 0.162
[5.19-18.35] [4.88-18.25]
WASI full scale IQ 111.68 (12.76) 110.93 (11.79) 0.532 WASI performance IQ 110.51 (12.85) 108.60 (11.98) 0.882
WASI verbal IQ 110.08 (13.71) 110.79 (13.26) 0.435
Right handed (%) 86.33 92.81 0.195
Puberty score 1.57 (1.21) 1.73 (1.31) 0.404
[1-4] [1-4]
Household income level 7.17 (1.50) 7.51 (1.52) 0.375
[1-10] [1-10]
Ethnicity (Non Hispanic/Latino)
Mother (%) 94.24 92.81 0.201
Father (%) 92.09 89.82 0.288
Notes: mean values followed by their associated standard deviations in ( ); data range in [ ].
1. First-stage: Appearance Model-based Global Segmentation. In the first stage segmentation, principle component analysis (PCA) is applied to the gray-scale MR images and shape data to capture the statistical variations of the intensity and shape information in the training data so that a set of eigen-vectors which includes both shape and intensity information can be derived and used in a form of linear combination to represent the shape and gray images (Hu and Collins, 2007; Hu et al., 2011a). In a mathematical model, we have,
φ = φ¯+PφQsw¯−1s c
gt1 = g¯t1+Pg,t1Qg,t1c (1) where ¯φ is the mean of the signed distance functions of the training shapes, ¯gt1 is the mean gray intensity of the normalized T1-weighted training images,Pφand Pg,t1 are the eigenvectors derived from the training shapes and gray intensity images, respectively, Qs and Qg,t1 are the appearance eigenvectors used to join the shape and intensity models together, and ws is the difference in units between the shape and intensity models and can be estimated from the ratio of standard deviation between the shape and intensity level parameters. c is a set of linear combination weight coefficients.
For each training shape image and its associated gray training image, there is a corresponding set of coefficients c. Now, for a given test image It1, one can also find its corresponding c by minimizing the squared intensity difference between the test image It1 and a synthesized image gt1, expressed as a function of c given by Eq. 1. With the weight coefficients c found from the minimization process, a global level set distance φ can be formed following Eq. 1, from which an initial structure border can be found. More details on PCA and coefficients optimization can be found in our previous work (Hu and Collins, 2007) and are not repeated here.
It is noteworthy to mention however that to increase the similarity of images between subjects and to minimize the differences due to head size, orientation, and position, both training and test MR images are linearly and then nonlinearly registered (Collins and Evans, 1997) to an unbiased nonlinear average template, i.e., the ICBM152 2009c nonlinear asymmetric 1×1×1 mm template (Fonov et al., 2011), within the volume of interest surrounding the MTL structures.
2. Second-stage: Nonlocal Means Patch-based Local Refinement. In the second-stage, the concept of nonlocal means patch-based segmentation (Coup´e et al., 2011) is adopted for local refinement.
However, the local refinement is limited to the voxels along the identified initial structure border,
also called the local correction area, from the first stage. Basically, given the first-stage segmen- tation outputφ, voxels within the distance ranged1 ≤φ≤d2 are identified, whered1 andd2 are two thresholds. For each identified voxel, a test patch centered at the identified voxel is formed and then training patches from training images with intensity close to the test patch are selected and their associated distances are weighted to estimate a local structure label. Mathematically, the weighted distanceφ(xi) for voxel xi of interest is given by
φ(xi) = PN
s=1
P
j∈viw(xi, xs,j)φs,j PN
s=1
P
j∈viw(xi, xs,j) (2)
where N is a number of training patches, vi is a user-configured search area around voxel xi, w(xi, xs,j) is a weight assigned to the center voxel xs,j of a pre-selected training patch with distance φs,j.
The weight for each training patch is defined as a value related to the intensity distance between the test patch and the training patch, i.e.,
w(xi, xs,j) =e
−kp(xi)−p(xs,j)k2 2
h2 (3)
wherep(xi) is the cubic patch centered atxiin the test image,p(xs,j) is the cubic patch centered at xj in the s-th training subject image, and||.||2 is the normalized intensity distance between two patches. Details can be found in the papers from Hu et al. (2011b, 2012) and Coup´e et al.
(2011), and are omitted here.
2.3 Training data
The training data used in the segmentation is a subset of the 152 datasets from the Montreal cohort of the International Consortium for Brain Mapping (ICBM) database (Mazziotta et al., 2001). The subset of MRI data (Philips 1.5T gyroscan, TE=10ms, TR=30ms, angle=30o, 1mm3 isotropic voxels) contains 54 healthy young adults from 18 to 35 years old. The medial temporal lobe structures (HC, AG, ERC, PRC, PHC) of these 54 subjects were manually segmented using the protocol defined by Pruessner et al. (2000, 2002). The inter- and intra-rater variation of the manual labels were evaluated by intra-class correlations (Shrout and Fleiss, 1979). The inter-rater correlation was 0.86-0.94 for HC, 0.83-0.84 for AG, 0.93-0.95 for ERC, 0.9-0.92 for PRC, and 0.88-0.9 for PHC, while the intra-rater correlation was 0.91-0.94 for HC, 0.91-0.95 for AG, 0.91-0.96 for ERC, 0.92-0.94 for PRC, and 0.91- 0.93 for PHC. Although this training dataset only includes MRI data of young healthy adults, it still covers a large range of MTL structure volumes. For example, the hippocampal volumes range from
2.2cc to 4.2cc in the ICBM cohort. With such a big variation, this training dataset is able to properly segment MTL structures from the pediatric MRI data under study.
2.4 Statistical analysis
JMP software (Sall et al., 2005) was used for all statistical analyses. The ANalysis of COVAriance (ANCOVA) model was used to analyze medial temporal lobe structure volumes for all subjects, with age, sex, and sex-maturity level (puberty score) as co-variates. The sex-specific effects on medial temporal lobe structure volumes were analyzed with an ANalysis Of VAriance (ANOVA) between groups. In all experiments, ap value of 0.05 was used as the threshold for significance.
2.5 Parameter settings
For all experiments, the segmentation was based on T1-weighted MR images using the appearance modeling followed by patch-based local refinement as described above. The first-stage appearance modeling was built on 54 training subjects and the patch-based refinement used the best 30 out of 54 training subjects. The best 30 training subjects were selected by using the sum of the squared intensity difference (SSD) between a test subject and a training subject, i.e. the closest 30 subjects with smaller SSDs were selected from the 54 training subjects and used as templates in the local refinement stage.
The local correction areavi used in the second stage was set tovi={xi| −2.5≤φ(xi)≤2.5}, where φ(xi) denotes the level-set distance for voxelxi from the first-stage appearance modeling.
3 Results
The proposed two-stage segmentation algorithm was applied to automatically segment both left and right side of the AG, HC, EPC, and PHC. This method was fully validated for MTL structure segmen- tation using the ICBM database (Mazziotta et al., 2001) and the segmentation accuracy was evaluated by the Dice kappa for overlap ratio, and the ICC value for volume difference between the automatic results and corresponding manual labels. The detailed analysis and results could be found in our pre- vious paper (Hu et al., 2012). The automatically segmented MTL structures (HC, AG, EPC, PHC) were used in the following analysis to characterize the volumetric changes and their relationship with age, sex, and sexual maturity. Note that, in the automatic segmentation, the ERC and PRC were jointly segmented due to the fact that there was no clear intensity boundary between them in MR images and those two structures are referred to as entorhinal/perirhinal cortex (EPC) here.
3.1 Volumetric changes against age
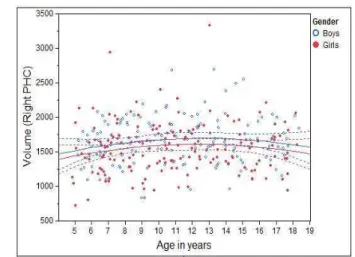
We first looked at the volumetric changes of MTL structures against age. To reflect the true volumes of each individual structure, un-normalized structure volumes, i.e., native volumes, were used in the analysis. Individual volumes and best-fitting cross-sectional age curves for the AG, HC, EPC, and PHC are plotted against age ranging from 4 to 18 years old in Figs. 2 - 5 for MTL structure AG, HC, EPC, and PHC, respectively. Volumes for both left and right individual structures are plotted.
The fitting curves are in solid lines while corresponding curves for confidence interval of 95% are in dashed lines. Note that there is a high variability in each individual structure volume even though the dataset under analysis was derived from a well-screened group of healthy children. To deal with the variability and the non-linear nature of the developmental data for MTL structures, a quadratic regression analysis on volume and age was carried out using this fitting model:
volume =b0+b1·age +b2·age2+ error (4) where b0,b1, and b2 are polynomial parameters to be found, and error is for the residual error of the modeling. The regression analysis was done independently for boys and girls. From the results in these figures, the following can be observed,
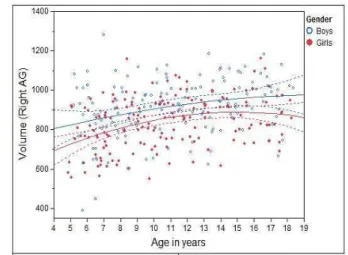
• AG: In the left hemisphere, we see an almost linear AG volume increase as age increases for boys but a quadratic relation between AG volume and age for girls. For the right AG, however, a quadratic relation between volume and age is seen for both boys and girls except that the quadratic curve for girls is slightly stronger, with smaller AG volumes both at the youngest and oldest ages. In all cases, with p <0.0001, age is a strong factor to predict volume. As shown later, sex is also a significant factor to predict volume. Note that for both left and right AG, the volumes for girls reach their peak around 14 years of age and decrease slightly after that. This is not the case for boys as their volumes keep increasing for both the left and right AG but the increase of the right AG appears to slow after 12 years of age.
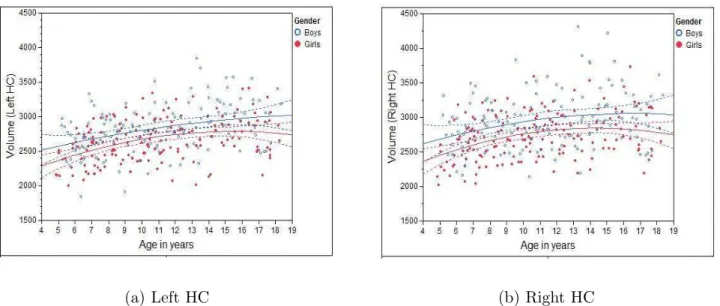
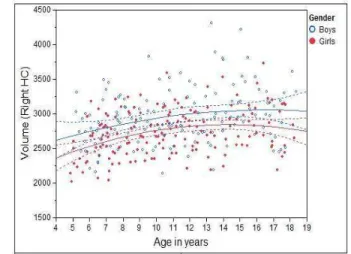
• HC: For both girls and boys, and left and right HC, a quadratic relation between volume and age was found. Again, in all cases, the volume increase with age is statistically significantp <0.0001.
It is worth pointing out that the volumetric growth pattern on the HC of girls before age=10 has been found to parallel that of boys for both the left and right HC. However, there is a noticeable volumetric difference between boys and girls, indicating sex is still a significant factor to predict volume (see below).
(a) Left AG (b) Right AG
Figure 2: Individual volumes and best-fitting cross-sectional age curves for the AG versus age from 4 to 18 years old (volume in native space and in units of 1mm3).
• EPC: For boys, there is almost no volumetric change observed for the left EPC and right EPC (p > 0.8). For girls, a clear quadratic relation between volume and age is seen (p < 0.005).
Similarly as observed for girls in the AG and HC, the quadratic regression seems to indicate a maximum volume around 14 years of age.
• PHC: For both the left and right PHC, there is almost no volumetric change as age increases for either boys or girls (p >0.23).
From the results, we can also see that the structure volumes for boys are larger than those for girls but the difference varies between the AG, HC, EPC, and PHC. Taken together, age-related volumetric changes can be observed with statistical significance for boys and girls at the left and right AG, the left and right HC, and for girls only at the left and right EPC.
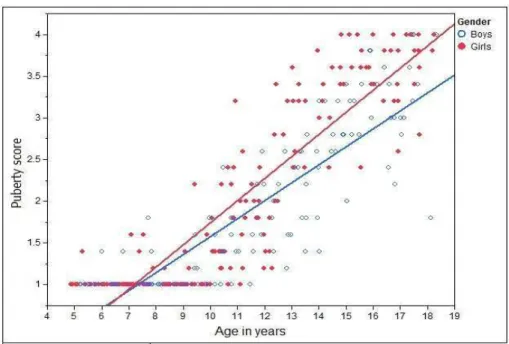
3.2 Puberty score
For the results presented earlier, we looked at the subjects over the full age range from 4 to 18 years old. The averaged puberty scores versus age from the dataset under study are plotted in Fig. 6, where we can see (a) puberty scores are positively correlated with age (p <0.0001 for girls andp <0.0001 for boys); and (b) girls have a stronger slope and progress faster than boys in this dataset, suggesting that girls enter puberty earlier than boys. The age difference for boys and girls entering puberty is
(a) Left HC (b) Right HC
Figure 3: Individual volumes and best-fitting cross-sectional age curves for the HC versus age from 4 to 18 years old (volume in native space and in units of 1mm3).
(a) Left EPC (b) Right EPC
Figure 4: Individual volumes and best-fitting cross-sectional age curves for the EPC versus age from 4 to 18 years old (volume in native space and in units of 1mm3).
(a) Left PHC (b) Right PHC
Figure 5: Individual volumes and best-fitting cross-sectional age curves for the PHC versus age from 4 to 18 years old (volume in native space and in units of 1mm3).
around one and half years, and this age difference is statistically significant (p <0.001).
Realizing that the brain development can reach its most rapid pace during puberty, we partitioned the subjects into two groups: one for all subjects before onset of puberty (‘before’ puberty), and the second after the onset of puberty (‘during’ puberty), to focus analysis on brain development as a function of puberty. As boys and girls may enter puberty at different ages, a sexual maturity measure, namely the puberty score, is employed to assess the physical and sexual maturity of each subject and determine group membership.
Note that a 4-point scale to measure pubertal development is defined as (Petersen et al., 1988):
Score 1 - no development; Score 2 - beginning development; Score 3 - additional development; and Score 4 - development completed. In our analysis below, we chose a puberty score of 2 as the start of puberty and used a binary mapping to separate the ensemble (the whole dataset under analysis) into before and during puberty groups as follows,
• Girls: puberty=1 if a girl starts menstruation or the average puberty score ≥2.0. Otherwise, puberty=0.
• Boys: puberty=1 if a boy’s average puberty score ≥2.0. Otherwise, puberty=0.
Figure 6: Sexual maturity in terms of average puberty score versus age.
3.3 Age, sex, and puberty score on native volumes
As shown previously in Fig. 2 - 4, the volumes of the AG and HC for both boys and girls and the volumes of the EPC for girls were observed to have a strong correlation with age. Here, we examined a hypothetical use of age, sex, and averaged puberty score to predict volume. Native volumes were still used in the analysis. A simultaneous multiple regression analysis was performed using the following model,
volume =a+b·age +c·sex +d·puberty score + error (5) wherea,b,c, and dare parameters to be found in the regression analysis.
This model was first applied to analyze the subjects over the full age group and then applied to analyze the subjects in before and during puberty groups. The statistical significance index values p for individual MTL structures were recorded.
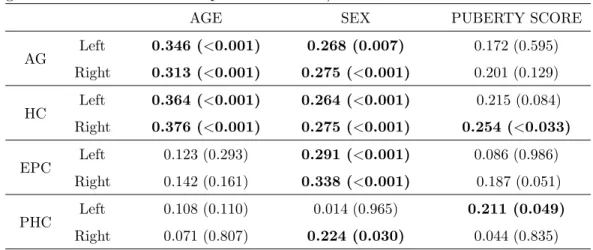
The pvalues resulted from the analysis on whole data (across the full age group) are tabulated in Table 2. We can see,
• AG: Age and sex effects are significant for both left and right side (p <0.001), but the averaged puberty score does not have a significant effect (p > 0.1). As shown earlier in Fig. 2, the AG increases with age, and is larger in boys.
• HC: Age and sex effects are significant for both left and right side (p < 0.001). The averaged
puberty score is only significant for the right side (r = 0.254, p= 0.033), but not for the left side (r = 0.214, p = 0.084). As shown earlier in Fig. 3, the HC increases with age, and is larger in boys.
• EPC: Sex effect is significant for both left and right side. Age and averaged puberty score do not show significant effects. The EPC is larger in boys as shown in Fig. 4.
• PHC: On the left side, age and sex have no significant effects but the averaged puberty score shows a significant effect (r= 0.204, p = 0.049); The left PHC increases with age, and is larger in boys (see Fig. 5). On the right side, sex shows a significant effect (r= 0.224, p= 0.030). The right PHC is larger in boys, but its size is not significantly correlated with age.
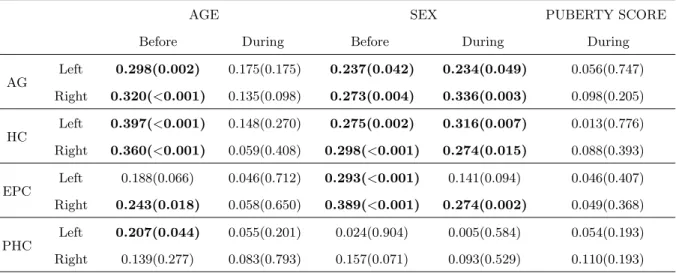
Now we ask how these structures are affected by puberty (as grouped by the binary puberty mapping, as described above). The correspondingp values are tabulated in Table 3. We can see,
• Age and sex are significant predictors for HC and AG volumes before puberty. However, after onset of puberty, age is not significant factor for either boys or girls. Sex remains a significant predictor of HC and AG volume. Essentially, after onset of puberty, HC and AG stop growing, at least in a significant fashion, and these structures are larger in boys.
• For left and right EPC, sex is a significant predictor before puberty, but not for left EPC after puberty onset. For the right EPC, age is a significant predictor but only before puberty.
• For left PHC, age effect is a significant predictor before puberty, but not after puberty onset.
In general, women have smaller PHC volumes before puberty, and then equalize with boys afterwards (see Fig. 5).
• No significant effect of averaged puberty score on volume was detected for any of the MTL structures in the before or during puberty group.
In general, sex is a strong predictive factor, with greater volumes in boys than in girls. This might be mostly due to the fact that boys brains are larger than those of girls.
3.4 Effect of progression of puberty on normalized volumes
We next studied the effect of progression of puberty on the MTL structure volumes, after onset of puberty. To reduce the influence of head size, in the following analysis, each brain was normalized by stereotaxic transformation. In stereotaxic space, all brains are approximately the same height,
Table 2: Statistical analysis on volume against age, sex, and averaged puberty score for the full age group (Significance index values withp <0.05 in bold)
AGE SEX PUBERTY SCORE
AG Left 0.346 (<0.001) 0.268 (0.007) 0.172 (0.595) Right 0.313 (<0.001) 0.275 (<0.001) 0.201 (0.129) HC Left 0.364 (<0.001) 0.264 (<0.001) 0.215 (0.084) Right 0.376 (<0.001) 0.275 (<0.001) 0.254 (<0.033) EPC Left 0.123 (0.293) 0.291 (<0.001) 0.086 (0.986)
Right 0.142 (0.161) 0.338 (<0.001) 0.187 (0.051)
PHC Left 0.108 (0.110) 0.014 (0.965) 0.211 (0.049)
Right 0.071 (0.807) 0.224 (0.030) 0.044 (0.835) Notes: column 3 to 5 are r values followed by p-values in parentheses.
Table 3: Statistical analysis on volume against age, sex, and averaged puberty score for before and during puberty groups (Significance index values with p <0.05 in bold)
AGE SEX PUBERTY SCORE
Before During Before During During
AG
Left 0.298(0.002) 0.175(0.175) 0.237(0.042) 0.234(0.049) 0.056(0.747) Right 0.320(<0.001) 0.135(0.098) 0.273(0.004) 0.336(0.003) 0.098(0.205) HC Left 0.397(<0.001) 0.148(0.270) 0.275(0.002) 0.316(0.007) 0.013(0.776) Right 0.360(<0.001) 0.059(0.408) 0.298(<0.001) 0.274(0.015) 0.088(0.393) EPC
Left 0.188(0.066) 0.046(0.712) 0.293(<0.001) 0.141(0.094) 0.046(0.407) Right 0.243(0.018) 0.058(0.650) 0.389(<0.001) 0.274(0.002) 0.049(0.368) PHC Left 0.207(0.044) 0.055(0.201) 0.024(0.904) 0.005(0.584) 0.054(0.193) Right 0.139(0.277) 0.083(0.793) 0.157(0.071) 0.093(0.529) 0.110(0.193) Notes: column 3 to 7 are r values followed by p-values in parentheses.
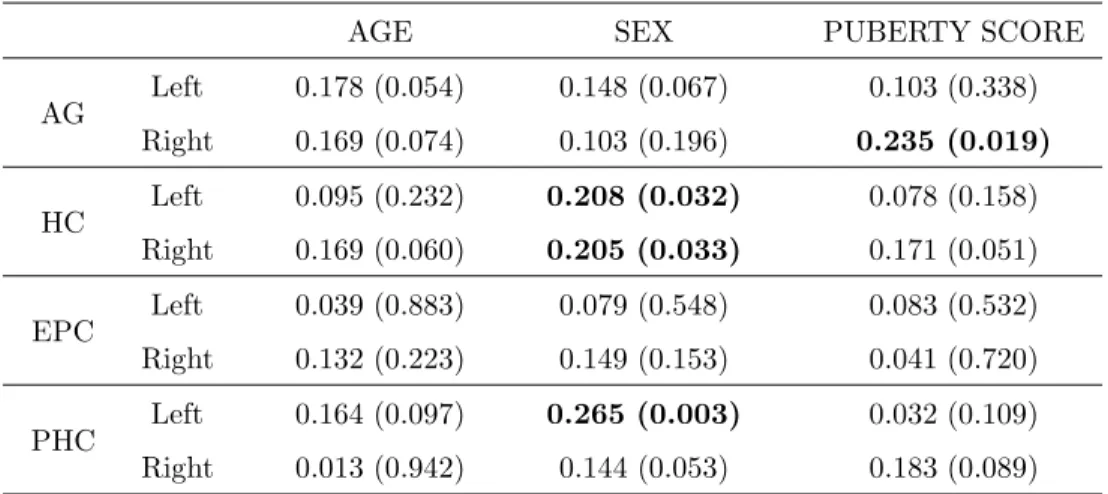
Table 4: Statistical analysis on normalized volume against age, sex, and averaged puberty score for puberty group (volume normalized in stereotaxic space)
AGE SEX PUBERTY SCORE
AG Left 0.178 (0.054) 0.148 (0.067) 0.103 (0.338) Right 0.169 (0.074) 0.103 (0.196) 0.235 (0.019) HC Left 0.095 (0.232) 0.208 (0.032) 0.078 (0.158)
Right 0.169 (0.060) 0.205 (0.033) 0.171 (0.051) EPC Left 0.039 (0.883) 0.079 (0.548) 0.083 (0.532) Right 0.132 (0.223) 0.149 (0.153) 0.041 (0.720) PHC Left 0.164 (0.097) 0.265 (0.003) 0.032 (0.109) Right 0.013 (0.942) 0.144 (0.053) 0.183 (0.089)
Notes: column 3 to 5 are r values followed by p-values in parentheses, and significance index values withp <0.05 in bold
length and width, and thus stereotaxically transformed volumes are normalized for brain size. This normalization can remove some of the global differences in the size and shape between the individual brains (Paus et al., 1999; Giedd et al., 1997).
We first evaluated a hypothetical use of age, sex, and averaged puberty score to predict volume.
The same regression model as expressed in Eq. 5 was used but here the analysis was on the normalized volumes. The resulting statistical significance index values p for individual MTL structures for data having the binary puberty = 1 (The average puberty score ≥ 2) are listed in Table 4. Looking at those results, we observed,
• AG: In the normalized data, neither sex or age were significant predictors of AG volume. A significant effect of averaged puberty score was found for right hemisphere (r = 0.235, p= 0.049).
• HC: Sex is a significant predictor for HC volume (r = 0.208, p = 0.032 for left HC, and r = 0.205, p= 0.033 for right HC), with HC for girls larger than boys (after stereotaxic normalization for head size). No significant age effect was detected. Also, no significant effect of averaged puberty score was found for either the left or the right side, with a trend for significant puberty scores on the right.
• EPC: No significant effects from sex, age, and averaged puberty score were detected.
• PHC: Sex effect is significant for left hemisphere (r = 0.265, p = 0.003), and almost reaches significance on the right, but age and averaged puberty score do not have a significant effect.
Our next analysis focused on the MTL structure volume and sexual maturity level (measured by puberty score). Here, boys and girls were analyzed separately to avoid a confounding effect from sex on the model of volume and puberty as done in Bramen et al. (2011). The resulting regression model is
volume =a+b·age +c·puberty scorer + error (6) wherea,b, and care parameters to be found in the regression analysis.
Significant effects were found only for HC and PHC. The results for the HC are shown in Fig. 7 for boys and in Fig. 8 for girls. The plots shown are effect leverage plots with a sloped solid line representing the full model, a horizontal dashed blue line the mean volume, and two additional dashed purple lines two confidence curves for the 0.05-level whole-model hypothesis (Sall et al., 2005). From the results, we can see,
• Boys: For boys (See Fig. 7), the volumes of both left and right HC are decreasing with increasing puberty score. The decrease of the right HC is statistical significant with r = 0.238, and p= 0.0337.
• Girls: For girls (See Fig. 8), the volumes of both left and right HC are found increasing with the increase of puberty score. The increase of the left HC is statistical significant with r = 0.274, and p= 0.0383.
The results on the PHC for boys are shown in Fig. 9. We can see,
• The volumes of both the left and right PHC are found decreasing with increasing of puberty score. The decreasing relation is statistically significant for left (r= 0.307, p = 0.0125) and right (r = 0.451, p= 0.0015) PHC. The results also suggest that after puberty the volumes of the left and right PHC is smaller in boys.
In the above analysis, the puberty score was averaged across the five puberty development scale (PDS) elements, and this kind of averaging might mask the link between individual PDS elements and MTL structure volume change. As each PDS element is related to a distinctive physiological process, which may manifest itself differently in brain growth, we further explored the correlation of the puberty score of each individual PDS element on the MTL structure volume changes. The resulting r and p-value for individual MTL structure are listed in Table 5 for boys and in Table 6 for girls. From these tables, we can see:
For boys:
(a) Left HC (b) Right HC
Figure 7: Volumes of HC with averaged puberty score during puberty for boys (volume normalized in stereotaxic space and in units of 1mm3).
(a) Left HC (b) Right HC
Figure 8: Volumes of HC versus averaged puberty score during puberty for girls (volume normalized in stereotaxic space and in units of 1mm3).
(a) Left PHC (b) Right PHC
Figure 9: Volumes of PHC versus averaged puberty score during puberty for boys (volume normalized in stereotaxic space and in units of 1mm3).
• AG: A statistical significant relationship between the volume change of the right AG and the puberty score of certain PDS elements was found. To be specific, the right AG volume signifi- cantly increases with the individual puberty scores for body hair, facial hair, and skin change.
This was not found when using averaged puberty score.
• HC: The height growth was found to be strongly but negatively correlated with the volume of the left and right HC (r = −0.324, p = 0.016 for the left HC, and r = −0.339, p = 0.044 for the right HC). Basically, the volumes of the HC on both sides decrease with the height growth.
Previously, only the volume of right HC was found to decrease with the averaged puberty score.
• EPC: No significant correlation between any PDS element and the EPC volume change was found.
• PHC: Volumes of the left and right PHC was found to decrease with the puberty score for voice change (r =−0.65, p = 0.012 for the left PHC, and r =−0.491, p = 0.004 for the right PHC).
No significant correlation between the PHC volume change and other PDS elements was evident.
This agreed well with the study done earlier using the averaged puberty score.
For girls:
• AG: Breast growth was found negatively correlated with the volume of the left AG (r =
−0.204, p= 0.039). This was not shown in the study using the averaged puberty score.
• HC: The volume of the left HC was found strongly and positively correlated with the breast growth, height growth, and menstruation. The volume of the right HC was found strongly and positively correlated with the height growth. The correlation between the volume of the right HC and breast growth or menstruation for the right HC was marginal (p = 0.067 for breast growth, andp= 0.081 for menstruation). The study done earlier revealed only the relationship for the left HC and the averaged puberty score.
• EPC: No significant correlation between any PDS element and the EPC volume change was found.
• PHC: No significant correlation between any PDS element and the PHC volume change was found.
In summary, the link between the puberty development scale (PDS) and certain MTL volume change found earlier using the averaged puberty score is confirmed in the statistical analysis on each individual PDS element. The latter actually uncovered more links, but this exploratory analysis should be interpreted with some caution as we report the raw correlations and p-values without correction for multiple comparisons. To be specific, for boys, the individual PDS element analysis has shown the links between body hair, facial hair, and skin change with the volumes of the right AG, between height growth and the volume of the left and right HC, and between voice change and the volume of the left and right PHC, while for girls, the latter analysis has shown the links between breast growth and the volume of the left AG, between breast growth, height growth, and menstruation and the volume of the left HC, and between height growth and the volume of the right HC.
4 Discussions and conclusions
This paper used the appearance model-based segmentation method with patch-based local refinement to automatically identify individual medial temporal lobe structures from MRI data for healthy chil- dren aged from 4 to 18 years old and analyzed the volumetric changes for each individual medial temporal lobe structure. As a main analysis, volumetric changes and their relation with age were explored. Further, the effect of sex on volumetric changes was investigated. To focus on the study of medial temporal lobe development during puberty, the MRI data were categorized into two groups:
Table 5: Statistical analysis on normalized volume against each individual puberty development scale element for boys with puberty group (volume normalized in stereotaxic space)
Body hair Facial hair Height growth Voice change Skin change AG Left 0.028 (0.642) 0.172 (0.143) -0.011 (0.788) 0.084 (0.656) 0.107 (0.374)
Right 0.230 (0.017) 0.284 (0.010) 0.120 (0.314) -0.004 (0.743) 0.252 (0.037) HC Left -0.027 (0.607) -0.088 (0.319) -0.324 (0.016) -0.040 (0.898) -0.103 (0.264)
Right -0.082 (0.460) -0.158 (0.354) -0.339 (0.044) -0.207 (0.235) -0.107 (0.158) EPC Left -0.037 (0.536) 0.057 (0.790) 0.136 (0.581) 0.095 (0.918) 0.208 (0.065) Right 0.039 (0.333) 0.163 (0.287) 0.054 (0.775) 0.109 (0.295) 0.182 (0.171) PHC Left -0.073 (0.893) -0.103 (0.438) -0.309 (0.088) -0.365 (0.012) -0.193 (0.173) Right -0.213 (0.483) -0.062 (0.775) -0.265 (0.173) -0.491 (0.004) -0.241 (0.193) Notes: r values followed by p-values in parentheses; and significance index withp <0.05 in bold
Table 6: Statistical analysis on normalized volume against each individual puberty development scale element for girls with puberty group (volume normalized in stereotaxic space)
Breast growth Height growth Menstruation Body hair Skin change AG Left -0.204 (0.039) 0.109 (0.397) 0.124 (0.209) 0.114 (0.790) 0.111 (0.516)
Right 0.108 (0.134) 0.146 (0.098) -0.069 (0.493) -0.014 (0.594) -0.013 (0.613) HC Left 0.274 (0.012) 0.269 (0.033) 0.270 (0.049) 0.170 (0.371) 0.193 (0.066)
Right 0.237 (0.067) 0.292 (0.040) 0.217 (0.081) 0.106 (0.288) 0.147 (0.166) EPC Left 0.093 (0.649) 0.134 (0.290) -0.041 (0.487) 0.056 (0.739) -0.049 (0.366) Right 0.157 (0.527) 0.210 (0.410) 0.108 (0.241) 0.262 (0.118) 0.208 (0.560) PHC Left 0.066 (0.609) 0.079 (0.665) 0.196 (0.339) 0.109 (0.694) 0.066 (0.741) Right -0.064 (0.550) 0.101 (0.381) 0.084 (0.293) 0.106 (0.362) -0.096 (0.555) Notes: r values followed by p-values in parentheses; and significance index withp <0.05 in bold. Menstruation measured by two scales (1 or 4), while others by four scales from 1 to 4.
one prior to onset of puberty, and the other after the onset of puberty. Volumetric changes versus sexual maturity were further studied. Taken together, we observed the following results:
• Age-related volume differences: We have found that the volumes of MTL structures, especially those of the AG and HC, become larger as age increases; however there is a strong sex interaction.
Note that age-related volumetric growth in the AG and HC has been also reported by Giedd et al. (1997, 2006). In our study, however, the strong correlation between the volumes and age was driven mostly by the data before onset of puberty. During puberty, no significant correlation with age was observed.
• Sexual-maturity related volumetric change: During puberty, age is not a good predictor of normalized MTL structure volumetric changes, while sexual maturity level measured by puberty score is (see Table. 4, and Fig. 7-9). Volumetric changes in MTL structures have been observed with sexual maturation, and sex-specific volumetric changes are different for individual MTL structures. No significant correlation was found between the AG volume and the averaged puberty score. However, our individual PDS element analysis found that in boys, the right AG volume was strongly and positively correlated with body hair, facial hair and skin change while in girls, the left AG volume was strongly but negatively correlated with breast growth.
This partially agrees with the findings from Bramen et al. (2011), where bilateral AG volumes were found to increase for boys but decrease for girls. The structure volumes in the study from Bramen were compared against an early/late puberty index determined from a puberty breast/genital exam. Bramen et al. (2011) has also reported a volumetric increase of the right HC from early puberty to late puberty for boys and a volumetric decrease for girls. In our study, however, we have found a different volumetric growth pattern. We have found that as the puberty score increases, the normalized volume of the right HC decreases for boys while the normalized volume of the left HC increases for girls. Thus, we can speculate that during puberty the volume of the HC may be affected by the hormonal changes that occur during that development period, which also cause the appearance of the secondary sexual characteristics.
Given the increase in systemic estrogen in girls after puberty, combined with the fact that (a) the HC is rich in estrogen receptors, (b) that estrogen receptors interact with NMDA receptors, and that (c) estrogen is known to stimulate dendritic growth especially in the dentate gyrus of the HC, it is possible to assume that the increase of the volume of the HC for girls is a consequence of estrogen exposure and sexual maturity. Further supporting this argument, the growth pattern on the HC of girls before puberty, when the gonads are not producing significant
amount of estrogen and progesterone, parallels that of boys (See Fig.3 for age <10).
• EPC and PHC: From the results of the EPC and PHC, our study has found sex-specific difference on the volumes for the EPC but not for the PHC. Before puberty, the volumes of the right EPC and the left PHC are correlated with age. After onset of puberty, the volumes of the PHC are correlated with sexual maturity level and tend to decrease as the puberty score increases. This seems to suggest that in contrast to the HC formation, the PHC region does not seem to be differentially affected by gonadal hormones but seems to complete maturation before the onset of puberty and then seems to consolidate while other regions of the CNS might continue to expand until the end of the second decade of life, resulting in slight decreases for this region after puberty.
In conclusion, volumetric changes for each individual MTL structures including AG, HC, EPC, and PHC were characterized and their relationship with age, sex, and sexual maturity explored. The find- ings on sex-specific differences and sexual maturity-related differences on the normal MTL structure development suggests a significant interaction with gonadal hormone exposure during development and can help us understand better the related cognitive and behavioral differences between boys and girls during puberty.
References
M. D. Barense, T. J. Bussey, A. C. H. Lee, T. T. Rogers, R. R. Davies, L. M. Saksida, E. A. Murray, and K. S.
Graham. Functional specialization in the human medial temporal lobe. J. Neurosci., 25(44):10239–10246, Nov. 2005.
M. G. Baxter. Involvement of medial temporal lobe structures in memory and perception. Neuron, 61(5):
667–677, March 2009.
M. D. De Bellis, M. S. Keshavan, S. R. Beers, J. Hall, K. Frustaci, A. Masalehdan, J. Noll, and A. M. Boring.
Sex difference in brain maturation during childhood and adolescence. Cerebral Cortex, 11(6):552–557, 2011.
R. E. Blanton, J. G. Levitt, J. R. Peterson, D. Fadale, M. L. Sporty, M. Lee, D. To, E. C. Mormino, P. M.
Thompson, J. T. McCracken, and A. W. Toga. Gender differences in the left inferior frontal gyrus in normal children. NeuroImage, 22(2):626–636, Jun. 2004.
Brain Development Cooperative Group. Total and regional brain volumes in a population-based normative sample from 4 to 18 years: The NIH MRI study of normal brain development. Cerebral Cortex, 22(1):1–12, Jan. 2012.
J. E. Bramen, J. A. Hranilovich, R. E. Dahl, E. E. Forbes, J. Chen, A. W. Toga, I. D. Dinow, C. M. Worthman, and E. R. Sowell. Puberty influences medial temporal lobe and cortical gray matter maturation differently in boys than girls matched for sexual maturity. Cerebral Cortex, 21(3):636–646, Mar. 2011.
D. L. Collins and A. C. Evans. Animal: Validation and applications of nonlinear registration-based segmentation.
Int. J. Patt. Recogn. Artif. Intell., 11(8):1271–1294, Dec. 1997.
P. Coup´e, J. V. Manj´on, V. Fonov, J. Pruessner, M. Robles, and D. L. Collins. Patch-based segmentation using expert priors: Application to hippocampus and ventricle segmentation. NeuroImage, 54(2):940–945, Jan.
2011.
P. Coup´e, S. F. Eskildsen, J. V. Manj´on, V. Fonov, D. L. Collins, and the Alzheimer’s disease Neuroimag- ing Initiative. Simultaneous segmentation and grading of anatomical structures for patient’s classification:
Application to alzheimer’s disease. NeuroImage, 59(4):3736–3747, Feb. 2012.
A. S. Dekaban. Changes in brain weights during the span of human life: relation of brain weights to body heights and body weights. Ann. Neurol., 44(4):345–356, Oct. 1978.
E. D¨uzel, K. Schiltz, T. Solbach, T. Peschel, T. Baldeweg, J. Kaufmann, A. Szentkuti, and H. J. Heinze.
Hippocampal atrophy in temporal lobe epilepsy is correlated with limbic systems atrophy. J. Neurol., 253 (3):294–300, Mar. 2006.
A. C. Evans and the Brain Development Cooperative Group. The NIH MRI study of normal brain development.
NeuroImage, 30(1):184–202, Mar. 2006.
P. A. Filipek, C. Richelme, D. N. Kennedy, and V. S. Caviness Jr. The young adult human brain: an MRI-based morphometric analysis. Cereb. Cortex, 4(4):340–360, 1994.
V. S. Fonov, A. C. Evans, K. Botteron, C. R. Almli, R. C. McKinstry, D. L. Collins, and the Brain Development cooperative Group. Unbiased average age-appropriate atlases for pediatric studies. NeuroImage, 54(1):313–
327, Jan. 2011.
J. N. Giedd, F. X. Castellanos, J. C. Rajapakse, A. C. Vaituzis, and J. L. Rapoport. Sexual dimorphism of the developing human brain. Prog. Neuropsychopharmacol. Biol. Psychiatry, 21(8):1185–1201, Nov. 1997.
J. N. Giedd, J. Blumenthal, N. O. Jeffries, F. X. Castellanos, H. Liu, A. Zijdenbos, T. Paus, A. C. Evans, and J. L. Rapoport. Brain development during childhood and adolescence: a longitudinal MRI study. Nature Neuroscience, 2(10):861–863, Oct. 1999.
J. N. Giedd, L . S. Clasen, R. Lenroot, D. Greenstein, G. L. Wallace, S. Ordaz, E. A. Molloy, J. D. Blumenthal, J. W. Tossell, C. Stayer, C. A. Samango-Sprouse, D. Shen, C. Davatzikos, D. Merke, and G. P. Chrousos.
Puberty-related influences on brain development. Molecular and Cellular Endocrinology, 254-255:154–162, Jul. 2006.
N. Gogtay, J. N. Giedd, L. Lusk, K. M. Hayashi, D. Greenstein, A. C. Vaituzis, T. F. Nugent III, D. H.
Herman, L. S. Clasen, A. W. Toga, J. L. Rapoport, and P. M. Thompson. Dynamic mapping of human cortical development during childhood through early adulthood. InProc. Natl. Acad. Sci. USA, volume 101, pages 8174–8179, May 2004.
R. C. Gur, F. Gunning-Dixon, W. B. Bilker, and R. W. Gur. Sex difference in temporo-limbic and frontal brain volumes of healthy adults. Cerebral Cortex, 12(9):998–1003, 2002.
C. Harrop and P. Trower. Why does schizophrenia develop at late adolescence? Clin. Psychol. Rev., 21(2):
241–265, Mar. 2001.
S. Hu and D. L. Collins. Joint level set shape modeling and appearance modeling for brain structure segmen- tation. NeuroImage, 36(3):672–683, Jul. 2007.
S. Hu, P. Coup´e, J. C. Pruessner, and D. L. Collins. Appearance-based modeling for segmentation of hippocam- pus and amygdala using multi-contrast MR imaging. NeuroImage, 58(2):549–559, Sept. 2011a.
S. Hu, P. Coup´e, J. C. Pruessner, and D. L. Collins. Validation of appearance-model based segmentation with patch-based refinement on medial temporal lobe structures. In Proc. of MICCAI 2011 Workshop on Multi-Atlas Labeling and Statistical Fusion, pages 28–37, Toronto, ON, Canada, Sept. 2011b.
S. Hu, P. Coup´e, J. C. Pruessner, and D. L. Collins. Nonlocal regularization for active appearance model: Appli- cation to medial temporal lobe segmentation.Human Brain Mapping, In Press, 2012. doi: 10.1002/hbm.22183.
L. K. Jacobsen, J. N. Giedd, F. X. Castellanos, A. C. Vaituzis, S. D. Hamburger, S. Kumra, M. C. Lenane, and J. L. Rapoport. Progressive reduction of temporal lobe structures in childhood-onset schizophrenia. Am. J.
Psychiatry, 155(5):678–685, May 1998.
T. L. Jernigan, D. A. Trauner, J. R. Hesselink, and P. A. Tallal. Maturation of human cerebrum observed in vivo during adolescence. Brain, 114(Pt 5):2037–2049, Oct. 1991.
W. D. S. Killgore, M. Oki, and D. A. Yurgelun-Todd. Sex-specific developmental changes in amygdala responses to affective faces. Brain Imaging, 12:427–433, Feb. 2001.
O. Kretz, L. Fester, U. Wehrenberg, L. Zhou, S. Brauckmann, S. Zhao, J. Prange-Kiel, T. Naumann, H. Jarry, M. Frotscher, and G. M. Rune. Hippocampal synapses depend on hippocampal estrogen synthesis. J.
Neurosci., 24(6):5913–5921, Jun. 2004.
P. M. Lewinsohn, G. N. Clarke, J. R. Seeley, and P. Rohde. Major depression in community adolescents: Age at onset, episode duration, and time to recurrence. J. Am. Acad. Child Adolesc. Psychiatry, 33(6):809–818, Jul.-Aug. 1994.
F. Liu, M. Day, L. C. Mu˜niz, D. Bitran, R. Arias, R. Revilla-Sanchez, S. Grauer, G. Zhang, C. Kelley, V. Pulito, A. Sung, R. F. Mervis, R. Navarra, W. D. Hirst, P. H. Reinhart, K. L. Marquis, S. J. Moss, M. N. Pangalos, and N. J. Brandon. Activation of estrogen receptor-beta regulates hippocampal synaptic plasticity and improves memory. Nat. Neurosci., 11(3):334–343, Mar. 2008.
R. Loy, J. L. Gerlach, and B. S. McEwen. Autoradiographic localization of estradiol-binding neurons in the rat hippocampal formation and entorhinal cortex. Brain Res., 467(2):245–251, Apr. 1988.
A. Mattai, A. Hosanagar, B. Weisinger, D. Greenstein, R. Stidd, L. Clasen, F. Lalonde, J. Rapoport, and N. Gogtay. Hippocampal volume development in healthy siblings of child-onset schizophrenia patients. Am J. Psychiatry, 168(4):427–435, Apr. 2011.
J. Mazziotta, A. Toga, A. Evans, P. Fox, J. Lancaster, K. Zilles, R. Woods, T. Paus, G. Simpson, B. Pike, C. Holmes, D. L. Collins, P. Thompson, D. MacDonald, M. Iacoboni, T. Schormann, K. Amunts, N. Palomero-Gallagher, S. Geyer, L. Parsons, K. Narr, N. Kabani, G. Le Goualher, D. Boomsma, T. Cannon, R. Kawashima, and B. Mazoyer. A probabilistic atlas and reference system for the human brain: International consortium for brain mapping (ICBM). Philos. Trans R. Soc. Lond. B Biol. Sci., 356(1412):1293–1322, Aug.
2001.
B. McEwen, K. Akama, S. Alves, W. G. Brake, K. Bulloch, S. Lee, C. Li, G. Yuen, and T. A. Milner. Tracking the estrogen receptor in neurons: Implications for estrogen-induced synapse formation. In Proc. of Natl.
Acad. Sci. USA (PNAS), volume 98, pages 7093–7100, Jun. 2001.
E. Mori, Y. Yoneda, H. Yamashita, N. Hirono, M. Ikeda, and A. Yamadori. Medial temporal structures relate to memory impairment in Alzheimer’s disease: an MRI volumetric study. J. Neurol. Neurosurg. Psychiatry, 63(2):214–221, Aug. 1997.
S. Neufang, K. Specht, M. Hausmann, O. G¨unt¨urk¨un, B. Herpertz-Dahlmann, G. R. Gink, and K. Konrad. Sex differences and the impact of steroid hormones on the developing human brain. Cerebral Cortex, 19:464–473, Feb. 2009.
T. Paus, A. Zijdenbos, K. Worsley, D. L. Collins, J. Blumenthal, and J. N. Giedd. Structural maturation of neural pathways in children and adolescents: In vivo study. Science, 283(5409):1908–1911, Mar. 1999.
D. Pelcovitz, S. J. Kaplan, R. R. DeRosa, F. S. Mandel, and S. Salzinger. Psychiatric disorders in adolescents exposed to domestic violence and physical abuse. Am. J. Orthopsychiatry, 70(3):360–369, Jul. 2000.
A. C. Petersen, L. Crockett, M. Richards, and A. Boxer. A self-report measure of pubertal status: reliability, validity, and initial norms. Journal of Youth and Adolescence, 17(2):117–133, 1988.