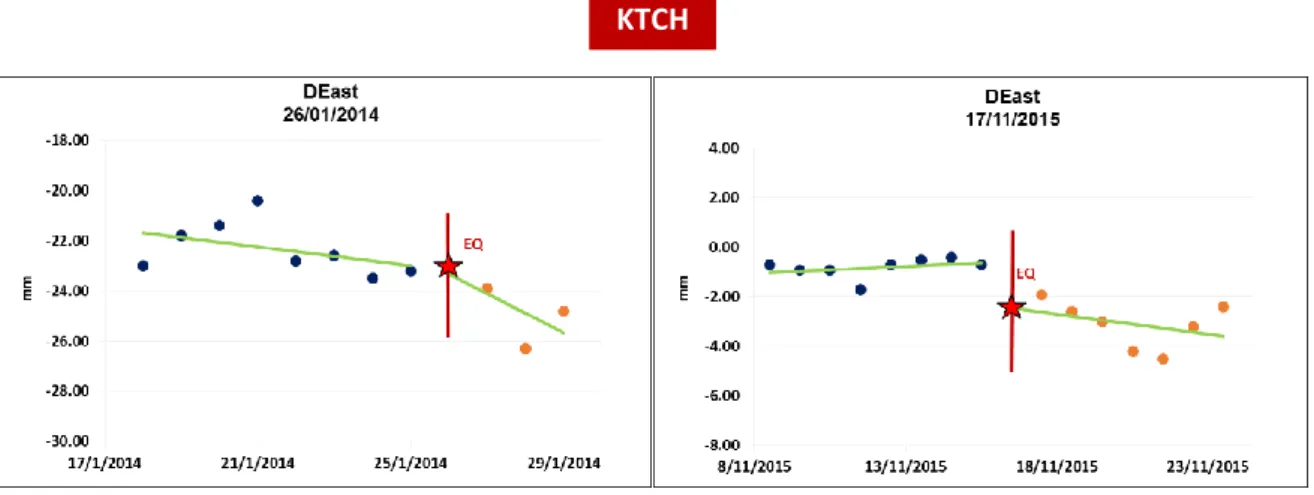
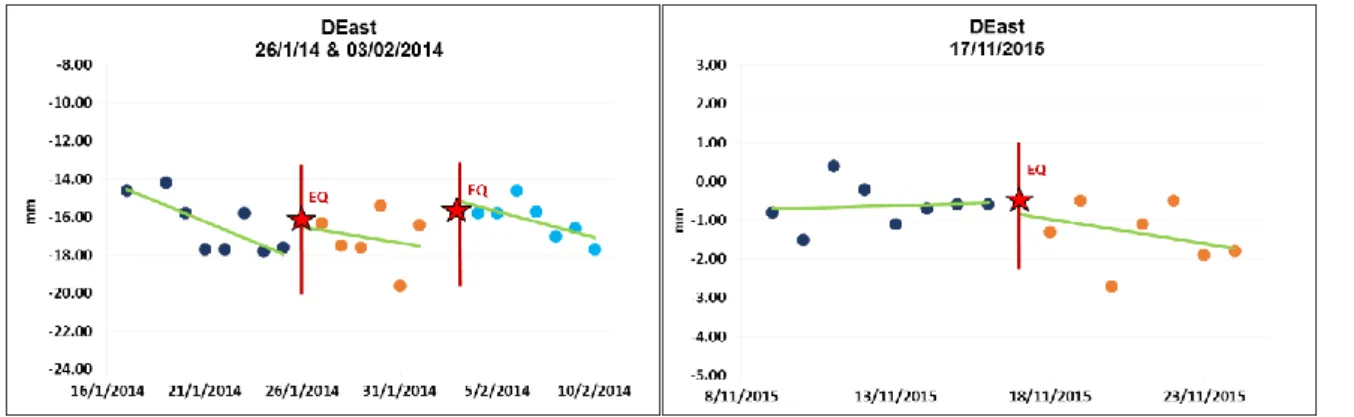
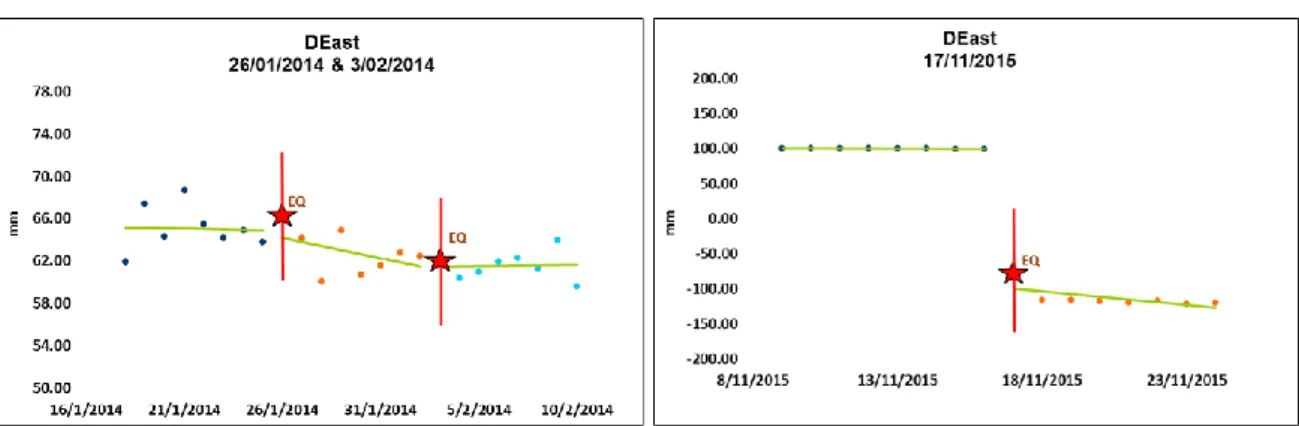
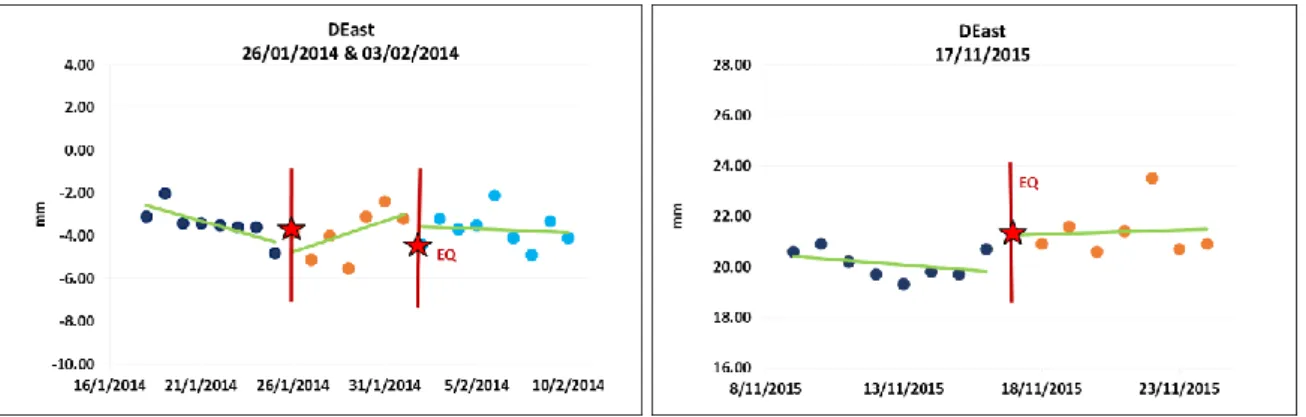
25 Figure 15: Co-seismic anomalies observed in AGRI station after the seismic events of Cephalonia (2014; left panel) and Lefkada (2015; right panel). 29 Figure 17: Co-seismic anomalies observed in KTCH station after the seismic events of Cephalonia (2014; left panel) and Lefkada (2015; right panel). 30 Figure 18: Co-seismic anomalies observed in PAT0 station after the seismic events of Cephalonia (2014; left panel) and Lefkada (2015; right panel).
31 Figure 19: Co-seismic offsets observed at the PATR station after the Cephalonia (2014; left panel) and Lefkada (2015; right panel) seismic events. 32 Figure 20: Co-seismic offsets observed at the PONT station after the Cephalonia (2014; left panel) and Lefkada (2015; right panel) seismic events. 33 Figure 21: Co-seismic offsets observed at the RLSO station after the seismic events of Cephalonia (2014; left panel) and Lefkada (2015; right panel).
36 Figure 24: Co-seismic offsets observed at the SPAN station after the Cephalonia (2014; left panel) and Lefkada (2015; right panel) seismic events. 39 Figure 27: Co-seismic offsets observed at the ZAKY station after the Cephalonia (2014; left panel) and Lefkada (2015; right panel) seismic events.
CHAPTER 1: INTRODUCTION
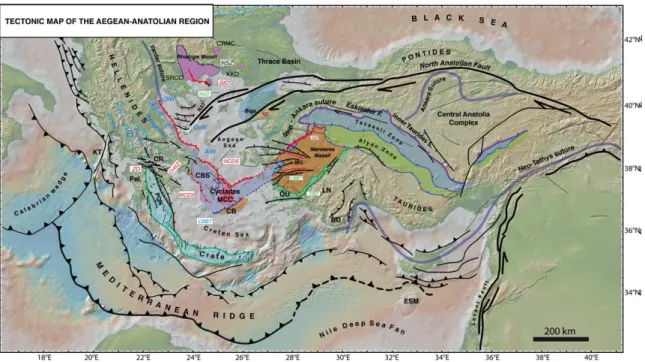
- Tectonic Setting
- Hellenic Arch-Trench System
- Seismicity of the Central Ionian Sea
- The Cephalonia Transform Fault (CTF)
- Geological Settings
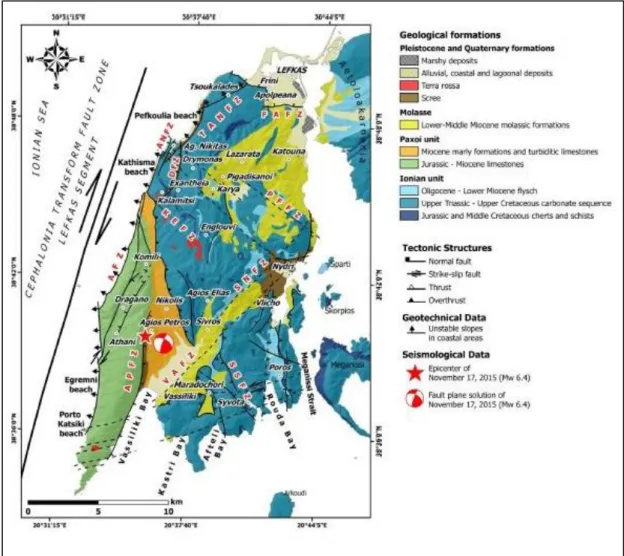
- Lefkada Island
- Cephalonia Island
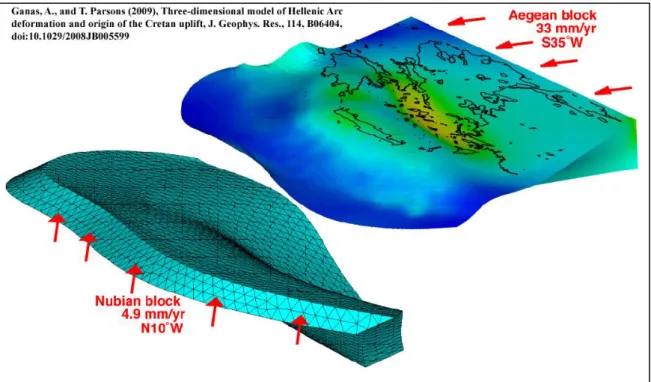
The sense of movement is right-lateral (dextral) due to the northward movement of Africa-Apulia and the southward movement of Eurasia (Hatzfeld et al. 1995; Hollenstein et al. This resulted in the successive accretion of the latter, from the Early Jurassic until the Late Miocene The segmentation of the Cephalonia segment is less clear due to the absence of geodetic data.
The central Ionian Islands comprise the western part of the fold belt of the External Hellenides. The island of Cephalonia consists mainly of Mesozoic and Cenozoic Alpine sedimentary rocks, belonging to the Paxoi zone and the overthrown Ionian zone of the external Hellenides (Fig. 9; Aubouin and Dercourt, 1962; Lekkas et al., 2001) . Uncomfortably, younger Plio-Quaternary sediments lie here, mainly in the SSW part of the island.
Geodetic analysis of the dual-frequency GNSS data results in reliable and unsaturated measurements of ground motion displacements (e.g. Melgar et al., 2015). The latest application of GNSS is the integration of the geodetic component into earthquake early warning systems (e.g. Murray et al., 2018).
CHAPTER 2: DATA PROCESSING AND ANALYSIS
GNSS Theory
The GNSS technique relies on precise measurements of electromagnetic waves between a GNSS antenna and a constellation of satellites with precisely known orbits. GNSS directly measures displacements in an absolute global reference frame (WGS84), but rigorous post-processing of data is necessary to measure displacements at the sub-millimeter level. The space observations are thus useful for extracting landslides after moderate to large events (5≤M≤9.2), as has been demonstrated in many cases (see Melgar et al., 2015 and Ruhl et al. 2018, for an overview of recent literature).
Accordingly, GNSS technology is widely used in earthquake origin studies, where it is usually inverted alone or together with other geophysical data sets (e.g., InSAR, seismology) to define the kinematic origin process of M6+ events (e.g., Overview of Development, Applications, and Algorithms for GNSS can be found in Bock and Melgar (2016).
GNSS networks in Western Greece - Station Features
The stations are equipped with dual-frequency geodetic receivers and belong to NOANET (Ganas et al. HxGN SmartNet Greece, EUREF and NKUA networks (Sakkas and Lagios. All stations are built on small houses, directly on the rock or up to 2-storey buildings so as to or avoid other effects due to building weight response ΤThe following Table (2) shows the key characteristics of the GNSS stations, which are i) the location (longitude and latitude), ii) the start and end date that the period for which we obtained GNSS data for each station (i.e. not the date a station started and ended), iii) the technical characteristics of each station which are mainly the geodetic equipment (antenna and receiver types), and iv) the network to which each station belongs.
Data Processing
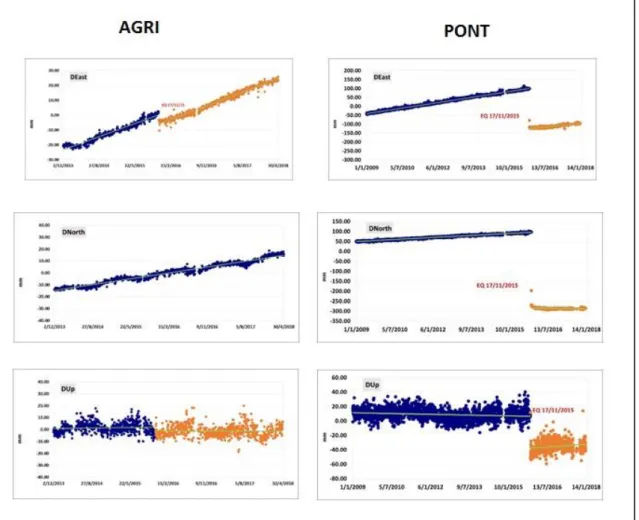
In some cases, for example at the PONT station (South Lefkada), we observe a change of several cm in the station position in all three components as a result of the Lefkada event on November 17, 2015. In this regard, we note that the position of the AGRI station (which located in Agrini, Western Greece) changes by a few mm, especially in the east-west and up-down directions. The difference between the two stations clearly represents the effect of epicentral distance on the observed soil deformation.
The PONT station that is located closer to the epicenter of the 2015 earthquake (hypocenter distance 12.5 km, Tab. 4) shows an order of magnitude greater deformation than the AGRI station where it is further away (hypocenter distance 71.42 km).
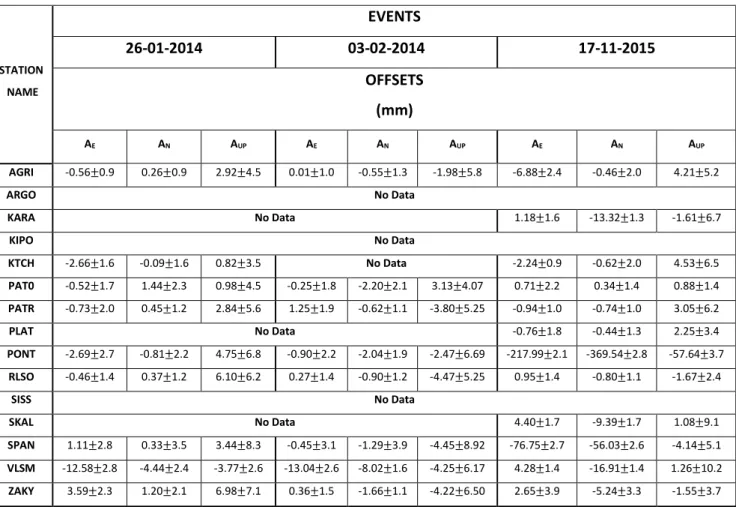
Seismic Offsets
- Offsets caused by the January 26 2014, M6.1 Cephalonia event
- Offsets caused by the February 3 2014, M5.9 Cephalonia event
- Offsets caused by the November 17, 2015 M6.4 Lefkada event
- Offsets caused by the October 25, 2018 M6.6 Zakynthos event
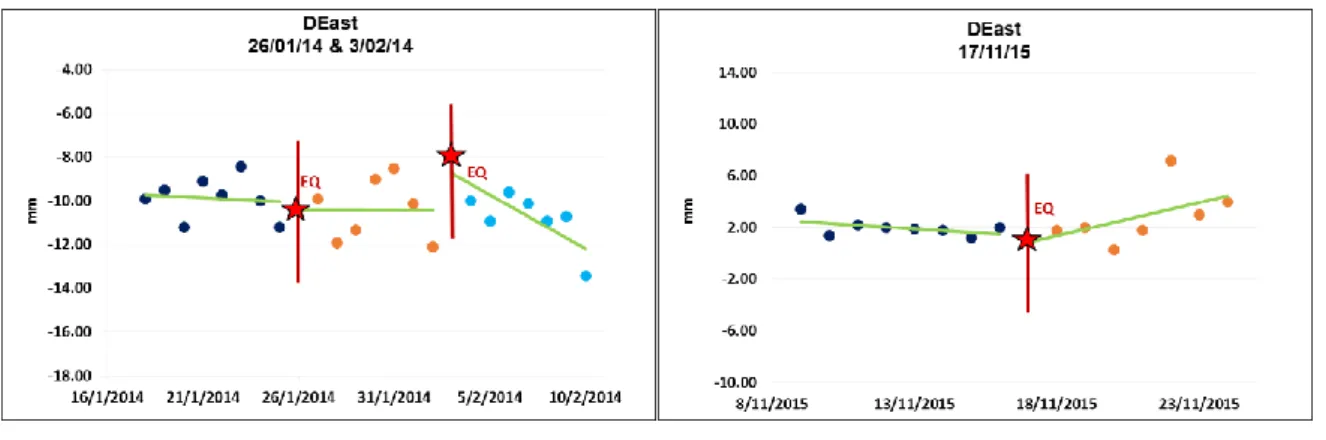
This is probably due to the proximity of the station to the hypocenter of the earthquake. This is probably due to the proximity of the station to the hypocenter of the earthquake, as in the case of the earthquake of January 26, 2014 in Kefalonia. In the case of the 2014 Kefalonia earthquakes, due to the temporal proximity of the events (7 days apart) we study them as one event.
Post-seismic change is characterized by non-linear deformation behavior in contrast to the linear behavior before the event. The baseline between SPAN-PONT stations (the stations on Lefkada belonging to NOA) is shortening at a constant rate of -2.48 mm/year prior to the occurrence of the Lefkada event in 2015. The postseismic change in baseline is characterized by a non-linear strain behavior in contrast to the linear behavior before earthquake nucleation (pre-earthquake period).
From the Tethys Ocean to the Mediterranean: a plate tectonic model of the evolution of the Western Alpine system. The Hellenic arc and trench system: a key to the neotectonic evolution of the eastern Mediterranean area. The TRANSMED transects in space and time: constraints on the paleotectonic evolution of the Mediterranean domain.
Diagrams showing the position change in three components for each station
CHAPTER 3: STUDY OF THE BASELINE RATE CHANGES
- Method of processing
- Cephalonia events (26/01/2014 and 03/02/2014)
- Baseline VLSM-PONT
- Baseline VLSM-KARA
- Lefkada event (17/11/2015)
- Baseline SPAN - PONT
- Baseline PONT-VLSM
- Baseline PONT-KARA
- Baseline PONT-AGRI
- Zakynthos M6.6 event 25/10/2018
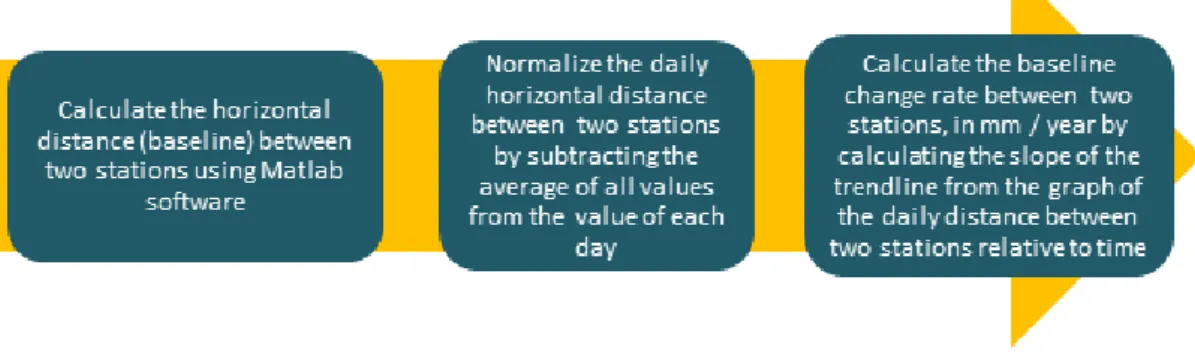
Finally, we calculated the change in baseline rate between two stations in mm/year by calculating the slope of the trend line (linear regression) from the plot of daily distance between two stations versus time (see Figure 37 for the method flow diagram). The stations VLSM and KARA are located on the island of Kefalonia, while the station PONT is located on the island of Lefkada (see Figure 38). This means that the distance between Kefalonia and South Lefkada is increasing at a rate of 2.92 mm/year (Figure 40).
Post-seismically, we omitted several months to avoid post-seismic adjustment of the crust after two seismic events and calculated the base rate of change from the total number of common days (N= 444). We note that the baseline between these stations continues to increase after the occurrence of two earthquakes (Fig. 41) at a higher rate (6.39 mm/year; Tab.6). For the pair of VLSM-KARA stations (Fig. 38) we do not have data for the time period before the 2014 seismic events, because the KARA station was installed in May 2014.
The PONT and SPAN stations are located in the north and south of Lefkada respectively, the VLSM and KARA stations are located on the island of Kefalonia and the AGRI-KTCH stations are located in Akarnania (Fig. 38). Post-seismically, we find that the baseline between PONT-SPAN stations increases sharply in the first fifteen days after the earthquake (Fig. 45) at a high rate of 162.20 mm/yr. The distance between the PONT-VLSM stations (North Lefkada and South Kephalonia, respectively) increases (Fig. 47) at a rate of 5.99 mm/yr during the pre-seismic period.
After the seismic we observe an opposite behavior: the distance between PONT-VLSM shortens at a high rate of -326.35 mm/year for the first 15 days after the earthquake (Fig. 48). We observe a similar behavior in the base difference between the PONT-KARA stations (north of Lefkada and southern Kefalonia, respectively; Fig. 38), with the base between these two stations increasing at a rate of 5.48 mm/year during the parasitic period. (Fig. 50), from 06/05/14 to 16/11/15 (total number of ordinary days N=488; Tab.7). After the earthquake, the distance between PONT-KARA shortens at a high rate of -336.20 mm/year for the first 15 days after the earthquake (Tab. 7 and Fig. 51).
Post-seismically, the distance between PONT-AGRI increases abruptly at a relatively high rate of 77.12 mm/year in the first 15 days after the earthquake (Tab. 7 and Fig. 54). In the post-seismic period, we observe an abrupt change in the baseline rate in the first few days after the event for all pairs of stations. In the case of the 2018 Zakynthos M6.6 earthquake, we calculated baseline change rates between the ZAKY station located on Zakynthos Island and the VLSM station on southern Kefalonia (Tab. 8 and Fig. 38).
CHAPTER 4: DISCUSSION AND CONCLUSIONS
The other two stations (SISS and VLSM), which are located far from the epicenter of the earthquake, do not show deformations in both horizontal and vertical directions. We notice that the proximity of the stations to the hypocenter of earthquakes is related to the value of the observed offset. We also note that the magnitude of the earthquake is positively correlated with the value of the observed offset.
One of the future goals of this research could be the detection of the onset of pre-seismic deformation (i.e. negative change in baseline rate between two GNSS stations) in longer time series. An overview of Mediterranean Ridge collisional accretionary complex as inferred from multichannel seismic data. and Kahle, H., 2000, Global Positioning System constraints on plate kinematics and dynamics in the eastern Mediterranean and Caucasus, J. Active tectonics of the Alpine-Himalayan belt: The Aegean and surrounding regions. Measurement of the dynamic displacements and of the modal frequencies of a short-span pedestrian bridge using GPS and an accelerometer, Engineering Structures https://doi.org/10.1016/j.engstruct.
TRANSMED Transect VII: East European Craton–Scythian Platform–Dobrogea–Balkanides–Rhodope Massif– Hellenides–. Eds.), The TRANSMED Atlas: the Mediterranean Region from Crust to Mantle. Geological Society of Greece, Special Publication 7, pp. and Toksoz, M.N., 1997, Global positioning system measurements of present-day crustal motions in the Arabia-Africa-Eurasia plate collision zone, J. Review of the genesis and emplacement of Mesozoic ophiolites in the Eastern Mediterranean Tethyan region.
List of focal mechanisms plotted in Fig. 7