Dimarchopoulou D, Dogrammatzi A, Karachle PK, Tsikliras AC (2018) Spatial fishing restrictions benefit demersal stocks in the Northeast Mediterranean. Dimarchopoulou D, Stergiou KI, Tsikliras AC (2016) Gaps in biological knowledge of Mediterranean marine fishes. Proceedings of the International Congress on the Zoogeography and Ecology of Greece and Adjacent Regions 14:44.
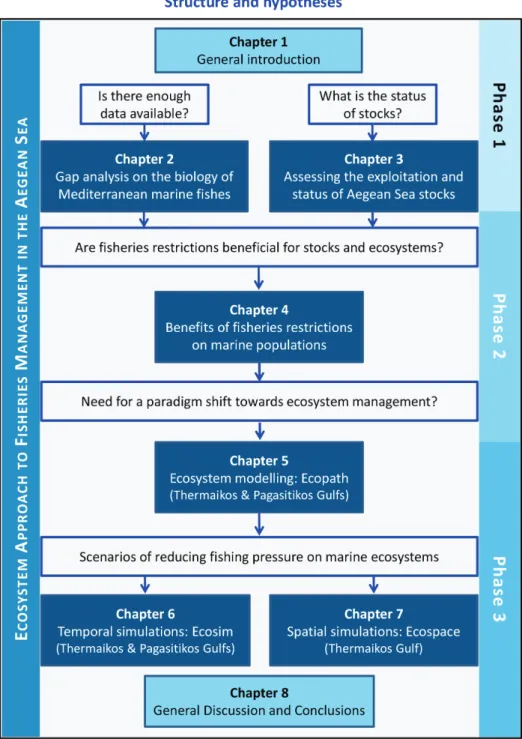
Ecosystem-based fisheries management requires that decision-making is based not only on the characteristics of individual commercial stocks, but on all components of the ecosystem. The Ecopath model suite with Ecosim is widely used in ecosystem-based fisheries management to describe exploited marine food webs and perform temporal and spatial simulations to analyze the impact of fishing activities and environmental factors on aquatic ecosystems.
According to a modeling approach, even most unassessed demersal fish species (98% of them!) are potentially overfished in most Mediterranean areas (Osio et al. 2015). All of the above can cause imbalances in ecosystems and result in the uncontrollable dominance or depletion of some populations or species (Cury et al. 2003). Technical measures are often contradictory and ineffective if they do not take into account the available scientific knowledge (Stergiou et al. 2009).
The paradigms of ecosystem management (EM), which build upwards from single species management, to ecosystem-based management (EBM) (image and legend of Dolan et al. The 7th chapter includes spatial analyzes of the Thermaikos Gulf ecosystem with the Ecospace module of EwE which building on the underlying Ecopath and Ecosim (Dimarchopoulou et al. in preparation).

Knowledge gaps have also been identified in the case of marine mammals (Mannocci et al. Theoretical plot of gap analysis in relation to biological knowledge of the Mediterranean and Greek marine fishes (modified and published in Dimarchopoulou et al. Dimarchopoulou et al.). Indicative list of Greek marine fish species (commercial, general non-commercial, protected, with special life history strategies) with no or scarce information on biological characteristics, which are suggested to be set as priorities in future studies (modified and published in Dimarchopoulou et al. 2016b).
The ten most studied species are also listed by area (number of features/number of records) (published in Dimarchopoulou et al. Dimarchopoulou et al.). Both variables were logarithmically transformed to improve visibility of the figure (published in Dimarchopoulou et al. Dimarchopoulou et al.).

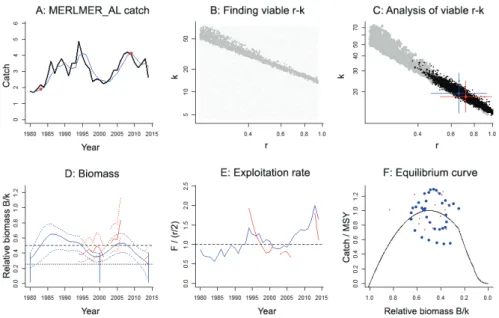
This target requires that fishing pressure (F) is generally reduced to the maximum sustainable level (Fmsy) by 2015, at the latest and only under special circumstances by 2020, and further below (F < Fmsy), so that the biomass (B ) of the stocks is rebuilt above the MSY level (B > Bmsy) (Froese et al. 2019b). The Thermaikos Gulf and the Thracian Sea in the northern Aegean Sea are the areas with the highest fisheries production in Greece (Sylaios et al. 2010). Previous ranges for the parameter r, based on resilience classification in FishBase (Froese & Pauly 2019) (table from Froese et al. 2017).
Species are sorted by functional groups, as indicated by the color of the file IDs: benthic fish and invertebrates (blue), large predators (red) and pelagic plankton feeders (green) (published in Froese et al. 2016a). Catches by main functional group (blue: benthic organisms, green: pelagic plankton feeders, red: large predators) in relation to their maximum sustainable yield (MSY, black), for 42 stocks in the Aegean Sea (published in Froese et al. 2016a). This is also the area where the maximum economic return can be achieved (published in Froese et al. 2016a).
Median biomass in relation to the level that can produce the maximum sustainable yield (B/Bmsy) for 42 Aegean Sea stocks assigned to the main functional groups (blue: benthic organisms, green: pelagic plankton feeders, red: large predators) (published in Froese et al. 2016a). The colors visually indicate compliance with the objectives of the Common Fisheries Policy, whereby all stocks (100%) must be above Bmsy (published in Froese et al. 2016a). Based on the results of all stock assessments in the Mediterranean Sea, it appears that more than 90% of the assessed stocks are overfished, with anchovy and sardine in the Aegean Sea being fished sustainably (Colloca et al. 2013).
Parts of the results were also published in conferences: (1) Dimarchopoulou D, Dogrammatzi A, Karachle PK, Tsikliras AC (2018b) Positive effects of long-term fishing restrictions on three commercial demersal fishes from Thermaikos Gulf (Aegean Sea, Greece). The map was generated using ArcGIS www.esri.com) (published in the appendix of Dimarchopoulou et al. The maps were generated using ArcGIS www.esri.com) (published in the appendix of Dimarchopoulou et al.
The maximum length (LMAX) of the commercial fish and invertebrates studied was generally higher in the low pressure area and decreased with increasing fishing pressure. Length at maturity (LM; total length, mm) for female and male red mullet (Mullus barbatus) and common pandora (Pagellus erythrinus) per fish pressure range (low: low pressure; medium: medium pressure; high: high pressure) (published in Dimarchopoulou et al.

The southern coastline of the Mediterranean basin has not only been studied with two models (Tunisia: Hattab et al. 2013; Pagasitikos: EPAL 2008), acoustic surveys for small pelagic fish in Thermaikos Bay (Tsagarakis et al. 2015) as well as information available. in literature and other models. Landings data were obtained from the Hellenic Statistical Authority (HELSTAT 2017) and modified based on reconstructed landings for the fishing fleet and gear used and for the sub-area of Greece (Moutopoulos & Stergiou 2012), while discards were estimated as a percentage of landings for each fleet (Tsagarakis et al. 2014).
Index values (IV) and confidence intervals (CI ±%) used to describe the range of uncertainty for each input parameter and functional group (FG) of the Pagasitikos Gulf Ecopath model (published in the supplement of Dimarchopoulou et al. 2019a, © 2019 Dimarchopoulouet al.). Circle size indicates relative biomass percentage of each group (published in Dimarchopoulou et al. 2019a, © 2019 Dimarchopoulou et al.). In the absence of generalized TACs (total allowable catch) and quotas in the Mediterranean Sea (except for bluefin tuna Thunnus thynnus and swordfish Xiphias gladius: Froese et al 2018, as well as small pelagic fish in the Adriatic Sea), the control of effort remains the main tool of fisheries management (Stergiou et al. 2016).
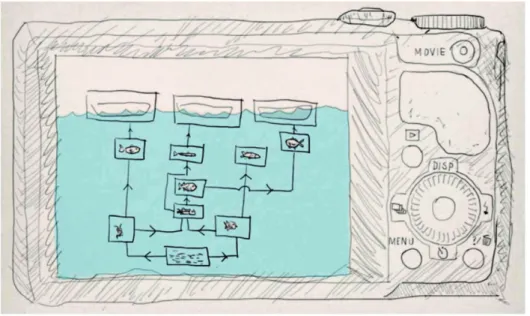
The "food arena" theory (Walters et al. 1997) is the basis for calculating consumption rates. Dimarchopoulou et al. 2018a), while Pagasitikos Bay is an exploited but semi-protected ecosystem on the west coast of the central Aegean Sea, where trawling has been prohibited for more than 50 years. In both models, discards data, which were estimated as a percentage of landings for each fleet, were added to the landings data (Tsagarakis et al. 2014).
Model fit follows the seven steps proposed by Mackinson et al. 2009) including trophic interactions, fisheries and environmental drivers for Thermaikos Gulf. Model fit follows the seven steps proposed by Mackinson et al. 2009) including trophic interactions, fisheries and environmental drivers for Pagasitikos Gulf. Spearman's rank correlations of the primary production anomaly with sea surface temperature (SST), the Atlantic Multidecadal Oscillation (AMO), the North Atlantic Oscillation (NAO) and the Mediterranean Oscillation Index (MOI) (published in Dimarcho - poulou et al. 2019a, © 2019 Dimarchopoulou et al.).
All other interactions have a default vulnerability value of 2 (published in the supplement of Dimarchopoulou et al. 2019a, © 2019 Dimarchopoulou et al.). Empty cells are values that are not applicable or that need to be estimated by the model (published in the supplement of Dimarchopoulou et al. 2019a, © 2019 Dimarchopoulou et al.).
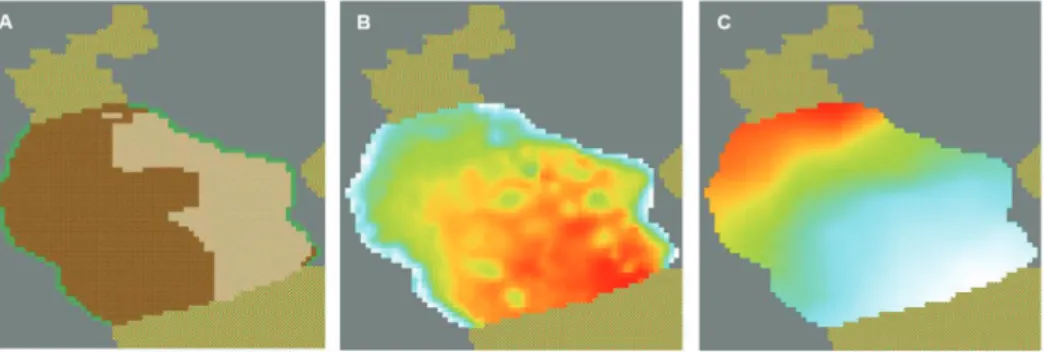
Technical measures, such as spatiotemporal restrictions that regulate fishing activities in specific areas or seasons of the year, are the main instruments used in the Mediterranean and Greek waters for the management of fish stocks and the fishing effort channeled into the fishery (Bellido et al . 2020). The first step in building an Ecospace model is to define the spatial grid cells as a baseline map of the area under study. The spatial domain of the Ecospace model covered the outer Gulf of Thermaikos (approximately 2,800 km2), as defined in Dimarchopoulou et al.
The above-mentioned trawling restrictions have been used as a reference scenario (MPA 0) of the current situation. The spatial distribution of biomass and catches for each FG of the model in 2025 is shown as maps in Figures 7.2 and 7.3, respectively. Regarding the spatial scenarios examined, several target species seemed to benefit from the creation of the MPAs.
Ecospace model predictions of the spatial distribution of biomass for each functional group in Thermaikos Gulf at the end of the simulation period in 2025 for the reference scenario MPA 0. Ecospace model predictions of the spatial distribution of catches for each functional group in Thermaikos Gulf at the end of the simulation period in 2025 for the reference scenario MPA 0 (see Materials and Methods for details). Ecospace model predictions of the spatial distribution of biomass for each functional group in Thermaikos Gulf at the end of the simulation period in 2025 for the MPA 1 scenario (for details see Materials and Methods).
Ecospace model predictions of the spatial distribution of catches for each functional group in Thermaikos Gulf at the end of the simulation period in 2025 for the MPA 1 scenario (for details see Materials and Methods). Ecospace model predictions of the spatial distribution of biomass for each functional group in Thermaikos Gulf at the end of the simulation period in 2025 for the MPA 2 scenario (for details see Materials and Methods). Ecospace model predictions of the spatial distribution of catches for each functional group in Thermaikos Gulf at the end of the simulation period in 2025 for the MPA 2 scenario (for details see Materials and Methods).