Review
On the Extraction of Antibiotics from Shrimps Prior to Chromatographic Analysis
Victoria Samanidou *, Dimitrios Bitas, Stamatia Charitonos and Ioannis Papadoyannis Laboratory of Analytical Chemistry, University of Thessaloniki, GR 54124 Thessaloniki, Greece;
dimitrisbgr@gmail.com (D.B.); stamatia_chrt@windowslive.com (S.C.); papadoya@chem.auth.gr (I.P.)
* Correspondence: samanidu@chem.auth.gr; Tel.: +30-2310-997698; Fax: +30-2310-997719 Academic Editor: Frank L. Dorman
Received: 2 February 2016; Accepted: 26 February 2016; Published: 4 March 2016
Abstract: The widespread use of antibiotics in veterinary practice and aquaculture has led to the increase of antimicrobial resistance in food-borne pathogens that may be transferred to humans.
Global concern is reflected in the regulations from different agencies that have set maximum permitted residue limits on antibiotics in different food matrices of animal origin. Sensitive and selective methods are required to monitor residue levels in aquaculture species for routine regulatory analysis.
Since sample preparation is the most important step, several extraction methods have been developed.
In this review, we aim to summarize the trends in extraction of several antibiotics classes from shrimps and give a comparison of performance characteristics in the different approaches.
Keywords:sample preparation; extraction; aquaculture; shrimps; chromatography; antibiotics
1. Introduction
According to FAO (CWP Handbook of Fishery Statistical Standards, Section J: AQUACULTURE),
“aquaculture is the farming of aquatic organisms: fish, mollusks, crustaceans, aquatic plants, crocodiles, alligators, turtles, and amphibians. Farming implies some form of intervention in the rearing process to enhance production, such as regular stocking, feeding, protection from predators,etc.” [1].
Since 1960, aquaculture practice and production has increased as a result of the improved conditions in the aquaculture facilities. Such improvements include better water quality, infection control, high nutrition feeds and improved aquatic species, through newly developed hybridization techniques, particular species breeding and the use of molecular genetics [2]. According to FAO 2005, in the time span from 1990 to 2005, aquaculture production each year has tripled from 16.8 million tons to 52.9 million tons. By 2015, it was also predicted that aquaculture would constitute 39% of the seafood production in weight worldwide, dramatically increasing from 4% in 1970 and 28% in 2000.
Eleven of the fifteen elite aquaculture producing countries are located in Asia, with 94% of the total worldwide production, while China on its own has 71% of the total production [3].
Shrimp aquaculture is one of the most important aquacultures and makes a considerable contribution to the national economies, both in developed and developing countries. According to the “Global Study of Shrimp Fisheries” from FAO, the biggest domestic product percentage of shrimp farming belongs to Madagascar (1%), excluding the traditional shrimp fishing. The gross domestic values for other developing countries range between $2.72 million–$558 million US. Shrimp is the most profitable exported product in Cambodia, Indonesia, Kuwait, Madagascar, Mexico, Nigeria, and Trinidad and Tobago, and to a lesser extent Australia and Norway. Shrimp consumption, on the other hand, is high in most developed countries, such as Australia and Norway, with the United States presenting the highest consumption and, as a result, being the greatest shrimp market worldwide [4].
Separations2016,3, 8; doi:10.3390/chromatography3010008 www.mdpi.com/journal/separations
Separations2016,3, 8 2 of 43
The increased aquaculture practice has resulted in increased levels of infections among the species.
Usually the farming is done in cages, where high populations are confined to a limited space, and infection outbreaks are common despite good hygiene levels. Bacteria, parasites, viruses and fungi can infect the confined animals, with bacteria being the main source of infections [5].
Antibiotics are used in aquaculture in order to control the infection outbreaks. They are natural, semisynthetic or synthetic compounds and their antibacterial effect resides on their ability to eliminate the bacteria or hinder their growth. Antibiotics used for human disease treatment, such as penicillins, macrolides, sulfonamides, tetracyclines and quinolones/fluoroquinolones, are often used in aquaculture. Specifically, oxytetracycline, florfenicol, sarafloxacin, enrofloxacin, chlortetracycline, ciprofloxacin, norfloxacin, oxolinic acid, perfloxacin, sulfamethazine, gentamicin, and tiamulin are commonly used in aquaculture infections. Besides the use of antibiotics as bacterial infection treatment, sulfonamides,β-lactams and macrolides can be used as growth-promoting or infection-preventing agents. They are used in sub-therapeutic doses in animal feed or veterinary drugs [6–9].
The extensive use of antibiotics, however, may lead to residues in edible animal tissues and cause allergic or toxic effects to sensitive groups or the development of persistent microorganisms. It poses a risk to human health through the migration of antibiotics from aquaculture products to the human organism. As a result, authorities in many countries have published regulations on the antibiotic usage and residues in aquaculture and aquaculture products to minimize the risk to human health associated with consumption of their residue [9].
These regulations are strict in Europe, North America and Japan, where only few antibiotics are approved and maximum residue levels (MRLs) are introduced. However, the majority of aquaculture production and export takes place in countries where few or no regulations exist [6,9].
To comply with the EU regulation, state laboratories have to put into practice methods for both screening and confirming the presence in seafood.
Until every aquaculture country complies with regulations, controls are essential when importing aquaculture products. Sensitive analytical methods have been developed in order to control the product compliance to the regulations and ensure that the residue levels are lower than the MRLs.
Sample preparation is the most important step during the development and the application of such analytical methods.
A significant number of multi-residue or single analytical methods have been reported in the literature for the determination of antibiotics in shrimps.
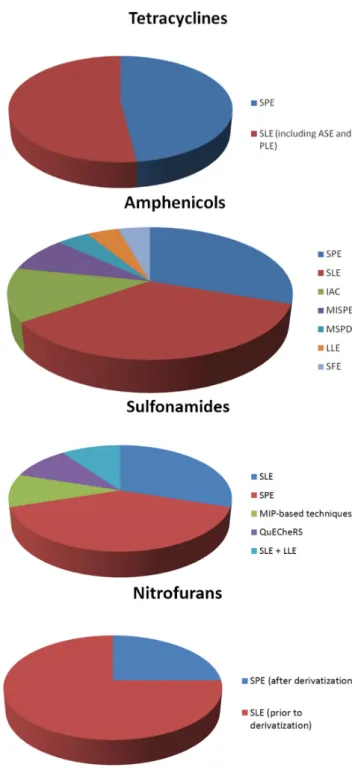
In general, the most common sample preparation techniques are solid phase extraction (SPE), using appropriate columns for each class examined, and solid-liquid extraction (SLE). However, liquid-liquid extraction (LLE) has been also used in some cases. In addition to this, recently developed materials, such as molecular imprinted polymers, have also been applied in some studies. The distribution of sample preparation techniques for the extraction of each class of antibiotics from shrimps is illustrated in the pie charts of Figure1.
Norway, with the United States presenting the highest consumption and, as a result, being the greatest shrimp market worldwide [4].
The increased aquaculture practice has resulted in increased levels of infections among the species. Usually the farming is done in cages, where high populations are confined to a limited space, and infection outbreaks are common despite good hygiene levels. Bacteria, parasites, viruses and fungi can infect the confined animals, with bacteria being the main source of infections [5].
Antibiotics are used in aquaculture in order to control the infection outbreaks. They are natural, semisynthetic or synthetic compounds and their antibacterial effect resides on their ability to eliminate the bacteria or hinder their growth. Antibiotics used for human disease treatment, such as penicillins, macrolides, sulfonamides, tetracyclines and quinolones/fluoroquinolones, are often used in aquaculture. Specifically, oxytetracycline, florfenicol, sarafloxacin, enrofloxacin, chlortetracycline, ciprofloxacin, norfloxacin, oxolinic acid, perfloxacin, sulfamethazine, gentamicin, and tiamulin are commonly used in aquaculture infections. Besides the use of antibiotics as bacterial infection treatment, sulfonamides, β‐lactams and macrolides can be used as growth‐promoting or infection‐preventing agents. They are used in sub‐therapeutic doses in animal feed or veterinary drugs [6–9].
The extensive use of antibiotics, however, may lead to residues in edible animal tissues and cause allergic or toxic effects to sensitive groups or the development of persistent microorganisms. It poses a risk to human health through the migration of antibiotics from aquaculture products to the human organism. As a result, authorities in many countries have published regulations on the antibiotic usage and residues in aquaculture and aquaculture products to minimize the risk to human health associated with consumption of their residue [9].
These regulations are strict in Europe, North America and Japan, where only few antibiotics are approved and maximum residue levels (MRLs) are introduced. However, the majority of aquaculture production and export takes place in countries where few or no regulations exist [6,9].
To comply with the EU regulation, state laboratories have to put into practice methods for both screening and confirming the presence in seafood.
Until every aquaculture country complies with regulations, controls are essential when importing aquaculture products. Sensitive analytical methods have been developed in order to control the product compliance to the regulations and ensure that the residue levels are lower than the MRLs. Sample preparation is the most important step during the development and the application of such analytical methods.
A significant number of multi‐residue or single analytical methods have been reported in the literature for the determination of antibiotics in shrimps.
In general, the most common sample preparation techniques are solid phase extraction (SPE), using appropriate columns for each class examined, and solid‐liquid extraction (SLE). However, liquid‐liquid extraction (LLE) has been also used in some cases. In addition to this, recently developed materials, such as molecular imprinted polymers, have also been applied in some studies.
The distribution of sample preparation techniques for the extraction of each class of antibiotics from shrimps is illustrated in the pie charts of Figure 1.
Figure 1.Cont.
Figure 1. Sample preparation techniques used in the extraction of antibiotics from shrimps.
In this review, emphasis is put on extraction methods with regard to the isolation and purification steps. Results of published methods are summarized in the text and presented comparatively in tables.
2. Antibiotics
The most effective and useful antibacterial agents inhibit or prevent the development of the cell wall, the protein synthesis or the DNA replication and transcription. Less effective and clinically useful are those agents that act on the cell membrane or inhibit a metabolic path of the cell.
Penicillins, cephalosporins and β‐lactams inhibit the cell synthesis, chloramphenicol, tetracyclins and Figure 1.Sample preparation techniques used in the extraction of antibiotics from shrimps.
In this review, emphasis is put on extraction methods with regard to the isolation and purification steps. Results of published methods are summarized in the text and presented comparatively in tables.
2. Antibiotics
The most effective and useful antibacterial agents inhibit or prevent the development of the cell wall, the protein synthesis or the DNA replication and transcription. Less effective and clinically useful are those agents that act on the cell membrane or inhibit a metabolic path of the cell.
Penicillins, cephalosporins andβ-lactams inhibit the cell synthesis, chloramphenicol, tetracyclins and macrolides inhibit the protein synthesis, and quinolones, nitrofurans and sulfonamides inhibit the DNA synthesis [10].
Quinolones are synthetic antibiotics with a broad-spectrum antibacterial effect. This antibiotic group includes plain quinolones, such as oxolinic acid and nalidixic acid, and fluorinated quinolones, known as fluoroquinolones, such as ciprofloxacin, flumequine and sarafloxacin [5].
Quinolones have a dual heterocyclic aromatic ring structure as shown in Figure2, with the first ring having a nitrogen atom at position 1, a carboxyl group at position 3 and a carbonyl group at position 4, and the second ring having a carbon atom at position 8. Fluoroquinolones result from the addition of a fluorine atom at position 6 of the second ring. Substitution at position 1 and 7 results in new enhanced fluoroquinolones [11–13].
macrolides inhibit the protein synthesis, and quinolones, nitrofurans and sulfonamides inhibit the DNA synthesis [10].
Quinolones are synthetic antibiotics with a broad‐spectrum antibacterial effect. This antibiotic group includes plain quinolones, such as oxolinic acid and nalidixic acid, and fluorinated quinolones, known as fluoroquinolones, such as ciprofloxacin, flumequine and sarafloxacin [5].
Quinolones have a dual heterocyclic aromatic ring structure as shown in Figure 2, with the first ring having a nitrogen atom at position 1, a carboxyl group at position 3 and a carbonyl group at position 4, and the second ring having a carbon atom at position 8. Fluoroquinolones result from the addition of a fluorine atom at position 6 of the second ring. Substitution at position 1 and 7 results in new enhanced fluoroquinolones [11–13].
O
NH O
OH
1 2
5 4 3
7 8 6
Figure 2. General chemical structure of quinolones.
The maximum residue limit in muscle tissue according to the Commission Regulation (EU) No. 37/2010 for danofloxacin, enrofloxacin‐ciprofloxacin and oxolinic acid is 100 μg/kg [14].
Tetracyclines are broad‐spectrum antibiotics, and their group includes tetracycline, oxytetracycline, chlortetracycline, demeclocycline, lymecycline, doxycycline, minocycline and tigecycline [15].
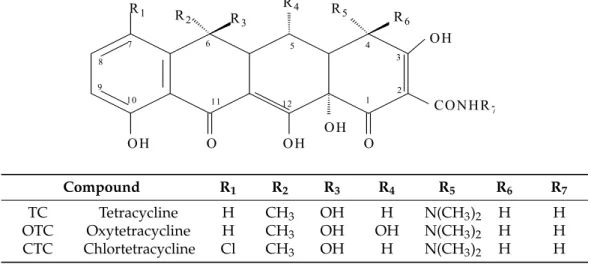
Tetracyclines were discovered in 1945 and were the first broad‐spectrum antibiotics. The first generation of tetracyclines includes chlortetracycline and tetracycline, which were introduced for clinical use in 1948 and 1953, respectively [16,17]. Tetracycline antibiotics have a linearly arranged naphthalene ring structure (Figure 3), with a nitrogen‐containing functional group region (2N region) and an oxygen‐containing functional group region (C3‐C4 region) [16].
OH O OH OH O
CONHR7 OH R1 R2 R3 R4 R5 R6
1 2
3 5 4
7 6 8
10 9
11 12
Compound R1 R2 R3 R4 R5 R6 R7 TC Tetracycline H CH3 OH H N(CH3)2 H H OTC Oxytetracycline H CH3 OH OH N(CH3)2 H H CTC Chlortetracycline Cl CH3 OH H N(CH3)2 H H
Figure 3. General chemical structure of tetracyclines.
The maximum residue limit in muscle tissue according to the Commission Regulation (EU) No.
37/2010 [14] for chlortetracycline, oxytetracycline and tetracycline is 100 μg/kg, while only oxytetracycline hydrochloride and oxytetracycline dihydrate are approved for use in aquaculture from the U.S. Food and Drug Administration (FDA) [18].
Amphenicols are a broad‐spectrum antibiotic group that includes chloramphenicol and its metabolites, thiamphenicol and florfenicol. Florfenicol also has its own metabolite, florfenicol amine [5].
Figure 2.General chemical structure of quinolones.
The maximum residue limit in muscle tissue according to the Commission Regulation (EU) No. 37/2010 for danofloxacin, enrofloxacin-ciprofloxacin and oxolinic acid is 100µg/kg [14].
Tetracyclines are broad-spectrum antibiotics, and their group includes tetracycline, oxytetracycline, chlortetracycline, demeclocycline, lymecycline, doxycycline, minocycline and tigecycline [15].
Tetracyclines were discovered in 1945 and were the first broad-spectrum antibiotics. The first generation of tetracyclines includes chlortetracycline and tetracycline, which were introduced for clinical use in 1948 and 1953, respectively [16,17]. Tetracycline antibiotics have a linearly arranged naphthalene ring structure (Figure3), with a nitrogen-containing functional group region (2N region) and an oxygen-containing functional group region (C3-C4 region) [16].
macrolides inhibit the protein synthesis, and quinolones, nitrofurans and sulfonamides inhibit the DNA synthesis [10].
Quinolones are synthetic antibiotics with a broad‐spectrum antibacterial effect. This antibiotic group includes plain quinolones, such as oxolinic acid and nalidixic acid, and fluorinated quinolones, known as fluoroquinolones, such as ciprofloxacin, flumequine and sarafloxacin [5].
Quinolones have a dual heterocyclic aromatic ring structure as shown in Figure 2, with the first ring having a nitrogen atom at position 1, a carboxyl group at position 3 and a carbonyl group at position 4, and the second ring having a carbon atom at position 8. Fluoroquinolones result from the addition of a fluorine atom at position 6 of the second ring. Substitution at position 1 and 7 results in new enhanced fluoroquinolones [11–13].
O
NH O
OH
1 2
5 4 3
7 8 6
Figure 2. General chemical structure of quinolones.
The maximum residue limit in muscle tissue according to the Commission Regulation (EU) No. 37/2010 for danofloxacin, enrofloxacin‐ciprofloxacin and oxolinic acid is 100 μg/kg [14].
Tetracyclines are broad‐spectrum antibiotics, and their group includes tetracycline, oxytetracycline, chlortetracycline, demeclocycline, lymecycline, doxycycline, minocycline and tigecycline [15].
Tetracyclines were discovered in 1945 and were the first broad‐spectrum antibiotics. The first generation of tetracyclines includes chlortetracycline and tetracycline, which were introduced for clinical use in 1948 and 1953, respectively [16,17]. Tetracycline antibiotics have a linearly arranged naphthalene ring structure (Figure 3), with a nitrogen‐containing functional group region (2N region) and an oxygen‐containing functional group region (C3‐C4 region) [16].
OH O OH OH O
CONHR7 OH R1 R2 R3 R4 R5 R6
1 2
3 5 4
7 6 8
10 9
11 12
Compound R1 R2 R3 R4 R5 R6 R7 TC Tetracycline H CH3 OH H N(CH3)2 H H OTC Oxytetracycline H CH3 OH OH N(CH3)2 H H CTC Chlortetracycline Cl CH3 OH H N(CH3)2 H H
Figure 3. General chemical structure of tetracyclines.
The maximum residue limit in muscle tissue according to the Commission Regulation (EU) No.
37/2010 [14] for chlortetracycline, oxytetracycline and tetracycline is 100 μg/kg, while only oxytetracycline hydrochloride and oxytetracycline dihydrate are approved for use in aquaculture from the U.S. Food and Drug Administration (FDA) [18].
Amphenicols are a broad‐spectrum antibiotic group that includes chloramphenicol and its metabolites, thiamphenicol and florfenicol. Florfenicol also has its own metabolite, florfenicol amine [5].
Compound R1 R2 R3 R4 R5 R6 R7
TC Tetracycline H CH3 OH H N(CH3)2 H H
OTC Oxytetracycline H CH3 OH OH N(CH3)2 H H
CTC Chlortetracycline Cl CH3 OH H N(CH3)2 H H
Figure 3.General chemical structure of tetracyclines.
The maximum residue limit in muscle tissue according to the Commission Regulation (EU) No. 37/2010 [14] for chlortetracycline, oxytetracycline and tetracycline is 100µg/kg, while only oxytetracycline hydrochloride and oxytetracycline dihydrate are approved for use in aquaculture from the U.S. Food and Drug Administration (FDA) [18].
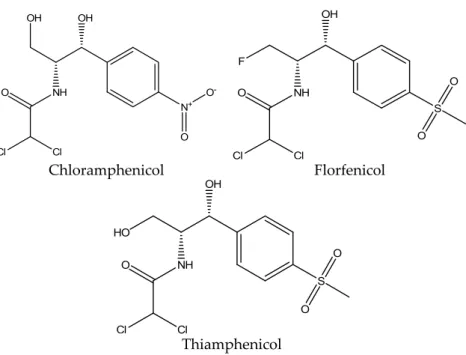
Amphenicols are a broad-spectrum antibiotic group that includes chloramphenicol and its metabolites, thiamphenicol and florfenicol. Florfenicol also has its own metabolite, florfenicol amine [5].
Chloramphenicol is the oldest and the most known member of this antibiotic group. It was originally isolated from cultures of Streptomyces venezuelae and was first used for clinical purposes in 1947. It is effective against many bacteria strains, but its toxicity and unwanted effects limited its use over the years [19,20].
The structure of chloramphenicol is shown in Figure4.
Chromatography 2016, 3, 8 5 of 43
Chloramphenicol is the oldest and the most known member of this antibiotic group. It was originally isolated from cultures of Streptomyces venezuelae and was first used for clinical purposes in 1947. It is effective against many bacteria strains, but its toxicity and unwanted effects limited its use over the years [19,20].
The structure of chloramphenicol is shown in Figure 4.
OH
NH
Cl Cl
O
N+ O-
O OH
O NH
S O
O OH
F
Cl
Cl
Chloramphenicol Florfenicol
O NH
S O
O OH
HO
Cl Cl
Thiamphenicol
Figure 4. Chemical structure of chloramphenicol, florfenicol and thiamphenicol.
The maximum residue limit in muscle tissue according to the Commission Regulation (EU) No.
37/2010 [14] for florfenicol and florfenicol amine is 100 μg/kg; for thiamphenicol, it is 50 μg/kg, and chloramphenicol is completely prohibited. Florfenicol is only approved for use in aquaculture from the U.S. Food and Drug Administration (FDA) [18].
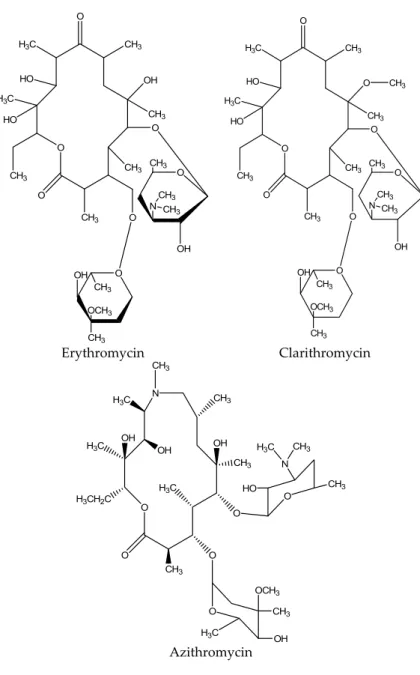
Macrolides are a category of semi‐synthetic medium‐spectrum with a macrolyclic lactone nucleus of 14–16 atoms to which different sugars are attached, forming the different types of the macrolide antibiotics. The category‘s most common antibiotic is erythromycin with a cladinose at C3 and desosamine at C5 (Figure 5).
Macrolides were discovered in natural products in 1950. Especially erythromycin was discovered in 1952, and it is still the most widely used macrolide drug in medicine, while at the end of the 1980s, two more semisynthetic derivatives of erythromycin were discovered.
The antibacterial activity of macrolides is due to their binding to the subunit 50S in the bacterial ribosome; as a result, it prevents the bacterial protein synthesis [21].
The MRL set by the Committee for veterinary medicinal products is 200 μg/kg in muscles, liver and kidneys of animal origin, 40 μg/kg in milk, and 150 μg/kg in eggs for the macrolide drugs [14].
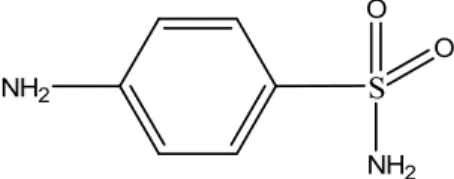
Sulfonamides are derivatives of para‐aminobenzenesulfonamide and their structure is similar to the structure of para‐aminobenzoic acid (PABA), a molecule which takes part in the biosynthesis of dihydrofolic and folic acids by microorganisms (Figure 6). The basic structure of their molecule consists of an unsubstituted amine (–NH2) on a benzene ring at C4 position and a sulfonamide group para to the amine (Figure 5). Sulfonamides are separated into four groups: (1) short—or medium acting sulfonamides, (2) long‐acting sulfonamides; (3) topical sulfonamides and (4) sulfonamide derivatives for inflammatory bowel disease [22,23].
Figure 4.Chemical structure of chloramphenicol, florfenicol and thiamphenicol.
The maximum residue limit in muscle tissue according to the Commission Regulation (EU) No. 37/2010 [14] for florfenicol and florfenicol amine is 100µg/kg; for thiamphenicol, it is 50µg/kg, and chloramphenicol is completely prohibited. Florfenicol is only approved for use in aquaculture from the U.S. Food and Drug Administration (FDA) [18].
Macrolides are a category of semi-synthetic medium-spectrum with a macrolyclic lactone nucleus of 14–16 atoms to which different sugars are attached, forming the different types of the macrolide antibiotics. The category‘s most common antibiotic is erythromycin with a cladinose at C3 and desosamine at C5 (Figure5).
Macrolides were discovered in natural products in 1950. Especially erythromycin was discovered in 1952, and it is still the most widely used macrolide drug in medicine, while at the end of the 1980s, two more semisynthetic derivatives of erythromycin were discovered.
The antibacterial activity of macrolides is due to their binding to the subunit 50S in the bacterial ribosome; as a result, it prevents the bacterial protein synthesis [21].
The MRL set by the Committee for veterinary medicinal products is 200µg/kg in muscles, liver and kidneys of animal origin, 40µg/kg in milk, and 150µg/kg in eggs for the macrolide drugs [14].
Sulfonamides are derivatives of para-aminobenzenesulfonamide and their structure is similar to the structure of para-aminobenzoic acid (PABA), a molecule which takes part in the biosynthesis of dihydrofolic and folic acids by microorganisms (Figure6). The basic structure of their molecule consists of an unsubstituted amine (–NH2) on a benzene ring at C4 position and a sulfonamide group para to the amine (Figure5). Sulfonamides are separated into four groups: (1) short—or medium acting sulfonamides; (2) long-acting sulfonamides; (3) topical sulfonamides and (4) sulfonamide derivatives for inflammatory bowel disease [22,23].
Chromatography 2016, 3, 8 6 of 43
CH3 H3C
HO
HO H3C
CH3 O
O
OH
CH3
O
CH3 CH3
O
OH O CH3
CH3
CH3 O
N CH3
CH3
OH O
OCH3
CH3 H3C
HO
HO H3C
CH3 O
O
O
CH3
O
CH3 CH3
O
OH O CH3
CH3
CH3 O
N CH3
CH3
OH O
OCH3
CH3
Erythromycin Clarithromycin
N
O CH3
OH
CH3 OH OH
H3C CH3
H3C
H3CH2C H3C
O O CH3
O
O
OCH3 CH3
H3C OH HO O
N CH3 H3C
CH3
Azithromycin
Figure 5. Chemical structure of common macrolides.
S NH2 O
O NH2
Figure 6. General chemical structure of sulfonamides.
The MRL set by the Committee for veterinary medicinal products is 100 μg/kg for the parent drug or the residues of sulfonamides in milk, fish and other seafood [14].
Most common nitrofurans are furazolidone, furaltadone, nitrofurazone and nitrofurantoin and their metabolites, 3‐amino‐2‐oxazolidinone (AOZ), 3‐amino‐5‐morpholinomethyl‐2‐oxazolidinone (AMOZ), semicarbazide (SEM) and 1‐aminohydantoin (AHD), respectively. Due to the binding nitrofurans form, it is not easy to determine the parent nitrofuran, but it is possible to determine its metabolite in tissue samples. The chemical structure of nitrofurans is shown in Figure 7 [24].
Figure 5.Chemical structure of common macrolides.
CH3 H3C
HO
HO H3C
CH3 O
O
OH
CH3
O
CH3 CH3
O
OH O CH3
CH3
CH3 O
NCH3 CH3
OH O
OCH3
CH3 H3C
HO
HO H3C
CH3 O
O
O
CH3
O
CH3 CH3
O
OH O CH3
CH3
CH3 O
N CH3
CH3
OH O
OCH3
CH3
Erythromycin Clarithromycin
N
O CH3
OH
CH3 OH OH
H3C CH3
H3C
H3CH2C H3C
O O CH3
O
O
OCH3 CH3
H3C OH HO O
N CH3 H3C
CH3
Azithromycin
Figure 5. Chemical structure of common macrolides.
S NH2 O
O NH2
Figure 6. General chemical structure of sulfonamides.
The MRL set by the Committee for veterinary medicinal products is 100 μg/kg for the parent drug or the residues of sulfonamides in milk, fish and other seafood [14].
Most common nitrofurans are furazolidone, furaltadone, nitrofurazone and nitrofurantoin and their metabolites, 3‐amino‐2‐oxazolidinone (AOZ), 3‐amino‐5‐morpholinomethyl‐2‐oxazolidinone (AMOZ), semicarbazide (SEM) and 1‐aminohydantoin (AHD), respectively. Due to the binding nitrofurans form, it is not easy to determine the parent nitrofuran, but it is possible to determine its metabolite in tissue samples. The chemical structure of nitrofurans is shown in Figure 7 [24].
Figure 6.General chemical structure of sulfonamides.
The MRL set by the Committee for veterinary medicinal products is 100µg/kg for the parent drug or the residues of sulfonamides in milk, fish and other seafood [14].
Most common nitrofurans are furazolidone, furaltadone, nitrofurazone and nitrofurantoin and their metabolites, 3-amino-2-oxazolidinone (AOZ), 3-amino-5-morpholinomethyl-2-oxazolidinone (AMOZ), semicarbazide (SEM) and 1-aminohydantoin (AHD), respectively. Due to the binding nitrofurans form, it is not easy to determine the parent nitrofuran, but it is possible to determine its metabolite in tissue samples. The chemical structure of nitrofurans is shown in Figure7[24].
Chromatography 2016, 3, 8 7 of 43
O CH
ON2 NR1
Figure 7. Chemical structure of Nitrofurans.
Nitrofurans are used as broad‐spectrum antibiotics in veterinary practice, as a treatment to gastrointestinal infections [25] or against Salmonella sp., Mycoplasma sp. and some protozoa [26].
Since 1993, they have been banned in most of the countries in the world, but they are still used in some others. Νο MRL is set by the Committee for veterinary medicinal because nitrofurans and their metabolites are banned in EU [27].
3. Trends in the Extraction of Antibiotics from Shrimps
Shrimp tissue contains high amounts of protein. It also contains unsaturated fatty acids, such as the necessary eicosapentaenoic and docosahexaenoic acids, and minerals, such as calcium. The tissue composition depends on the feed given to the shrimps [28].
As mentioned above, a significant number of multi‐residue or single analytical methods have been reported in the literature for the determination of antibiotics in shrimps.
To begin with, quinolones are mostly determined in shrimps after using SPE or SLE as the sample preparation technique. Furthermore, LLE and MIP‐based techniques are equally applied in some of the studies. The same phenomenon appears in the determination of the class of tetracyclines, where SPE and SLE, including accelerated solvent extraction (ASE) and pressurized liquid extraction (PLE), are almost equally and most frequently used in the analysis of shrimps.
The class of amphenicols is determined by using a wide variety of sample preparation techniques. SLE is once again the primary preferable technique, followed by SPE. A different approach of the extraction is achieved with the use of immunoaffinity columns (IAC) for the determination of amphenicols in shrimps. Molecular imprinted—SPE (MISPE) are also used in a smaller number of studies. In addition to these, there were some cases where matrix solid phase dispersion (MSPD), LLE and supercritical fluid extraction (SFE) is performed in shrimp samples.
For the class of sulfonamides, SPE is the sample preparation of choice, followed by SLE. In addition, there are some studies in which a combination of SLE and LLE is used for the extraction of sulfonamide drugs from shrimp samples. Furthermore, MISPE and QuECheRS are applied for the determination of sulfonamides.
The determination of nitrofurans is achieved by determining the derivatives of the drugs.
Derivatization takes place before or after the sample preparation. Derivatization is preformed after sample preparation using SLE, or prior to SPE.
In the following paragraphs, analytical methodologies for the extraction of antibiotics from shrimp tissue are presented and classified according to the category of antibiotics.
3.1. Extraction of Quinolones
Enrofloxacin and ciprofloxacin were extracted using 10 mL of acetonitrile. The extract was evaporated to dryness at 37 °C, and the residue was re‐dissolved with an ammonium acetate buffer to a final volume of 2 mL. A SPE cleanup step was applied with a SDB‐RPS cartridge (polyStyrene Divinylbenzene‐Reverse Phase sorbent) preconditioned twice with 1 mL of ethanol, 1 mL of water and 1 mL of the ammonium acetate buffer, sequentially. Target compounds were eluted with 4 mL methanol and ammonium hydroxide solution 1 M (75:25, v/v). The eluates were evaporated to dryness at 37 °C, and the residue was re‐dissolved in 300 μL of formic acid solution (pH = 2.5). The extraction procedure yielded recoveries between 94.0%–106.0%, 97.0%–103.0% for ENR and CIP, respectively. Analysis was carried out by an LC‐MS/MS system, separation was achieved by a Polaris C18A 3 μm (150 × 2.0 mm) with a Chromsep guard column SS (10 × 2.0 mm), and the mobile phase consisted of an acetonitrile and formic acid solution (pH = 2.5) delivered in gradient conditions. The LOD was 4 μg/kg and 3 μg/kg for ENR and CIP, respectively [29].
Figure 7.Chemical structure of Nitrofurans.
Nitrofurans are used as broad-spectrum antibiotics in veterinary practice, as a treatment to gastrointestinal infections [25] or againstSalmonellasp.,Mycoplasmasp. and some protozoa [26]. Since 1993, they have been banned in most of the countries in the world, but they are still used in some others.
No MRL is set by the Committee for veterinary medicinal because nitrofurans and their metabolites are banned in EU [27].
3. Trends in the Extraction of Antibiotics from Shrimps
Shrimp tissue contains high amounts of protein. It also contains unsaturated fatty acids, such as the necessary eicosapentaenoic and docosahexaenoic acids, and minerals, such as calcium. The tissue composition depends on the feed given to the shrimps [28].
As mentioned above, a significant number of multi-residue or single analytical methods have been reported in the literature for the determination of antibiotics in shrimps.
To begin with, quinolones are mostly determined in shrimps after using SPE or SLE as the sample preparation technique. Furthermore, LLE and MIP-based techniques are equally applied in some of the studies. The same phenomenon appears in the determination of the class of tetracyclines, where SPE and SLE, including accelerated solvent extraction (ASE) and pressurized liquid extraction (PLE), are almost equally and most frequently used in the analysis of shrimps.
The class of amphenicols is determined by using a wide variety of sample preparation techniques.
SLE is once again the primary preferable technique, followed by SPE. A different approach of the extraction is achieved with the use of immunoaffinity columns (IAC) for the determination of amphenicols in shrimps. Molecular imprinted—SPE (MISPE) are also used in a smaller number of studies. In addition to these, there were some cases where matrix solid phase dispersion (MSPD), LLE and supercritical fluid extraction (SFE) is performed in shrimp samples.
For the class of sulfonamides, SPE is the sample preparation of choice, followed by SLE.
In addition, there are some studies in which a combination of SLE and LLE is used for the extraction of sulfonamide drugs from shrimp samples. Furthermore, MISPE and QuECheRS are applied for the determination of sulfonamides.
The determination of nitrofurans is achieved by determining the derivatives of the drugs.
Derivatization takes place before or after the sample preparation. Derivatization is preformed after sample preparation using SLE, or prior to SPE.
In the following paragraphs, analytical methodologies for the extraction of antibiotics from shrimp tissue are presented and classified according to the category of antibiotics.
3.1. Extraction of Quinolones
Enrofloxacin and ciprofloxacin were extracted using 10 mL of acetonitrile. The extract was evaporated to dryness at 37˝C, and the residue was re-dissolved with an ammonium acetate buffer to a final volume of 2 mL. A SPE cleanup step was applied with a SDB-RPS cartridge (polyStyrene Divinylbenzene-Reverse Phase sorbent) preconditioned twice with 1 mL of ethanol, 1 mL of water and 1 mL of the ammonium acetate buffer, sequentially. Target compounds were eluted with 4 mL methanol and ammonium hydroxide solution 1 M (75:25,v/v). The eluates were evaporated to dryness at 37˝C, and the residue was re-dissolved in 300µL of formic acid solution (pH = 2.5). The extraction procedure yielded recoveries between 94.0%–106.0%, 97.0%–103.0% for ENR and CIP, respectively.
Analysis was carried out by an LC-MS/MS system, separation was achieved by a Polaris C18A 3µm (150ˆ2.0 mm) with a Chromsep guard column SS (10ˆ2.0 mm), and the mobile phase consisted of
an acetonitrile and formic acid solution (pH = 2.5) delivered in gradient conditions. The LOD was 4µg/kg and 3µg/kg for ENR and CIP, respectively [29].
Ciprofloxacin, danofloxacin, enrofloxacin and sarafloxacin were extracted from shrimp samples using 16 mL of acidic acetonitrile and the addition of dichloromethane (to a final volume of 25 mL).
A SPE cleanup step with a Strata C18 E was preconditioned with 2 mL of acetonitrile. The antibiotics were eluted from the SPE cartridges with 2ˆ2 mL of acetonitrile. The eluates were evaporated to dryness under a nitrogen stream at 45˝C, and the residue was re-dissolved in 200µL of acetonitrile and 800µL of deionized water. The extraction procedure yielded recoveries between 63.0%–117.0%, 71.0%–87.0%, 72.0%–92.0%, 95.0%–125.0% for CIP, DAN, ENR and SAR, respectively. Analysis was carried out by a UPLC-MS system, separation was achieved by a HSS T3 C18 column (1.8 mm, 2.1ˆ50 mm) (Waters, Milford, MA, USA), and the mobile consisted of 4 mM NH4OH/50 mM formic acid buffer in either 10% MeCN or 90% MeCN (gradient elution). The LOD values were 0.13, 0.14, 0.19, 0.14 ng/g for for CIP, DAN, ENR and SAR, respectively. This method allows a single analyst to prepare 25 samples each day [30].
Ofloxacin, norfloxacin, ciprofloxacin and lomefloxacin were extracted from the spiked samples with 30 mL of a 1% acetic acid ethanol solution. A cleanup step using SPE was applied. SPE cartridge was washed with 10 mL of methanol, water, methanol in order, and the quinolones were eluted with 10 mL of 25% ammonia methanol. The eluate was evaporated to dryness under a nitrogen stream at 35˝C, and the residues were re-dissolved in mobile phase. The extraction procedure for a peeled prawn sample without shell yielded recoveries between 88.3%–99.8%, 95.9%–109.4%, 91.2%–107.0%, 88.9%–103.4% for OFL, NOR, CIP and LOME, respectively. Analysis was carried out by a HPLC system coupled with a chemiluminescence detector, and separation was achieved by a XDB-C8, 150 mmˆ4.6 mm i.d., 5µm column. The LOD was 0.43, 0.36, 0.40 and 2.4 ng/mL for OFL, NOR, CIP and LOME, respectively. This study established a novel HPLC chemiluminescence detection method for quinolone determination, which was based on the Ce(IV)–Ru(bpy)32+–HNO3system [31].
Enrofloxacin and ciprofloxacin were extracted from the spiked samples with 5 mL of methanol:acetic acid (98:2, v/v), the extracts were evaporated (to a final volume of 2 mL) under a nitrogen stream at 50˝C, and the residue was re-dissolved in 10 mL water:acetic acid (98:2,v/v). The SPE cleanup step involved a Sep-Pak C18(500 mg, 6 mL) cartridge preconditioned and equilibrated with 6 mL of methanol and 6 mL of Milli-Q water sequentially. The quinolones were eluted with 6 mL of methanol:(1 M) phosphoric acid (9:1,v/v) and 4 mL of methanol, the eluate was evaporated to dryness under nitrogen stream at 50˝C, and the dry residue was re-dissolved in 1 mL of Tris buffer solution (pH 9.1). The extraction yielded 88.43%, 80.41% average recoveries for ENR and CIP, respectively. Analysis was carried out by a HPLC system coupled with a fluorescence detector, separation was achieved by a PLRP-S column (5µm, 4.6ˆ150 mm) with a RP18-E guard column (5µm, 4ˆ40 mm) (Polymer Laboratories Inc., Church Stretton, UK), and the mobile phase consisted of orthophosphoric acid, acetonitrile and tetrahydrofuran (gradient elution). The LOD was 0.015, 0.025µg/g for ENR and CIP, respectively [32].
Nine fluoroquinolones and 3 acidic quinolones were extracted from the spiked samples with 20 mL of AcCN/MeOH (1:1v/v), a SPE cleanup step with a Fe3+immunoaffinity cartridge followed, and the quinolones were eluted with 0.5 mL of a McIlvaine-EDTA-NaCl buffer. The extraction procedure yielded inter-day recoveries between 73.7%–89.7% for the fluoroquinolones and 75.7%–87.6% for the acidic quinolones. Analysis was carried out by a HPLC system coupled with a spectrofluorometric detector, separation was achieved by an Atlantis dC18IS column (4.6ˆ20 mm, 3 mm), and the mobile phase consisted of (15:85:0.1v/v) MeOH-water-formic acid for the fluoroquinolones and (35:65:0.1v/v) MeOH-water-formic acid for the acidic quinolones (isocratic elution). The LOQ ranged between 1.5–50.0 mg/kg for the fluoroquinolones and 1.5–3.0 mg/kg for the acidic quinolones [33].
Flumequine, nalidixic acid and oxolonic acid were extracted from the spiked samples with 5 mL of acetonitrile. Two mL of 0.1 mol/L an ammonia solution and 2 mLn-hexane were added to the extracts in order to remove the colored and fatty components. The extracts were evaporated under a nitrogen
stream at 45˝C and 6 mL of hydrochloric acid 0.1 mol/L, and 6 mL of ethyl acetate were added.
The ethyl acetate extract was evaporated to dryness at 40˝C, and the residue was re-dissolved in 300µL of methanol. The extraction procedure yielded recoveries between 73.3%–84.5%, 80.4%–90.4%, 79.2%–88.3% for OXO, NAL and FLU, respectively. Analysis was carried out by a HPLC system coupled with a fluorescence detector, separation was achieved by a C18-Nucleosil HD column (4 mm ˆ250 mm, 5µm), and the mobile phase consisted of 0.01 mol/L oxalic acid (pH 2.3) and acetonitrile (65/35,v/v) (isocratic elution). The CCβwas 610.9µg/kg, 13µg/kg, and 117.3µg/kg for FLU, NAL and OXO, respectively. This method gave good results concerning the complexity of the matrix and allows evaluation of the shrimp samples being compliant to the current European legislation [34].
Oxolinic acid, flumequine and nalidix acid were extracted from the spiked samples with 12 mL of ethyl acetate (re-extracted with another 12 mL) and the addition of 2 g anhydrous sodium sulfate, the extract was evaporated to dryness, and the residue was re-dissolved in 2 mL of a 0.2% formic acid aqueous solution. The extraction procedure yielded 92.6%, 79.3%, 79.8% average recoveries for OXO, FLU and NAL, respectively. Analysis was carried out by an LC system coupled with a fluorescence detector, separation was achieved by an Agilent Zorbax Eclipse XDB C8column (4.6 mmˆ150 mm, 5µm), and the mobile phase consisted of 60% oxalic acid (0.01 M), 30% acetonitrile and 10% methanol (v/v/v) (isocratic elution). MDL was 3, 2.7 and 2.3 ng/g for OXO, NAL and FLU, respectively. The simple extraction scheme provided LC-MS compound confirmation with increased sample throughout, over previews GC-MS methods and selectivity for the above antibiotics [35].
Flumequine, oxolinic acid and nalidix acid were extracted from the spiked samples with 5 mL of 1% acetic acid, 10 mL of acetonitrile and the addition of 2 g sodium chloride. The extract were evaporated to dryness under nitrogen stream at 55˝C and re-dissolved in 2.5 mL of reconstitution solution containing 40 ng/mL of piromidic and 100 mg/mL of EDTA in acetonitrile/water (1:1,v/v).
The extraction procedure yielded recoveries between 79.0%–88.0%, 91.0%–95.0%, 100.0%–101.0% for FLU, OXO and NAL, respectively. The analysis was carried out by a LDTD source coupled to a triple quadrupole mass spectrometer. The MDL was 1.7, 2.6, 4.4 ng/g for FLU, OXO and NAL, respectively.
This method was found to meet many of the drug residue analysis requirements in shrimp tissue samples, using a single solvent extraction step, resulting in decreased sample analysis and increased sample throughput [36].
OXO and FLU were extracted by mixing the spiked samples with 400µL of supramolecular solvent. The extraction procedure yielded recoveries between 100%–102%, 100%–101.4% for FLU and OXO, respectively. Analysis was carried out by an LC system coupled with a fluorescence detector, separation was achieved by a Kromasil C18 column (5 µm, 150 mm ˆ4.6 mm), and the mobile phase consisted of 55% oxalic acid (0.01 M) and 45% acetonitrile/methanol (75:25,v/v) delivered isocratically. The CCβwas 109 g/kg, and 622 g/kg for OXO and FLU, respectively. This method proved to be reliable, fast and low-cost. It demonstrates high extraction efficiency regardless of the matrix composition, and a simple one-step analyte extraction with neither cleanup nor evaporation was needed [37].
Shrimp samples were mixed with trichloroacetic acid aqueous solution (15%,w/v), and the resulting extracts were spiked with ciprofloxacin. Yeast@MIPs or yeast@NIPs were dispersed in the extracts, collected, and washed with a 10-mL methanol-acetic acid solution (59:1v/v). The resulting extracts were dried under nitrogen stream at 298 K, and the residues were re-dissolved in 0.4 mL methanol. The extraction procedure yielded a 86.4% recovery. Analysis was carried out by HPLC system coupled with ultraviolet detector, separation was achieved by a C18(150ˆ4.6 mm2) column, and the mobile phase consisted of methanol-water (24:76,v/v) (isocratic elution). The surface imprinted yeast@MIPs developed for this paper exhibited high adsorption capacity, high selectivity, rapid binding ability for CIP, and could be used at least five times without losing their adsorption capacity. Moreover, they were successfully used in real sample analysis for CIP in shrimps yielding good recoveries [38].
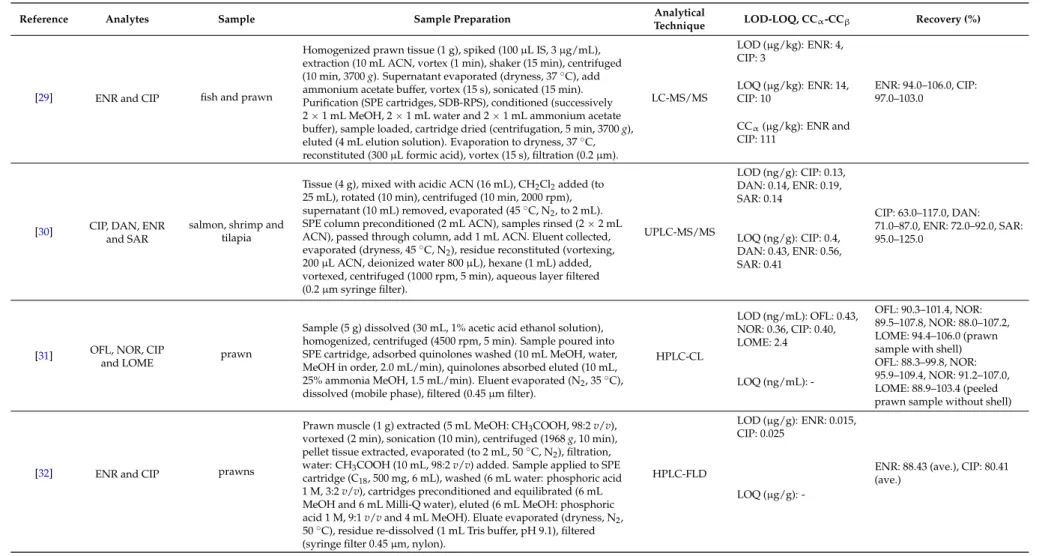
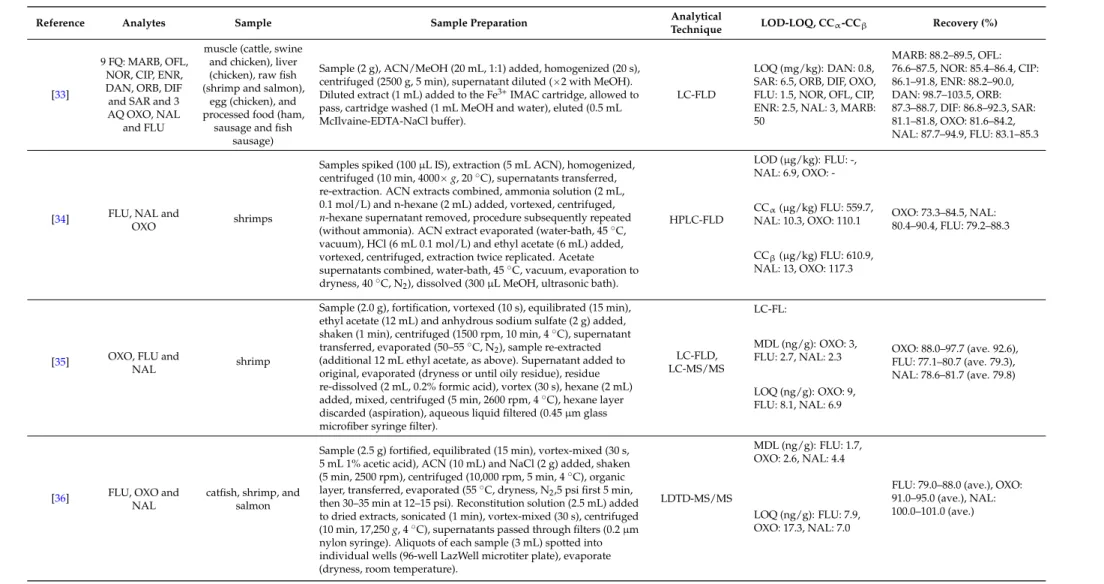
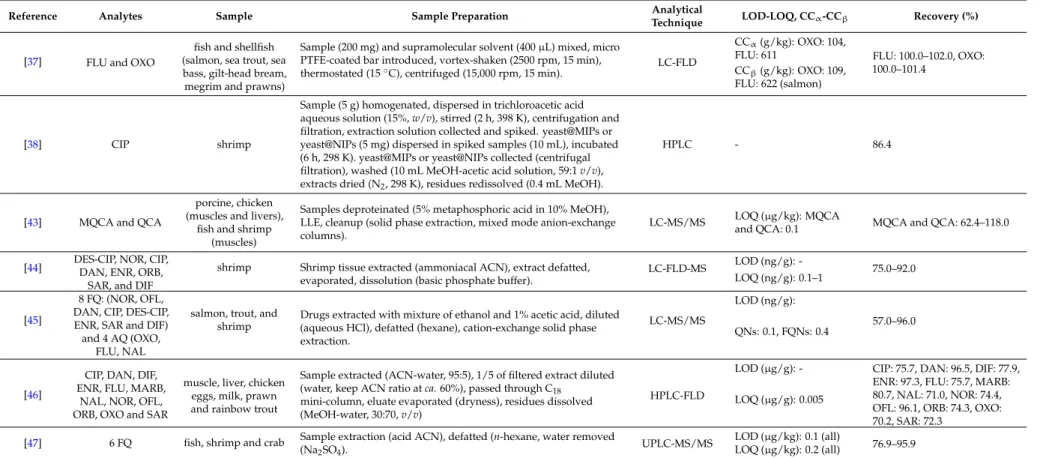
An overview of the extraction methodologies for the determination of quinolones in shrimps is presented in Table1.
3.2. Extraction of Tetracyclines
Tetracycline, oxytetracycline and chlorotetracycline were extracted from the spiked samples with 10 mL of succinic acid and an addition of 1–1.5 g sodium chloride and tissue disruptor. A SPE cleanup step with OASIS hydrophobic-lipophilic-balanced (HLB) SPE columns (6 mL, 200 mg, Waters Corp, Milford, MA, USA) were conditioned with 4 mL of methanol, water and succinic acid sequentially.
The tetracyclines were eluted with 2 mL of methanol, the eluates were evaporated to dryness under nitrogen stream at 60˝C, and the residues were re-dissolved in 2 mL of 0.1% formic acid. The extraction procedure yielded 82.9%, 93.2%, 76.8% average recoveries for TC, OTC, and CTC, respectively. Analysis was carried out by an LC-MS/MS system, separation was achieved by a MacMod HydroBond PS C8, 100 mmˆ2.1 mm, column, and the mobile phase consisted of 75%, 0.1% formic acid, 18% acetonitrile and 7% methanol (isocratic elution). The average LOQ was 50 ng/g for all analytes. The developed method is ideal for routine analysis, avoids the use of complex buffers and provides a simple and fast extraction procedure [39].
Oxytetracycline, tetracycline, chlorotetracycline and doxycycline were extracted from shrimp samples with 12.5 mL of Na2EDTA-McIlvaine buffer at pH 4. A SPE cleanup step with the C-18E cartridge (500 mg, 6 mL) (Phenomenex, Torrance, CA, USA) was activated with 10 mL of methanol and 10 mL of Milli-Q water sequentially. The tetracyclines were eluted with 10 mL of methanol, the solvent was removed under room temperature, and the residues were passed through 0.45µm PTFE filter. The extraction procedure yielded recoveries between 83.3%–96.5%, 88.4%–96.9%, 86.0%–93.3%, 90.6%–102.0% for OTC, TC, CTC and DC, respectively. Analysis was carried out by an LC system coupled with an electrochemical detector with a nickel-implanted boron-doped diamond thin film electrode (Ni-DIA), separation was achieved by a ODS-3 Inertsil C18(5µM 4.6 mmˆ250 mm) column, and the mobile phase consisted of 0.01 M phosphate buffer (pH 2.5)-acetonitrile (80:20,v/v) delivered isocratically. The LOD ranged between 0.1–0.5 g/mL for all analytes. This paper demonstrates the first use of Ni-DIA electrodes for the electroanalysis of tetracyclines, with excellent performance for the oxidative detection of tetracyclines, exhibiting well-defined voltammograms, high sensitivity and significant advantages over the BDD and glassy carbon electrode [40].
Oxytetracycline, tetracycline, chlorotetracycline and doxycycline were extracted from the shrimp samples with HPLC grade methanol. The extract was evaporated to dryness, and the residue was re-dissolved in mobile phase. The extraction procedure yielded recoveries between 91.0%–98.0%, 81.0%–99.0%, 84.0%–101.0%, 80.0%–85.0% for TC, OTC, CTC and DC, respectively. Analysis was carried out by an LC-MS/MS system, separation was achieved by a reverse phase Zorbax Eclipse Plus C18(5µm particle size, 4.6ˆ100 mm) column, and the mobile phase consisted of 0.1% formic acid in water and 0.1% formic acid in methanol under gradient elution. The LOD was 11, 12, 20, 23 ng/g for TC, OTC, CTC and DC, respectively [41].
Seven tetracyclines were extracted from the spiked samples with a Dionex accelerated solvent extractor 200 (Dionex, Sunnyvale, CA, USA), which provides the use of solvents at temperatures up to 80˝C and pressures up to 85 bar, and methanol and 1 mmol/L trichloroacetic acid at pH 4.0 as solvents.
The spiked samples were mixed with 5 g of Na2EDTA-washed sand and packed in an extraction cell at pH 4.0. The extraction procedure yielded 75.6%–103.5% average recovery for all analytes. Analysis was carried out by a HPLC system coupled with a dualλabsorbance detector, separation was achieved by a ZORBAX SB-C18(150 mmˆ4.6 mm I.D., 5µm) (Agilent Technology, Santa Clara, CA, USA) column, and the mobile phase consisted of methanol, acetonitrile and 0.01 M oxalic acid (gradient elution). The CCβranged between 7.8–108.1µg/kg. This method provided fast sample extraction with pressurized liquid extraction, compared to conventional liquid-liquid extractions, with reduced solvent use [42].
An overview of the extraction methodologies for the determination of tetracyclines in shrimps is presented in Table2.
Table 1.Overview of extraction methodologies for the determination of quinolones in shrimps.
Reference Analytes Sample Sample Preparation Analytical
Technique LOD-LOQ, CCα-CCβ Recovery (%)
[29] ENR and CIP fish and prawn
Homogenized prawn tissue (1 g), spiked (100µL IS, 3µg/mL), extraction (10 mL ACN, vortex (1 min), shaker (15 min), centrifuged (10 min, 3700g). Supernatant evaporated (dryness, 37˝C), add ammonium acetate buffer, vortex (15 s), sonicated (15 min).
Purification (SPE cartridges, SDB-RPS), conditioned (successively 2ˆ1 mL MeOH, 2ˆ1 mL water and 2ˆ1 mL ammonium acetate buffer), sample loaded, cartridge dried (centrifugation, 5 min, 3700g), eluted (4 mL elution solution). Evaporation to dryness, 37˝C, reconstituted (300µL formic acid), vortex (15 s), filtration (0.2µm).
LC-MS/MS
LOD (µg/kg): ENR: 4, CIP: 3
ENR: 94.0–106.0, CIP:
97.0–103.0 LOQ (µg/kg): ENR: 14,
CIP: 10
CCα(µg/kg): ENR and CIP: 111
[30] CIP, DAN, ENR and SAR
salmon, shrimp and tilapia
Tissue (4 g), mixed with acidic ACN (16 mL), CH2Cl2added (to 25 mL), rotated (10 min), centrifuged (10 min, 2000 rpm), supernatant (10 mL) removed, evaporated (45˝C, N2, to 2 mL).
SPE column preconditioned (2 mL ACN), samples rinsed (2ˆ2 mL ACN), passed through column, add 1 mL ACN. Eluent collected, evaporated (dryness, 45˝C, N2), residue reconstituted (vortexing, 200µL ACN, deionized water 800µL), hexane (1 mL) added, vortexed, centrifuged (1000 rpm, 5 min), aqueous layer filtered (0.2µm syringe filter).
UPLC-MS/MS
LOD (ng/g): CIP: 0.13, DAN: 0.14, ENR: 0.19, SAR: 0.14
CIP: 63.0–117.0, DAN:
71.0–87.0, ENR: 72.0–92.0, SAR:
95.0–125.0 LOQ (ng/g): CIP: 0.4,
DAN: 0.43, ENR: 0.56, SAR: 0.41
[31] OFL, NOR, CIP
and LOME prawn
Sample (5 g) dissolved (30 mL, 1% acetic acid ethanol solution), homogenized, centrifuged (4500 rpm, 5 min). Sample poured into SPE cartridge, adsorbed quinolones washed (10 mL MeOH, water, MeOH in order, 2.0 mL/min), quinolones absorbed eluted (10 mL, 25% ammonia MeOH, 1.5 mL/min). Eluent evaporated (N2, 35˝C), dissolved (mobile phase), filtered (0.45µm filter).
HPLC-CL
LOD (ng/mL): OFL: 0.43, NOR: 0.36, CIP: 0.40, LOME: 2.4
OFL: 90.3–101.4, NOR:
89.5–107.8, NOR: 88.0–107.2, LOME: 94.4–106.0 (prawn sample with shell) LOQ (ng/mL): -
OFL: 88.3–99.8, NOR:
95.9–109.4, NOR: 91.2–107.0, LOME: 88.9–103.4 (peeled prawn sample without shell)
[32] ENR and CIP prawns
Prawn muscle (1 g) extracted (5 mL MeOH: CH3COOH, 98:2v/v), vortexed (2 min), sonication (10 min), centrifuged (1968g, 10 min), pellet tissue extracted, evaporated (to 2 mL, 50˝C, N2), filtration, water: CH3COOH (10 mL, 98:2v/v) added. Sample applied to SPE cartridge (C18, 500 mg, 6 mL), washed (6 mL water: phosphoric acid 1 M, 3:2v/v), cartridges preconditioned and equilibrated (6 mL MeOH and 6 mL Milli-Q water), eluted (6 mL MeOH: phosphoric acid 1 M, 9:1v/vand 4 mL MeOH). Eluate evaporated (dryness, N2, 50˝C), residue re-dissolved (1 mL Tris buffer, pH 9.1), filtered (syringe filter 0.45µm, nylon).
HPLC-FLD
LOD (µg/g): ENR: 0.015, CIP: 0.025
ENR: 88.43 (ave.), CIP: 80.41 (ave.)
LOQ (µg/g): -