1
In vitro methods to assess drug precipitation in the fasted small intestine – a
1
PEARRL review
2 3
Patrick J. O'Dwyera,1,4, Chara Litoua,2, Karl J. Box1, Jennifer B. Dressman2, Edmund S. Kostewicz2, 4
Martin Kuentz3, Christos Reppas4* 5
6
aEqual first authors 7
1Pion Inc. (UK) Ltd., Forest Row, East Sussex, UK 8
2Institute of Pharmaceutical Technology, Goethe University, Frankfurt am Main, Germany 9
3University of Applied Sciences and Arts Northwestern Switzerland, Gründenstr. 40, 4132, 10
Switzerland 11
4Department of Pharmacy, School of Health Sciences, National and Kapodistrian University of Athens, 12
Zografou, Greece 13
14
Running title: In vitro methods to assess drug precipitation 15
16
*To whom correspondence should be addressed:
17
Christos Reppas Ph.D, Department of Pharmacy, School of Health Sciences, National and 18
Kapodistrian University of Athens, Panepistimiopolis, 157 71 Zografou, Greece 19
Tel. 00 30 210 727 4678 / Fax: 00 30 210 727 4027 / [email protected] 20
21
2 ABSTRACT
22 23
Objectives 24
Drug precipitation in vivo poses a significant challenge for the pharmaceutical industry. During the drug 25
development process, the impact of drug supersaturation and/or precipitation on the in vivo behaviour 26
of drug products is evaluated with in vitro techniques. This review focuses on the small and full scale 27
in vitro methods to assess drug precipitation in the fasted small intestine.
28
Key Findings 29
Many methods have been developed in an attempt to evaluate drug precipitation in the fasted state, 30
with varying degrees of complexity and scale. In early stages of drug development, when drug 31
quantities are typically limited, small scale tests facilitate an early evaluation of the potential 32
precipitation risk in vivo and allow rapid screening of prototype formulations. At later stages of 33
formulation development, full scale methods are necessary to predict the behaviour of formulations 34
at clinically relevant doses. Multicompartment models allow the evaluation of drug precipitation after 35
transfer from stomach to the upper small intestine. Optimisation of available biopharmaceutics tools 36
for evaluating precipitation in the fasted small intestine is crucial for accelerating the development of 37
novel breakthrough medicines and reducing the development costs.
38
Conclusions 39
Despite the progress from compendial quality control dissolution methods, further work is required to 40
validate the usefulness of proposed setups and to increase their biorelevance, particularly in simulating 41
3 the absorption of drug along the intestinal lumen. Coupling results from in vitro testing with 42
physiologically based pharmacokinetic (PBPK) modelling holds significant promise and requires further 43
evaluation.
44
45
4 Table of Contents
46
KEYWORDS ... 6 47
1. Introduction ... 7 48
2. Small scale methods to assess drug precipitation ... 10 49
2.1 Single media tests ... 10 50
2.2 Tests with medium shift (solvent shift) ... 12 51
2.3 Tests with medium and pH shifts ... 15 52
2.4 Two-stage tests ... 17 53
2.5 Methods addressing intestinal absorption ... 19 54
2.5.1 Biphasic Dissolution Tests ... 19 55
2.5.2 Compartmental methods using non-cellular biomimetic membranes ... 21 56
2.5.3 Compartmental methods using cellular membranes ... 23 57
3. Full scale methods to assess drug precipitation ... 24 58
3.1 Compendial Apparatus and Methods ... 24 59
3.1.1 USP I and USP II dissolution apparatus and methods ... 24 60
3.2 The “Dumping Test” ... 26 61
3.3 Compartment methods not addressing intestinal absorption ... 26 62
3.3.1 Closed Systems ... 27 63
3.3.2 Open systems ... 28 64
3.4 Compartment methods which attempt to account of absorption ... 32 65
5 3.4.1 Using appropriate flow rates to take into account both absorption and transit process ... 32 66
3.4.2 Simulating the intestinal epithelial barrier ... 37 67
4. Coupling full scale in vitro testing with Physiologically Based Pharmacokinetic (PBPK) modelling... 44 68
5. Conclusions ... 46 69
Acknowledgements ... 48 70
REFERENCES... 49 71
LIST OF ABBREVIATIONS ... 67 72
73
6 KEYWORDS
74
Precipitation, in vitro techniques, biorelevant, oral drug absorption, supersaturation 75
7 1. Introduction
76
Oral drug absorption is a complex process that can be affected by a range of parameters, related to 77
the drug, the formulation and the underlying physiology of the gastrointestinal tract (GIT). Molecular 78
size, degree of ionisation, dissolution, precipitation, gastrointestinal (GI) transit times, luminal viscosity 79
and pH, bile salt and phospholipid concentrations, cellular permeation and intestinal drug transport 80
and metabolism are some examples of the factors which can affect absorption of a drug and, therefore, 81
its bioavailability.
82
Possible supersaturation and/or precipitation are important parameters to consider, as they can 83
significantly affect the bioavailability of an Active Pharmaceutical Ingredient (API). Assessment of 84
potential supersaturation and precipitation is critical, especially in cases where the API is a weak 85
base with low aqueous solubility or a bio-enabling formulation is implemented.
86
Under fasting conditions, weakly basic drugs usually have higher solubility values in the acidic 87
environment of the stomach compared to the small intestine. Due to the variability in pH values 88
across the human GIT, weakly basic drugs have a propensity to precipitate as they move along the 89
GIT. In particular, for weakly basic compounds, supersaturation can occur after transfer from the 90
stomach to the small intestine. However, supersaturated states are thermodynamically unstable and 91
the degree of supersaturation is the driving force for precipitation. Precipitation and drug absorption 92
are competing processes in the GIT and excipient effects can be of critical importance. From 1981 93
until the end of 2006, 38% of the APIs approved in the U.S.A. for oral administration were basic 94
8 molecules[1] and as new drug entities in current pipelines tend to be somewhat larger molecules 95
(>500 Daltons) and more lipophilic, there is a need to develop reliable in vitro methods to simulate 96
the transfer of the drug through the GIT and accurately predict their precipitation 97
characteristics/kinetics in vivo.
98
The ultimate goal of bio-enabling formulations is enhanced intestinal absorption. To achieve this, 99
pharmaceutical scientists often develop formulations, which are aimed at achieving and maintaining 100
supersaturation, i.e. the so-called “spring and parachute approach”.[2][3] In this way, a greater 101
amount of drug is in solution for a longer period of time in the upper small intestine and therefore, 102
available for absorption. Common methods to improve dissolution and achieve supersaturation 103
include solid phase dispersions, lipid based formulations and formulating with cyclodextrins.[4][5][6]
104
Despite the increasing interest in producing these formulations, there is still a lack of mechanistic 105
understanding about how to achieve and maintain a supersaturated state intraluminally. Therefore, 106
design of these formulations remains a challenge.[7]
107
In every case, precipitation of drug particles can result in impaired absorption of the API and reduced 108
bioavailability. Consequently, it can jeopardise both the therapeutic efficacy and safety of the drug.
109
Precipitation can further contribute to the large intra- and interindividual variability in drug exposure 110
often detected during development of new drug products[8] and can impair the chances of proving 111
efficacy in clinical trials.[9]
112
Currently, apparent supersaturation and/or precipitation of drug in vivo is assessed directly in the 113
human lumen or indirectly using plasma profiles (from humans or animals), ex vivo methods, or in 114
vitro methods. Luminal studies in humans provide the best source of information regarding the 115
9 supersaturation and/or precipitation of different compounds.[10][11][12][13][14] Despite the valuable 116
information obtained from luminal and in vivo methods in humans, as well as from ex vivo studies,[15]
117
they are expensive, time-consuming and can raise ethical issues. Animal pharmacokinetic studies are 118
also a valuable source of information,[16] but differences in the GI conditions between humans and 119
the animal model can be an important source of error when assessing supersaturation and/or 120
precipitation. Animal studies may also raise ethical issues and are costly to conduct. Therefore, 121
methodologies for assessing drug supersaturation and/or precipitation in vitro allow for 122
understanding and predicting the behaviour of an API/formulation before it is administered to 123
humans, and they can facilitate the development of more efficient and safe drug products for 124
patients. Assessing the supersaturation and precipitation kinetics of a compound is important in 125
early development stages, before first in human studies, as well as in the later stages of formulation 126
development. In early stage of drug development, usually a small amount of the candidate-API is 127
available and therefore, small scale techniques are necessary. On the other hand, robust full scale in 128
vitro setups are needed at the stage of formulation development for the evaluation of precipitation 129
and supersaturation after administration of clinically relevant doses, as well as understanding 130
supersaturation and precipitation kinetics in the presence of various excipients.
131
The purpose of this review article is to present an up-to-date overview of the in vitro tools which 132
have been proposed to predict in vivo precipitation, to understand their rationale and to outline 133
strengths and weaknesses. This will highlight areas for optimisations and guide the evolution of the 134
methodology.
135
10 2. Small scale methods to assess drug precipitation
136
Small-scale in vitro setups facilitate the use of small quantities of the API available in the early stages 137
of drug development. They may also be useful for the evaluation of prototype formulations.[17] In 138
addition, the use of small scale experiments allows for reducing the quantity of biorelevant media 139
required, which helps to reduce expenses.
140
Smaller versions of the USP II dissolution apparatus have been developed.[18][19] The mini-paddle 141
vessels use 250 mL, instead of at least 500 mL used in the full sized apparatus. Some of these 142
downscaled apparatus have been shown to produce dissolution results comparable to the standard 143
USP II apparatus.[19] However, in pharmaceutical profiling and early formulation development, an 144
even smaller scale can be beneficial.
145
2.1 Single media tests 146
In early stage of drug development, evaluation of potential drug precipitation can be inferred by 147
comparing solubility in simulated gastric with intestinal media. Solubility information can be 148
obtained rapidly using high-throughput 96 well based solubility screening tests.[20,21] For example, 149
the solubility of ketoconazole, as measured by the PASS (Partially Automated Solubility Screening) 150
test, in Level II fasted state simulated intestinal fluid (Level II FaSSIF[22] (0.017 mg/mL) is much lower 151
than in Level 0 simulated gastric fluid (SGF) (418.3 mg/mL)[20], indicating possible precipitation upon 152
11 transition from gastric to intestinal environment. Subsequent in vivo studies have shown 153
precipitation of ketoconazole in the upper small intestine up to 16% of the administered dose.[10]
154
Many of the high-throughput solubility tests use a solvent casting procedure, which raises concerns 155
on potential changes of drug crystallinity upon removal of the solvent in the excipient matrix.[21]
156
Another potential problem is that traces of solvent could also lead to an overestimation of solubility 157
when the medium is added. While not attempting to capture the full complexity of the in vivo 158
supersaturation or precipitation process, these high-throughput solubility screening tests provide 159
useful information about solubility “gaps” and thus, potential precipitation at an early stage under 160
given conditions using only microgram quantities of drug.
161
Chandran et al., proposed a small scale approach using a turbidimetric spectrophotometry method 162
to quickly evaluate the precipitation potential of a drug.[23] With this method a stock solution of drug 163
was prepared using polyethylene glycol (PEG) 400 as a vehicle and precipitation inhibitors were 164
added. Drug stock solution (100μL) was added to a 96-well plate and mixed with an equal volume of 165
deionised water. This setup measured absorbance at 500 nm, which is well above the absorbance 166
range of any of the molecules tested, but provides a measure of light scattering due to the 167
precipitation of drug, leading essentially to a turbidimetric endpoint. The authors hypothesised that 168
the initial precipitation of fine particles caused a strong scattering of light, before agglomeration of 169
particles resulted. A resulting increase in effective particle size and settling allows for increased 170
transmission through the well, thus leading to decreasing absorption. The qualitative results using 171
this method correlated well with traditional UPLC methods when examining the efficacy of different 172
precipitation inhibitors, as both methods found that the 5% (w/w) d-alpha tocopheryl polyethylene 173
12 glycol 1000 succinate (TPGS) in PEG 400 formulation was the most effective at preventing camphor 174
precipitation.[23] Benefits of using the UV spectrometer include the simple and rapid analysis of drug 175
precipitation at multiple time points, without the requirement of extra sample preparation or sample 176
wastage. This test could be a useful tool to rapidly assess drug precipitation and the impact of 177
excipients in early formulation development.
178
2.2 Tests with medium shift (solvent shift) 179
Yamashita et al., used a solvent shift experiment to evaluate drug precipitation.[24] In this method 180
drug is initially dissolved in DMSO to produce a highly concentrated stock solution. The highly 181
concentrated stock solution is diluted in Level II FaSSIF in a 96-well plate and drug precipitation is 182
monitored by HPLC/UV analysis. This method is useful for comparing the effectiveness of different 183
precipitation inhibitors, which can be added to FaSSIF in the setup. Yamashita et al., used this test to 184
assess the efficacy of precipitation inhibitors with itraconazole. Results were found to correlate well 185
with the full scale paddle dissolution experiment, as both methods identified HPMC-AS 186
(hydroxypropyl methylcellulose-acetate succinate) as the most effective precipitation inhibitor.
187
Petrusevska et al., used DMSO to deliver dissolved drug in a high-throughput test.[25] McIlvaine’s 188
buffer (pH 6.8) with excipient concentrations of 0.001%, 0.01% and 0.1% (w/v) were initially 189
dispensed into each well. The concentrated stock solution of drug in DMSO was added and the plate 190
was shaken for five seconds to ensure adequate mixing. The plate was incubated and samples were 191
removed at various time points up to 360 minutes. Experimental factors such as the shaking 192
13 frequency, incubation temperature and effect of various DMSO concentrations in the setup were 193
investigated. A DMSO concentration of ≤1% (v/v) in the assay was found to be acceptable. The 194
efficacy of 23 different excipients to prevent precipitation of two poorly soluble neutral drugs, 195
carbamazepine and fenofibrate, was examined. Distinct results were found for the two compounds, 196
highlighting the case-specific nature of precipitation inhibitor effects. The authors concluded that 197
this high-throughput test provided a reasonable starting point to select appropriate excipients to 198
help prevent precipitation of drugs.
199
Petrusevska et al., carried out a follow-up study investigating the use of light scattering and turbidity 200
to evaluate drug precipitation and the efficacy of precipitation inhibitors.[26] Light scattering was 201
measured using a nephelometer, whereas turbidity was measured using a UV plate reader at 500nm.
202
Stock solutions of dipyridamole and fenofibrate in DMSO were tested using similar conditions as 203
outlined in the previous experiment. Results were compared to those obtained using standard 204
quantification methods, such as UPLC, to evaluate drug precipitation. The authors expressed a 205
preference for using the light scattering method over the turbidity as it produced less false positives 206
(4 vs. 5) and less false negatives (0 vs. 2) when examining the efficacy of different precipitation 207
inhibitors.
208
Christfort et al., developed a video-microscopic tool to assess the precipitation of tadalafil and the 209
efficacy of precipitation inhibitors.[27] Using a 96-well microplate, 30 μL of a tadalafil DMSO stock 210
solution was added to FaSSIF with varying concentrations (0.0 – 5.0% w/v) of HPMC, acting as a 211
precipitation inhibitor. Micrographs were obtained using the oCelloScope systemTM (Philips Biocell 212
A/S, Allerød, Denmark). The development of precipitation was monitored by both single and multi- 213
14 particle analysis. Single particle analysis determined the induction time for precipitation to occur as 214
the time taken for the first well-defined particle to appear into focus. Using single particle analysis, 215
the effect of varying HPMC concentrations on the induction time for crystal growth and the growth 216
in area of a single crystal was observed over time. As single particle analysis only focuses on the 217
growth of a single crystal, it may not be representative of the total population of crystals. In contrast, 218
multi-particle analysis enabled the analysis of the total population of particles by examining all areas 219
of crystal growth within the field of view. Crystal growth was quantified by determining the 220
percentage of the area of the microscopic field of view that is covered by particles and by counting 221
the number of particles. Results of single and multi-particle analysis correlated with each other as 222
both found that a 0.01% (w/v) concentration of HPMC was required to observe inhibition of 223
precipitation, with maximum inhibition occurring at a concentration of 0.1% (w/v). This visual 224
method of assessing precipitation has significant potential to increase the understanding of the 225
precipitation kinetics in the intestine.
226
The μDiss system (Pion Inc.) employs UV fibre optics to obtain real-time experimental information 227
about drug solubility and dissolution. Information about drug supersaturation and precipitation can 228
also be inferred using the μDiss and can be used to study dissolution from drug powder or a 229
miniaturized disk.[28][29] Up to eight experiments can be run in parallel using volumes of media ranging 230
from 1 mL to 10 mL. This method was employed to study dissolution for a wide variety of compounds, 231
including poorly soluble drugs.[28] Palmelund et al., developed an in vitro standardized 232
supersaturation and precipitation method (SSPM) using the μDiss system.[30] High concentration 233
stock solutions of the model drugs were prepared using DMSO, and aliquots (200 µL) were added 234
15 into 10 mL of Level II FaSSIF at 37oC. The model drugs tested were albendazole, aprepitant, danazol, 235
felodipine, fenofibrate, and tadalafil. After each addition of stock solution, UV absorbance was 236
measured using the in situ UV probes for 60 minutes or, if no precipitation was observed, for longer.
237
Precipitation was detected by a shift in the baseline UV spectrum and decrease in drug 238
concentration. Plum et al., investigated the inter-lab reproducibility of the SSPM method, with 239
testing carried out at seven different sites.[31] Values obtained for three model drugs (aprepitant, 240
felodipine, fenofibrate) for apparent drug supersaturation (aDS) and the induction time for 241
detectable precipitation (tind) were compared across the various laboratories. While a direct 242
comparison for aDS and tind values between sites was not possible, it was found that 80% of the 243
partners who submitted a full data set found the same rank-ordering of drugs (aprepitant >
244
felodipine ≈ fenofibrate) when comparing β-values, which was defined as the slope of the ln(tind) 245
versus ln (aDS)-2 plot.[31]
246 247
2.3 Tests with medium and pH shifts 248
Klein et al., investigated the feasibility of creating a miniaturized transfer model system to model the 249
transition from gastric to intestinal environment.[32] Two different experimental setups were tested:
250
a 96-well plate model and a mini-paddle apparatus model. In the 96-well model experiment, the 251
drug is initially dissolved in Level 0 SGF (donor phase) before 30 µL of the donor phase is pipetted 252
into the acceptor phase, consisting of 170 µL of either Level II FaSSIF or Level II FeSSIF. Drug 253
16 concentration was measured every two minutes with a UV microplate reader. In the mini-paddle 254
setup, the drug is initially dissolved in 10 mL of Level 0 SGF and is added to 40 mL of either Level II 255
FeSSIF or Level II FaSSIF, as shown in Figure 1. Drug concentration was determined by HPLC.
256
Hydroxybutenyl-β-cyclodextrin complexes of both tamoxifen and itraconazole were tested using 257
both setups and the results were consistent between platforms; tamoxifen was not found to 258
precipitate in either setup, whereas itraconazole precipitated by approximately 90% in both 259
methods.
260 261
The Miniaturized Intrinsic Dissolution Screening (MINDISS) setup uses minidisks of compacted drug, 262
typically 2–5 mg, to deliver drug into a 96-well plate.[33] The minidisks are prepared in a custom-made 263
holder, resulting in a drug surface area of 3 mm2. Dissolution medium (0.35 mL) is added into the 264
wells and stirred. The minidisks are added to the wells such that the drug is immersed in the 265
dissolution media. After a set period of time, the minidisks are transferred into a new well. This 266
transfer into new media enables a pH shift, which may help to improve the biorelevance of the test 267
by mimicking the changing environment along the GIT.[17] Drug concentrations are determined using 268
UPLC, while Raman spectroscopy is used to analyse the solid state characteristics of the disk. The 269
disk intrinsic dissolution rates (DIDR) calculated from the MINDISS setup, were closely correlated (R2 270
= 0.9292) to larger scale drug disk dissolution tests.
271
Using the MINDISS setup, the DIDR of diclofenac sodium and diclofenac potassium in SGF, pH 1.2, 272
was found to be identical to the free acid.[33] When testing both salt forms in Level 0 SGF, a layer of 273
free diclofenac acid was formed on the surface of the disk which controlled the DIDR. This 274
17 precipitation was thought to be due to the conversion of the salt forms of the drug to the less soluble 275
free acid. A free base would be expected to demonstrate the converse behaviour i.e. to rapidly 276
dissolve in acidic gastric conditions and precipitate in the more neutral intestinal environment.
277
2.4 Two-stage tests 278
The Sirius T3 instrument (Pion Inc.) is an automated titration system as shown in Figure 2.[34]
279
Gravestock et al., used it to monitor precipitation of a wide range of acidic, basic and neutral 280
drugs.[35] It uses a fibre optic UV dip probe connected to a diode array UV spectrometer to obtain a 281
real-time measurement of drug concentration. When examining dissolution and precipitation of 282
drug, off-line sample analysis is susceptible to potential errors due to sample ageing. Real-time 283
analytical technology, by contrast, avoids such errors. Drug dissolution and precipitation in 15 mL of 284
buffered 0.15M KCl was measured at four pHs: 1.9, 3.8, 5.2 and 7.2. The pH was initially 1.9 and 285
increased every 30 minutes. The effect of pH on the dissolution and precipitation of drugs was 286
observed; dissolution rates of acidic compounds increased with increasing pH, whereas neutral 287
compounds had a relatively constant dissolution rate across the four pHs. Some basic drugs, such as 288
dipyridamole, chlorpromazine HCl and clopidogrel bisulfate, precipitated as the pH was increased.
289
Other basic drugs, such as haloperidol, maprotiline and propranolol, did not precipitate as the pH 290
was increased. Jakubiak et al. used dissolution data from the T3 to develop a dissolution and 291
precipitation model.[9] In their studies, the dissolution testing on the T3 was carried out using two 292
different pH values (pH 2 and pH 6.5) to simulate gastric and intestinal conditions respectively. Level 293
18 II FaSSIF was used for simulating the conditions in the upper small intestine, while a simple 294
phosphate buffer at pH 2 was used for simulating the conditions in the stomach. After 10 minutes at 295
pH 2, concentrated FaSSIF was added to simulate the transfer from the gastric to the intestinal 296
environment. The drug plasma profiles estimated using their model for dipyridamole and erlotinib 297
showed a strong correlation to the human in vivo plasma profile, obtained from previous clinical 298
studies.
299 300
Mathias et al., developed a micro-dissolution test to examine the effect of changing media and pH 301
on the dissolution, supersaturation and precipitation behaviour of drugs under conditions which aim 302
to replicate the transit through the GI tract, as shown in Figure 3.[36] Drug, either as powder or 303
suspension, was initially added to 7 mL of Level 0 SGF. After 20 minutes, 14 mL of a 1.5 times 304
concentrated Level II FaSSIF solution was added to simulate the changes in conditions due to transfer 305
from the stomach to the intestine. The pH of the resulting FaSSIF solution was pH 6.5 and the drug 306
was incubated for a further 160 minutes. The weakly basic drugs ketoconazole and erlotinib were 307
among the evaluated drugs using this test. Ketoconazole remained supersaturated for 55 minutes 308
upon transition from gastric to intestinal conditions, before precipitating slowly over the next 75 309
minutes. Erlotinib precipitated rapidly to its equilibrium crystalline solubility upon addition of FaSSIF.
310 311
19 2.5 Methods addressing intestinal absorption
312 313
2.5.1 Biphasic Dissolution Tests 314
A method to simulate the absorption step in dissolution tests is through the use of an organic layer 315
on top of the aqueous donor layer. Drug partitioning from the aqueous to the organic layer helps to 316
generate sink conditions in the donor layer, which can have a significant effect on drug precipitation.
317
The disadvantage of biphasic experiments is that the organic layer is in direct contact with the 318
aqueous layer; this can lead to effects which differ from in vivo drug absorption. For example, some 319
of the organic layer may be solubilised and an emulsification could occur as a result. This issue can 320
be especially pronounced if surface active compounds are present in the biphasic experiments, 321
which is rather common in bio-enabling formulations.
322
The miBldi-pH (miniscale biphasic dissolution model with pH-shift) is a small-scale biphasic 323
dissolution test which incorporates a pH shift to evaluate drug release and precipitation, as shown 324
in Figure 4.[37][38] The organic lipid layer acts as an absorptive sink as drug partitions from the aqueous 325
phase into the organic phase. The system consists of 50 mL of aqueous media covered by a 15 mL 326
octanol layer, which acts an absorptive sink, in a miniaturised USP dissolution apparatus II. Drug 327
concentration is determined by online UV-spectrometry. Frank et al., investigated the utility of this 328
system to predict the in vivo dissolution processes of two weakly basic drugs: dipyridamole and 329
BIXX.[37] Precipitation was observed for both drugs upon shift of the pH from an acidic gastric 330
environment to the neutral intestinal environment. The correlation to in vivo data for both drugs 331
20 was greatly improved using the biphasic dissolution model compared to single phase dissolution 332
experiments. A level A IVIVC (In-Vitro In-Vivo Correlation) was established (R2 = 0.95) between the 333
fraction absorbed in vivo and the fraction dissolved in octanol for the BIXX formulations tested, 334
whereas the single phase dissolution tests were not found to be predictive of in vivo performance.
335
The inForm (Pion Inc.) has also been proposed for biphasic dissolution experiments to study 336
precipitation. The inForm setup employs a fibre optic UV dip probe to measure drug concentration 337
in real time, and uses a potentiometric pH probe to monitor pH of the media in real time to 338
facilitate in situ pH control. Biphasic experiments have been carried out using the inForm on a 339
range of acidic, basic and neutral compounds using a solvent shift process.[39] Drugs were initially 340
dissolved using DMSO to prepare a concentrated stock solution and samples were added using an 341
automatic liquid handling needle into the aqueous layer. The aqueous layer consisted of 40 mL of 342
an acetate-phosphate buffer at pH 6.5, while the organic layer consisted of 30 mL of decanol. All 343
the neutral and basic drugs were found to precipitate when injected into the aqueous layer at a 344
dose level of 10 mg. Fenofibrate, a neutral compound, was added at two dose levels: 5 mg and 10 345
mg. Precipitation was observed at both dosing levels and the quantity of drug which partitioned 346
into the lipid layer, was the same after one hour. This indicated that in both cases fenofibrate 347
rapidly precipitated to its equilibrium solubility in the aqueous layer and only dissolved fenofibrate 348
was able to partition across from the aqueous into the lipid layer. To date, published data with 349
respect to biphasic dissolution experiments using the inForm setup with a pH shift is very 350
limited.[40]
351
21 2.5.2 Compartmental methods using non-cellular biomimetic membranes
352
Recently, a two chamber system has been introduced called the μFlux (Pion Inc).[41] Drug 353
concentrations in the both the donor and acceptor chambers can be measured by fibre optic UV 354
probes. A membrane separates the two chambers and a biomimetic membrane coated with lipids, 355
which is a scaled-up version of the parallel artificial membrane permeability assay (PAMPA) 356
membrane, is typically used. Uptake through the membrane into the acceptor chamber aims to 357
represent drug absorption in vivo. Incorporation of an absorption step helps to improve the 358
biorelevance compared to single chamber systems, as drug absorption can generate sink conditions 359
in the donor chamber, which is beneficial when assessing drug precipitation. Zhu et al., used the 360
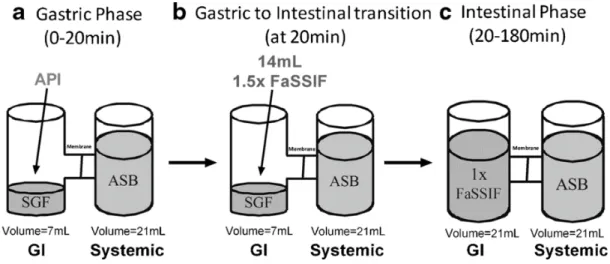
μFlux apparatus to study the effect of an increased gastric pH on the kinetic profiles of many drugs, 361
including ketoconazole and nilotinib, as shown in Figure 5.[42] Initially 400μL of drug suspension was 362
added to 7 mL of gastric fluid in the donor chamber. The pH of gastric fluid was either at pH 2 or pH 363
6, simulating typical gastric pH and acid suppression respectively. The acceptor chamber was filled 364
with 21 mL of an acceptor sink buffer (ASB). After twenty minutes, 14 mL of 1.5 times concentrated 365
Level II FaSSIF solution was added to the donor chamber and the concentrations in both chambers 366
were monitored for 160 minutes. The resulting FaSSIF solution in the donor chamber had a pH of 367
6.5. In the experiment simulating normal gastric pH, ketoconazole maintained a supersaturated state 368
for at least twenty minutes after addition of the concentrated FaSSIF and readily partitioned across 369
the membrane into the acceptor compartment. In contrast, nilotinib was only transiently 370
22 supersaturated after the addition of the FaSSIF solution in the experiment simulating normal gastric 371
pH and appeared to precipitate quickly. The smaller surface area of the biomimetic membrane 372
compared to the human intestine hampers the transfer of drug from the donor into the acceptor 373
chamber. Therefore, precipitation may be overestimated in the donor chamber. This limitation must 374
be considered when mimicking the relationship between absorption and precipitation using the 375
μFlux.
376
Sironi et al., investigated a dissolution/ permeation system using an Ussing chamber with a 377
Permeapad® acting as an intestinal barrier between the acceptor and donor side.[43] Permeapad®
378
consists of thin layer of soy phosphatidylcholine on a hydrophilic support sheet. A good correlation 379
has been found between the permeability coefficients found using Permeapad® with those found 380
using Caco-2 cells (R2 = 0.75)[44] and the PAMPA membrane (R2 = 0.76). The volume of media in donor 381
and acceptor compartments was 7 mL and 6 mL respectively. Phosphate-buffered saline (pH 7.35 - 382
7.45) was used as both acceptor and donor media. Hydrocortisone (BCS class II) suspension and 383
hydrocortisone methanolate tablets were tested using this setup. For the suspension, a constant rate 384
of permeation into the acceptor chamber was observed. This constant flux indicated that permeation 385
through the membrane was the rate limiting step. In contrast, the tablets had a variable rate of 386
permeation through the membrane for the initial three hours of the experiment. As the 387
concentration plateaued in the donor chamber approaching equilibrium solubility after three hours, a 388
linear increase of drug was subsequently observed in the acceptor chamber. The area to volume ratio 389
23 (0.25 cm2/mL) in this experiment was a limiting factor when trying to achieve a substantial decrease 390
in donor chamber drug concentrations within a reasonable period of time. The authors calculated 391
that it would take an area to volume ratio of 5.9 cm2/mL to achieve a 90% permeation of 392
hydrocortisone into the acceptor chamber within four hours. The inter-laboratory variability of these 393
biomimetic membranes needs to be further investigated. The compatibility of the Permeapad®
394
membrane with surfactants, co-solvents and biorelevant media,[45] and ability to be used over a long 395
duration, up to 94.5 hours in the experiment, are advantages compared to cellular membranes, such 396
as Caco-2. To evaluate this setup’s usefulness in assessing drug precipitation in the upper fasted small 397
intestine, further studies must be carried out incorporating a pH shift from gastric to intestinal media.
398 399
2.5.3 Compartmental methods using cellular membranes 400
401
Kobayashi et al.,[46] proposed a system for predicting drug absorption using Caco-2 cells, which also 402
accounted for the pH change from the stomach to the intestine. The drug was dissolved in a vessel that 403
simulates the stomach (pH 1.0, volume of medium 3 mL) and a pump transferred the dissolved drug to 404
a vessel (pH 6.0, volume of medium 3mL) for pH adjustment. The solution with the adjusted pH was 405
then transferred to the compartment containing the Caco-2 monolayer. The same setup was also used 406
by Sugawara et al.,[47] where additionally the effect of pH change in the “gastric vessel” (i.e. simulating 407
achlorhydria or patients administered with proton pump Inhibitors or H2-receptor antagonists) was 408
evaluated. Significant differences were found in the cumulative permeation of two albendazole 409
formulations at raised and normal gastric pH in this experiment. These results qualitatively agreed with 410
a previous rabbit study carried out using the same albendazole formulations.[48] However, the culturing 411
24 time required for the Caco-2 cells limits the throughput capacity of this method. Issues concerning the 412
poor reproducibility of results, and incompatibility with some solubilising excipients (e.g. surfactants) 413
and media (e.g. FeSSIF) also further limit the use of Caco-2 cell monolayers as intestinal barriers in 414
studies examining intestinal precipitation.[45]
415
3. Full scale methods to assess drug precipitation 416
417
In late stages of formulation development, where larger amounts of the API are available, full scale 418
methods and setups are required, in order to accurately characterise and predict the behaviour of the 419
formulation, after administration of clinically relevant doses. These full scale techniques aim to 420
evaluate the supersaturation and/ or precipitation of the drug product and to help understand the 421
effect of different excipients on its kinetics. The main goal is to link the bioavailability of the drug 422
product to the amount of drug which is in solution in the upper small intestine, where absorption 423
mainly takes place.
424 425
3.1 Compendial Apparatus and Methods 426
427
3.1.1 USP I and USP II dissolution apparatus and methods 428
The basket (USP I) and paddle (USP II) apparatus were first introduced into the United States 429
Pharmacopeia in the 1970’s for evaluating the dissolution characteristics of oral drug products.[49]
430
They have primarily been used to fulfil a QC function for testing a variety of oral dosage forms[50] and 431
provide a large volume of media for a dosage form to dissolve in a well stirred environment.[51]
432
25 Dissolution testing using either the USP I or USP II apparatus is conducted under various parameters 433
and conditions, including variations in hydrodynamics, type and volume of dissolution medium.[52]
434
Typically the volumes used in the basket/paddle apparatus range from 500-1000 mL and these large 435
volumes are often useful to generate sink conditions required to achieve complete dissolution.
436
However, they are far in excess of volumes in the human stomach and intestine, which do not 437
typically exceed 250 mL in the fasted stomach and 30-100 mL in the fasted upper small 438
intestine.[53][54]
439
The simple aqueous buffers typically used in the USP methods fail to reflect the composition of the 440
GI contents. This can lead to a misinterpretation of the in vivo dissolution profile, where 441
supersaturation, precipitation and re-dissolution might occur. Apart from the pharmacopoeial 442
buffers, different levels of biorelevant media can be used for simulating the composition of the GI 443
fluids. Biorelevant media have demonstrated advantages over compendial media when assessing 444
drug performance in vivo.[22][55][56] Wagner et al., carried out an experiment comparing the use of 445
compendial and biorelevant media with the USP II apparatus for Compound A, a basic BCS class IV 446
drug.[56] It was found to have a much greater solubility and dissolution rate constant (z value) in 447
biorelevant media representing the upper fasting intestine, compared to simple media at the same 448
pH. The STELLA® software was used to model the predicted drug plasma profiles from the dissolution 449
data and a stronger correlation to the human in vivo data was observed from the profiles predicted 450
from the dissolution experiments using biorelevant media.
451
The transfer process from the stomach through different parts of the intestine is not taken into 452
consideration when using the compendial USP I and USP II dissolution methods. This process is 453
26 important for IR formulations of weak bases, as the drug might precipitate as it enters the small 454
intestine, and MR formulations, which are commonly designed to deliver the drug to distal, as well 455
as proximal sites of the GI tract.
456
3.2 The “Dumping Test”
457
Kambayashi et al.,[57] proposed a simple pH-shift test, the so called “dumping test”, in which 50 mL 458
solutions of two weak bases, dipyridamole and ketoconazole, in 0.02 N HCl at various concentrations 459
were "dumped" into 450 mL of FaSSIF-V2. In this case, FaSSIF-V2 had higher concentration of sodium 460
taurocholate and lecithin, so after “dumping” of the drug solutions, the final concentrations of 461
sodium taurocholate and lecithin in the dissolution vessel corresponded to the composition of 462
FaSSIF-V2. The results from this in vitro setup were successfully coupled with Stella® software and a 463
predictive model for the total and dissolved concentration in small intestine for both drugs, after 464
oral administration in the fasted state was established. The advantage of this simple approach is that 465
it could be used as an early assessment and pre-screening tool for drug precipitation during early 466
stages in drug product development to facilitate the design and development of new drug products.
467
The performance of this method as a screening tool and its possible preference over the more 468
complicated transfer methods should be further investigated.
469
3.3 Compartment methods not addressing intestinal absorption 470
471
27 3.3.1 Closed Systems
472 473
It was Kostewicz et al.,[58] who first introduced the so called “transfer model”, which simulates the 474
transfer of drug from the stomach to the upper small intestine. This setup is a two compartment 475
compendial dissolution method where contents of the vessel, in which dosage form’s performance 476
under simulated gastric conditions (donor compartment) is evaluated, are transferred with a pump 477
into another vessel, where the conditions in the small intestine are simulated (acceptor compartment) 478
(Figure 6). In that study, the donor compartment containing the dissolved drug in 125 mL SGFfast was 479
transferred at a constant rate between 0.5-9.0 mL/min (values within the observed physiological range) 480
into the acceptor compartment 500mL Level II FaSSIF. The results indicated that this setup is useful in 481
predicting supersaturation and precipitation of all weakly basic compounds tested, under fasting 482
conditions. Furthermore, it was clear that gastric emptying rates may play an important role on the 483
precipitation kinetics. Such effects of the transfer rate can be considered by mathematical modelling 484
as it has been proposed for the in vitro transfer test by Arnold et al.[59] The classical transfer test was 485
here used together with an on-line particle analyser and in-line Raman spectroscopy to study the 486
kinetics of drug precipitation. A nucleation and growth model was used at two transfer rates (4 and 9 487
mL/min) and experimental results for dipyridamole were in good agreement with the model.
488
Due to the shortcomings of the initial transfer model, such as the zero order rate of drug pumping 489
from the donor compartment to the acceptor compartment, Ruff et al.,[60] attempted to optimise 490
28 the experimental conditions of the originally proposed transfer model, using ketoconazole as model 491
compound. In this study, the “average” physiological GI conditions were taken into consideration, 492
while the impact of extreme conditions was also evaluated. To reflect fasting gastric emptying 493
behaviour in vivo, a first order transfer rate with half-life of 9 minutes was used. Generally, the 494
optimised transfer model by Ruff et al. was successful in simulating the in vivo dosage form 495
performance. Nonetheless, one disadvantage of this model is that it fails to take the absorption 496
process into consideration, which might be crucial to whether precipitation occurs or not, and thus 497
also in determining drug plasma concentrations. It was concluded that this in vitro model over- 498
predicted the precipitation behaviour of ketoconazole. The authors also mention that for BCS Class 499
II compounds, which have high or moderate permeability values, in vivo precipitation may be 500
reduced due to the continuous in vivo absorption of the drug through the intestinal mucosa. This 501
may not apply to BCS Class IV drugs with low permeability characteristics, where possible 502
precipitation seriously affects the amount of drug available for absorption. To circumnavigate the 503
lack of absorption in the in vitro model, the authors coupled the results obtained with the transfer 504
model to a PBPK model, where absorption was taken into account. With this approach not only was 505
precipitation shown not to occur in the intestinal compartment, but the plasma profile was 506
accurately simulated in humans.
507
3.3.2 Open systems 508
The Artificial Stomach Duodenal (ASD) model has two chambers representing the stomach and the 509
29 duodenum. In the standard setup, the gastric and duodenal chambers have a maximum capacity of 510
400mL and 50mL respectively,[61] with fluid transfer controlled by a series of five pumps, accounting 511
for stomach and duodenal secretions and chamber emptying. The initial starting volumes in the 512
chambers, the flow rate of fresh media into the chambers and the empting rate from the chambers 513
can all be adjusted to fit the experimental requirements (e.g. in vitro modelling of fasted/fed state, 514
human or dog model).[61][62][63][64] Dilute HCl and FaSSIF are typically used as gastric and duodenal 515
fluid respectively. Dissolution is the primary process which occurs in the ASD’s gastric and duodenal 516
chambers. However, concurrent precipitation can also occur in these chambers. The ASD model has 517
been used to examine the relative bioavailability of various drugs.[61][62][65] When assessing the 518
performance of the weakly basic drug galunisertib, the ASD showed that the formulations 519
maintained supersaturation upon transition into the duodenal chamber and that no significant 520
precipitation occurred throughout the experiment (150 min).[63] In order to account for the 521
information obtained from the ASD model in the absorption modelling, a precipitation time of 11 522
hours was estimated by the GastroPlus® software. This estimate exceeds the usual small intestine 523
transit times which are observed in vivo and confirms that galunisertib could maintain 524
supersaturation in the small intestine for a longer period than 15 min, which is the default value used 525
in GastroPlus® when no experimental data are available. Combining the ASD data and other 526
biopharmaceutical results (e.g. permeability) as inputs for GastroPlus®, the simulated plasma 527
concentrated profiles for the three tablet formulations were found to have AUCs of between 90- 528
105% of the observed human clinical data. The model was able to successfully rank the in vivo 529
bioavailability of the different formulations of galunisertib used in the clinical trials. The ASD model 530
30 was also used to check the effect of gastric pH on LY2157299, a weakly basic BCS class II drug, which 531
had showed variability of absorption in early studies carried out in dogs.[64] Compared to humans, 532
dogs have a larger variability of basal gastric pHs, which can be a source of error when assessing the 533
in vivo performance of drugs with a pH dependent solubility in dogs. To model the variability in dog 534
gastric pH, experiments were carried out in the ASD using gastric fluid at pH 2 and pH 4.5, using 10-2 535
N HCl or 10-4 N HCl respectively. While the ASD model was able to qualitatively predict the effect of 536
variability of stomach pH on the bioavailability of LY2157299, it overestimated the influence of the 537
raised gastric pH on the absorption of LY2157299.
538
Takeuchi et al.,[66] evaluated the performance of a three compartment setup (Gastrointestinal 539
Simulator-GIS) for predicting in vivo dissolution and precipitation. The three compartments of the 540
GIS represent the stomach, the duodenum and the jejunum, where different buffer species, volumes 541
and pH values were used to mimic the in vivo conditions. The fluid transfer rate from the gastric to 542
the duodenal compartment was set at a first order rate with a half-life between 5-10 minutes. In this 543
particular setup, paddles were adjusted to give a high-speed burst at certain intervals to simulate 544
the contractions in the stomach and the duodenum. Gastroplus® software was used to determine 545
the in vitro gastric emptying time, which provided the best fit to in vivo data for two BCS Class I drugs, 546
propranolol and metoprolol. Overall, the GIS was able to predict the in vivo performance of the 547
investigated compounds. The GIS setup was also used by Matsui et al.,[67] to investigate the impact 548
of elevated gastric pH. When coupled with in silico modelling GIS could be useful for assessing in vivo 549
precipitation of BCS Class II weakly basic compounds, but incorporation of an absorptive site, to 550
mimic the continuous drug removal from the intestine, might be beneficial for enhancing its in vivo 551
31 predictability.
552
A slightly modified form of the GIS (mGIS), was used by Tsume et al., [68] to investigate the absorption 553
kinetics of the weakly basic drug dasatinib. In this study, the in vitro results from the dissolution 554
experiments performed in the USP apparatus II and mGIS, were coupled with Gastroplus® in order 555
to predict plasma concentrations. The predicted plasma profiles were compared with clinical data.
556
The dissolution profiles of dasatinib acquired with the USP apparatus II did not indicate precipitation 557
and resulted in absorption profiles, which did not match the human data. On the other hand, the 558
dissolution profiles acquired with the mGIS exhibited supersaturation and precipitation of dasatinib 559
and, when coupled with Gastroplus®, resulted in better plasma concentration predictions. Despite 560
the fact that the PBPK model underestimated the overall Cmax and AUC, something that could be 561
partially attributed to underestimated permeability values, the study clearly demonstrated the 562
benefit of assessing drug supersaturation and/ or precipitation with a more complex setup. Tsume 563
et al., have used also the GIS to assess the supersaturation/ precipitation kinetics of the two weakly 564
basic compounds; dipyridamole and ketoconazole.[69] For both compounds, and in accordance to 565
previous studies,[70][10][58][60] the precipitation rates observed in the intestinal compartments of GIS 566
were overestimated, most likely due to lack of an absorptive compartment. This study highlighted 567
once more the importance of accounting also for the absorption process when assessing 568
precipitation with various setups in vitro.
569
32 3.4 Compartment methods which attempt to account of absorption
570
Although models which do not account for the intestinal absorption process can be useful in 571
predicting in vivo drug supersaturation and/ or precipitation, the in vivo performance of a drug 572
product is highly dependent not only on the GI transfer, but also on other important parameters, 573
such as the intestinal permeability. As mentioned previously, for drugs with high or moderate 574
permeability values, in vitro setups can overpredict in vivo precipitation as the sink conditions 575
created by continuous removal of the drug through the gut wall are not simulated in vitro. In order 576
to account for drug absorption in the in vitro experiment, a number of models have been setup.
577
3.4.1 Using appropriate flow rates to take into account both absorption and transit process 578
These methods have been proposed primarily for evaluating products of highly permeable APIs.
579
Psachoulias et al.,[70] introduced a three-compartment setup for the prediction of intraluminal 580
precipitation of ketoconazole and dipyridamole. This setup consisted of a gastric, a duodenal and a 581
reservoir compartment. The reservoir compartment contained concentrated Level II biorelevant 582
medium with the purpose of keeping pH values, lecithin and bile salt concentrations constant in the 583
duodenal compartment, thereby compensating for the dilution that occurs when the simulating 584
33 gastric fluid is pumped into the duodenal compartment. During each experiment the volume of the 585
medium in the duodenal compartment was kept constant at 60 mL. The flow rates between the 586
compartments were regulated by a multi-channel peristaltic pump and a first order gastric emptying 587
rate of 15 minutes was used. The contents of the duodenal compartment were completely renewed 588
with fresh medium every 15 minutes. Using this experimental setup the measured in vitro duodenal 589
compartment concentrations were in line with the luminal concentrations measured in healthy 590
volunteers in a previously performed clinical studies.[10][71] Dose-dependent in vitro precipitation was 591
observed for ketoconazole. However, XRPD studies indicated differences in the solid state 592
characteristics of the precipitates; in vitro the precipitate of ketoconazole was crystalline, but in vivo 593
it was amorphous. Despite the good results presented with this methodology, the equipment is not 594
commercially available, thus restricting its application in the pharmaceutical industry.
595
Recently, Kourentas et al.,[72] introduced a new setup (Biorelevant Gatrointestinal Transfer system- 596
BioGIT) for simulating Gl transfer and assessing duodenal concentrations, drug supersaturation 597
and/or precipitation of highly permeable APIs, by using commercially available equipment. This 598
setup also consists of three compartments: gastric, duodenal and reservoir compartment (Figure 7).
599
The reservoir compartment is used for maintaining the composition of the medium in the duodenal 600
compartment constant. Gastric emptying half-life is 15 minutes. The volume of the dissolution 601
medium in the gastric compartment is 250mL (10 mL resting volume, plus 240 mL to account for 602
administration with a glass of water) and the volume of the duodenal compartment is set at 40 mL.
603
Fluid from the duodenal compartment is moved away with a constant flow rate of 11.6 mL/min, so 604
34 that the volume in the duodenal compartment is kept constant throughout the experiment. These 605
flow rate and volumetric values were estimated from luminal data previously collected from healthy 606
adults. In this study, the ability of the BioGIT model to predict intraluminal concentrations of 607
dipyridamole, ketoconazole and posaconazole was evaluated. With the BioGIT setup the 608
precipitated fraction in vivo was successfully predicted in every case.[73][74] Recently, BioGIT data 609
were successfully used for informing PBPK modelling software and predicting the plasma profile of 610
a moderately precipitating salt of weak base.[75] The method was shown to be useful for providing 611
information on the impact of GI transfer on intraluminal concentrations of drugs, which are given as 612
fast disintegrating tablets and capsules, dispersions or solutions. However, one should note here, 613
that BioGIT has been designed to simulate intraluminal concentrations of highly permeable drugs, 614
after administration in the fasted state. Therefore, flow rates might need to be adjusted to simulate 615
concentrations of drugs with different permeability characteristics.[76] Evaluation of intra- and inter- 616
laboratory reproducibility of BioGIT data is currently in process.[77]
617
Utilising a similar approach, based on the compendial dissolution apparatus II, Gu et al.,[78] described 618
a multi-compartmental model with 4 compartments, comprising of a gastric, intestinal, absorption 619
and a reservoir compartment, to maintain the composition in the intestinal compartment (Figure 8).
620
The novelty of this setup was the addition of the “absorption compartment”, to simulate the uptake 621
of drug across the intestinal membrane. All compartments were placed in a water bath at 37°C 622
temperature and the pH in each vessel was maintained at a constant value. The drug was transferred 623
with different flow rates between the compartments, the volumes of which were kept constant and 624
35 controlled by a peristaltic pump. Vessel 1 contained 250 mL of dissolution medium in order to 625
simulate the available volume of gastric fluids in the stomach in the fasted state. Vessel 2 contained 626
250 mL of dissolution medium, simulating the composition of the upper small intestine, and after 627
the inflow from vessel 1 for one hour the volume in vessel 2 increased to 500 mL. Vessel 3 contained 628
600mL of ethanol and 100 mL of 0.1 N HCl solution in order to maintain drug concentrations below 629
their solubility values throughout the experiment. In this study, the precipitation kinetics of two 630
weak bases, cinnarizine and dipyridamole was investigated. It was concluded that this method could 631
successfully predict drug precipitation in the lumen, and the results from this multi-compartmental 632
system correlated better with the in vivo data compared with the conventional dissolution methods.
633
Cinnarizine and dipyridamole were found to have significantly different precipitation characteristics, 634
despite both being fully dissolved at gastric pH. Approximately 40% of the cinnarizine was found to 635
precipitate in the intestinal vessel compared to <10% of the dipyridamole dose. The setup from Gu 636
et al., simulates the absorption process in a simple dissolution apparatus and no complex 637
additions/methods are needed. Furthermore, the flow rates between the intestinal and absorption 638
compartments can be adjusted to reflect different permeability values, thus facilitating its use in the 639
investigation of precipitation kinetics for APIs with different permeability properties. However, the 640
remaining challenge of this setup is that it is difficult to adjust the flow rates to the absorption 641
compartment so that they would correlate with in vivo permeability values.
642
Mitra et al.,[8] proposed yet another setup to simulate the dynamic environment of the GIT; the 643
“simulated stomach duodenum” model (SSD) (Figure 9). The SSD model was modelled after the 644
system described by Carino et al.,[62] (section 3.3.2) and it is a four compartment model, where the 645
36 removal of drug from the duodenum is also taken into account. The study explored the ability of the 646
SSD to predict the supersaturation of different dose strengths of dipyridamole under fasted 647
conditions, as well as to investigate the impact of different surfactants, which are commonly used in 648
oral preparations. In the SSD model, basal volumes in both gastric and duodenal compartment were 649
used, based on mean fluid volumes previously reported in clinical studies in fasted adults. The basal 650
gastric volume was set at 50 mL and the duodenal at 30 mL. The gastric emptying was simulated by 651
a first order pattern with a half-life of 15 minutes, until the basal gastric volume was restored.
652
Afterwards, the gastric emptying was kept constant at 1.7 mL/min. The setup was able to predict the 653
supersaturation kinetics of dipyridamole, when compared to in vivo data. Furthermore, the effect of 654
different surfactants commonly used in oral preparations, as well as the effect of different gastric 655
emptying patterns on dipyridamole supersaturation was investigated. The SSD model provided good 656
correlation of the amount of drug in solution in the duodenal compartment of the SSD to the 657
bioavailability of different dosage strengths of dipyridamole in vivo. However, again in this setup 658
does not take into account the application of different flow rates to adjust for low permeability 659
values. Furthermore, the SSD model is not based on a commercially available setup, such as the USP 660
II dissolution apparatus, and agitation is performed using magnetic stirrers at 200 rpm, which entails 661
hydrodynamics that are less reproducible and not physiologically relevant. In order to investigate its 662
usefulness in predicting drug precipitation, more studies with different compounds are needed.
663
Another multicompartment method incorporating a chamber simulating the systemic circulation was 664
37 proposed by Selen et al.[79] The FloVitro™ (Dow Chemicals) is a three compartment system with 665
chambers simulating the gastric, intestinal and systemic compartments (cells) and flow rates between 666
cells. The fluid volume in the cells varies depending on the compound tested; typically 40 mL in the 667
gastric cell, 200 mL in the intestinal cell and 1 - 2 L in the systemic cell are used. The primary use of the 668
FloVitro™ has been to predict the in vivo plasma profile based on the profile which is achieved in the 669
systemic cell by using a variety of drugs, including: ibuprofen, furosemide, paracetamol and doxycycline 670
hydrochloride.[79][80] The effect of fed or fasted state media has also been examined on the dissolution 671
profiles of danazol and furosemide.[81] However, there have not been any publications to date 672
illustrating its application to precipitation of poorly soluble weak bases and further studies will need to 673
be undertaken.
674 675
3.4.2 Simulating the intestinal epithelial barrier 676
Ginski et al., [82] proposed a “two-step” dissolution/Caco-2 system with the aim of simulating 677
simultaneous dissolution and absorption in the GIT. This would enable prediction of the dissolution- 678
absorption relationship for different compounds and allow a comparison with results from clinical 679
studies. This continuous system consisted of a dissolution apparatus and a side-by-side diffusion cell.
680
The drug is dissolved in the dissolution compartment and, after a filtration with a 10 μm filter, is 681
transferred with a pump to a donor compartment, containing the Caco-2 monolayer. In this 682
particular study, fast and slow dissolving formulations of piroxicam, metoprolol tartrate and 683
ranitidine hydrochloride were tested. Generally, this two-step setup was able to reflect the 684
![Figure 1: Schematic of miniaturized transfer model system proposed by Klein et al. [32] Reproduced 1198](https://thumb-eu.123doks.com/thumbv2/pdfplayerco/302121.42037/69.918.93.703.252.639/figure-schematic-miniaturized-transfer-model-proposed-klein-reproduced.webp)
![Figure 2: Schematic of the Sirius T3 instrument. [34] Reproduced with permission from Springer](https://thumb-eu.123doks.com/thumbv2/pdfplayerco/302121.42037/70.918.209.664.164.642/figure-schematic-sirius-t3-instrument-reproduced-permission-springer.webp)
![Figure 3: Schematic of the experiment carried out by Mathias et al. [36] Reprinted (adapted) with 1204](https://thumb-eu.123doks.com/thumbv2/pdfplayerco/302121.42037/71.918.107.586.168.450/figure-schematic-experiment-carried-mathias-reprinted-adapted-1204.webp)
![Figure 4: Schematic of the miBldi-pH apparatus. [38] Reproduced with permission from Elsevier](https://thumb-eu.123doks.com/thumbv2/pdfplayerco/302121.42037/72.918.144.696.177.630/figure-schematic-mibldi-ph-apparatus-reproduced-permission-elsevier.webp)
![Figure 6: The “transfer model” proposed by Ruff et al. [60] Reproduced with permission from Elsevier](https://thumb-eu.123doks.com/thumbv2/pdfplayerco/302121.42037/74.918.246.617.167.485/figure-transfer-model-proposed-ruff-reproduced-permission-elsevier.webp)
![Figure 7: The BioGIT system proposed by Kourentas et al. [72] F 1 and F 2 are the incoming flow rates and 1218](https://thumb-eu.123doks.com/thumbv2/pdfplayerco/302121.42037/75.918.233.656.210.494/figure-biogit-proposed-kourentas-incoming-flow-rates-1218.webp)
![Figure 8: Multicompartment dissolution system by Gu et al. [78] Vessel 1 “gastric” compartment 1221](https://thumb-eu.123doks.com/thumbv2/pdfplayerco/302121.42037/76.918.132.511.188.440/figure-multicompartment-dissolution-system-vessel-gastric-compartment-1221.webp)

![Figure 10: Schematic of the apparatus used by Hate et al. [97] The hollow fibre membrane is 1231](https://thumb-eu.123doks.com/thumbv2/pdfplayerco/302121.42037/78.918.237.651.201.628/figure-schematic-apparatus-used-hate-hollow-fibre-membrane.webp)
