The purpose of this article is to analyze the pattern of regional relocation of production in Slovenia after trade liberalization with the EU. More specifically, in the first phase of trade liberalization, a divergence (convergence) in relative wages and output is likely, but afterwards it may turn into convergence (divergence).
Trade liberalization and trade performance
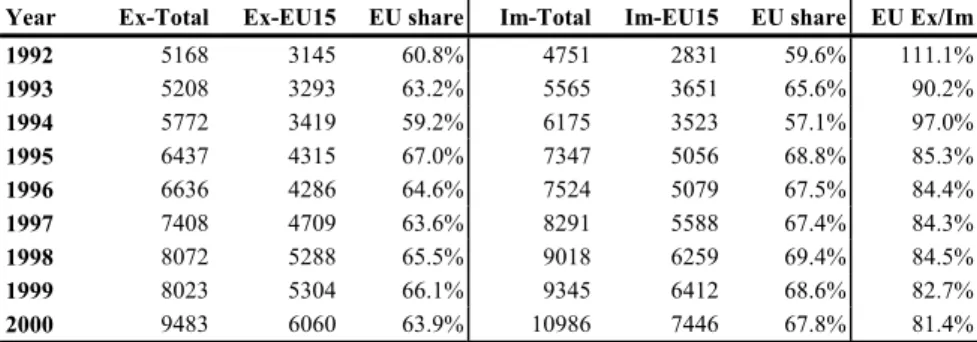
Apart from Germany, which is Slovenia's largest individual trading partner (about 30 percent of exports), Slovenia's trade with the EU is characterized by large trade deficits. This may of course indicate a deterioration in the competitiveness of Slovenia's exports on EU markets.
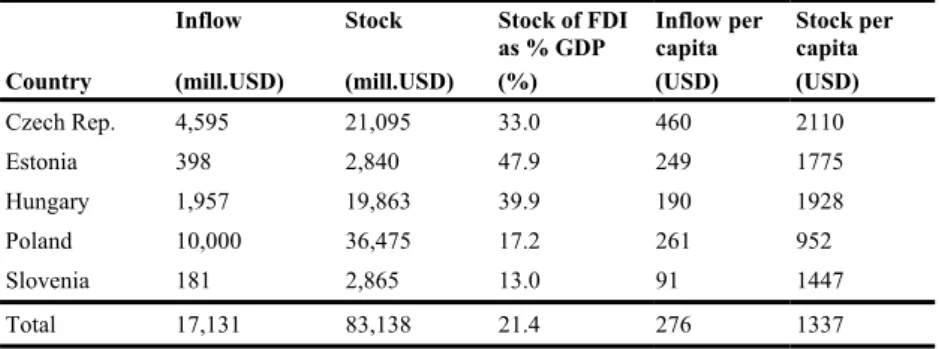
Foreign direct investment
The most important question is, therefore, how to increase the export competitiveness of Slovenian products on EU markets. Nevertheless, for the second part of the transition in Slovenia, we can detect significant shifts in the migration of production activities between regions.
Pattern of Regional Manufacturing Activity
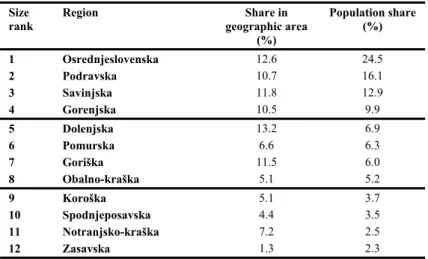
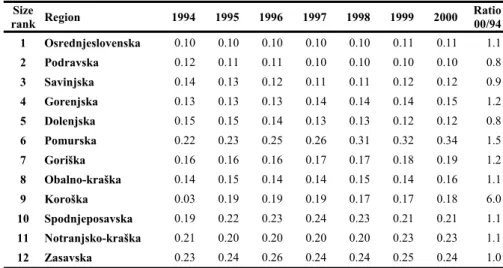
Distribution of regions by population size
This indicates that knowledge, in the form of transfer of technology, transfer of managerial skills, use of intangible assets in the parent company and more effective corporate management, has been transferred to local firms. Since data for the first transition period are missing, it is unlikely that we will be able to uncover the entire process of changes in the regional specialization pattern caused by integration with the EU.
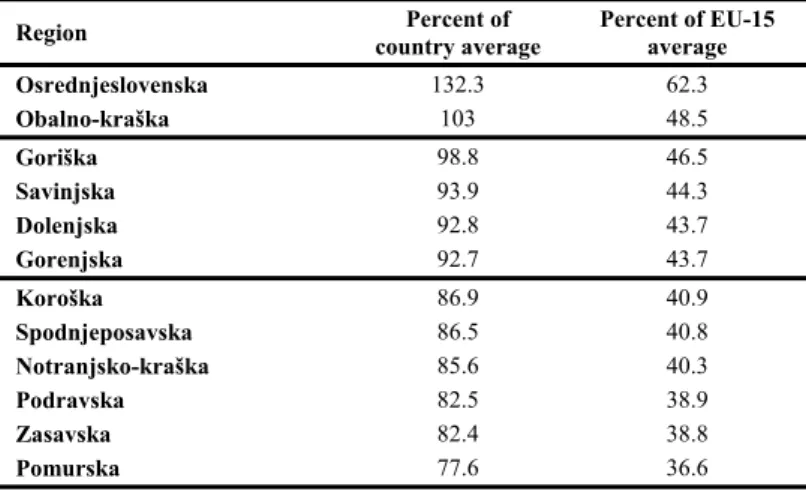
Regional GDP per capita disparities
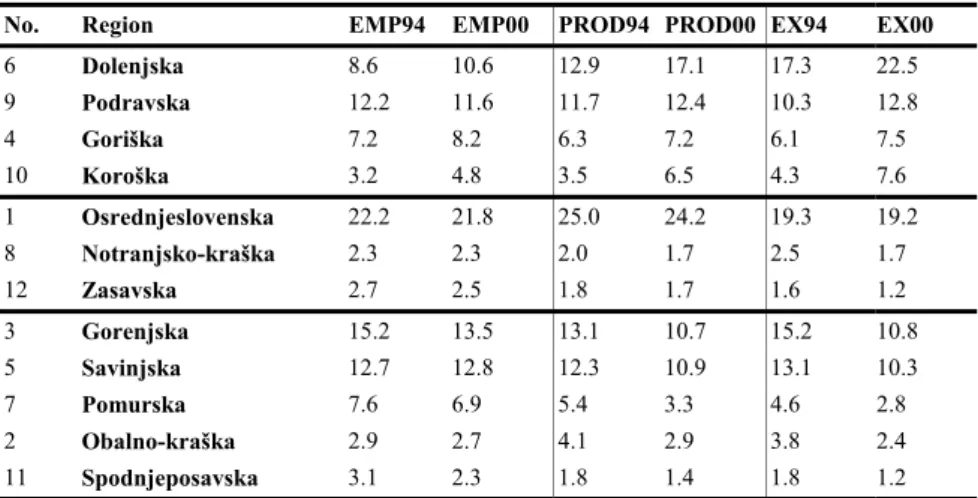
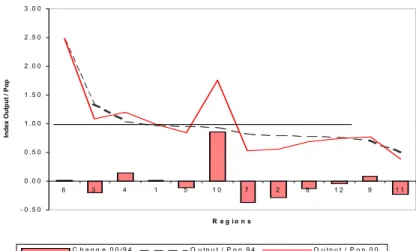
Relocation patterns of manufacturing activity
Some regions, where there was a deterioration in production activity (eg the Coastal-Karst region, etc.), actually restructured their economic activity into service activities (tourism, transport, telecommunications, trade activity, etc.). Therefore, despite the relative decline in manufacturing activity, some regions have significantly caught up in terms of GDP per capita.
Changes in regional specialization in manufacturing
Regional concentration of manufacturing employment
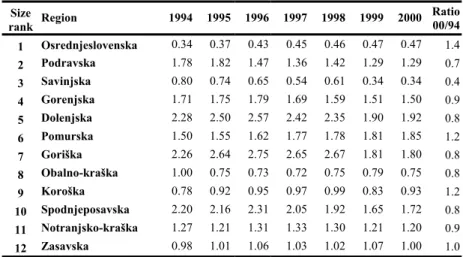
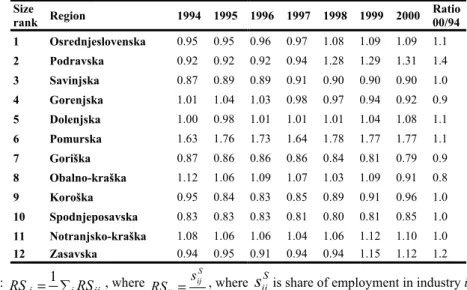
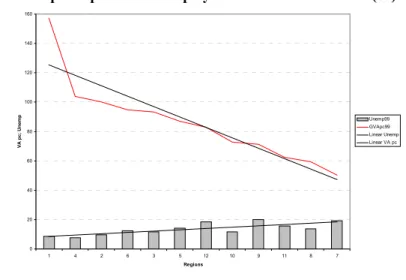
The lowest level of regional specialization is in the largest regions (Central Slovenia and Podravina), and the highest in the smallest regions (Spodnjeposavska and Zasavska) and the Pomurska region. However, there is little evidence of increased regional specialization of manufacturing employment in the period 1994–2000.
Regional concentration of manufacturing output and exports
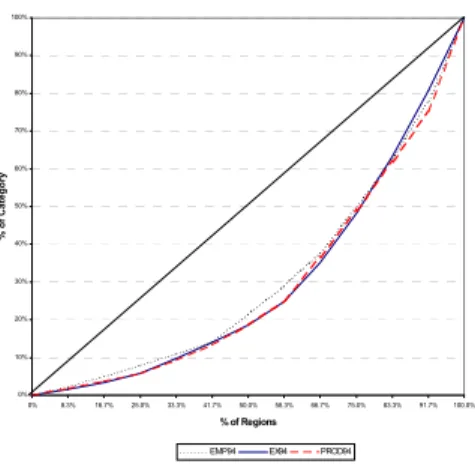
The final evidence about the pattern of regional specialization will be shown using Lorenz curves. The greater the share of the largest regions in some variable across sectors, the more Lorenz curve will shift away from the diagonal. Figures 8.3 and 8.4 indeed show much larger responses in manufacturing output and exports to increased integration with the EU during the 1990s than was the case with manufacturing employment.
The result of this is the shift of manufacturing activities between regions and thus higher regional specialization. At the beginning of the observed period, in 1994, the concentration of manufacturing employment, output and exports did not differ significantly across regions. However, at the end of the period, in 2000, the concentration of manufacturing output and exports increased significantly, while the concentration of employment remained virtually unchanged.
This means that only production and exports in the different regions have adapted to the changed demand pattern, and employment has yet to follow this pattern.
Evolution of the Manufacturing Structure (1994-2000)
Evolution of Industrial Specialization
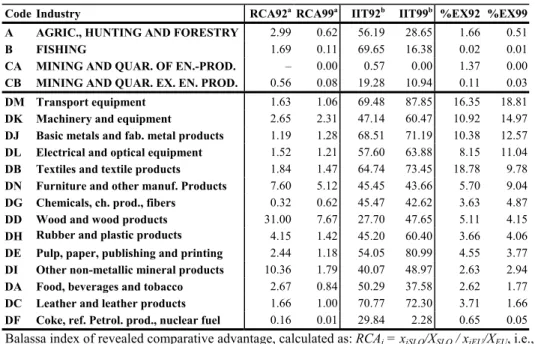
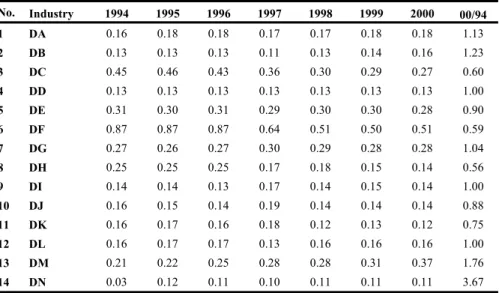
The evolution of the Herfindahl indices of geographical concentration in the period 1994-2000 reveals that the two most concentrated industries, namely fuel and leather products, have been dispersed after economic integration with the EU. On the other hand, the transportation equipment and furniture industries have been further consolidated as a result of trade liberalization, leading to an increase in geographic concentration. The Balassa Index, a relative measure of geographic concentration, compares the geographic concentration of employment in an industry to the geographic concentration of total employment.
Thus, a value of the Balassa index for industry i greater than one indicates that the geographic concentration of that industry is greater than the geographic concentration of total manufacturing. The Krugman inequality indices, which show the difference between the regional share of employment in an industry and the average (national) share of that industry's employment, are presented in Table 8.13. Krugman indices close to zero therefore imply that the regional structure of manufacturing employment in all industries is very similar to that of the average national structure, while higher values of the indices imply that the regional employment structures differ greatly from the national levels.
The results in Table 8.13 show that the dissimilarity index has increased in seven of the 14 industries, most notably in the textile industry (DB), the transport equipment industry (DM) and the furniture industry (DN), while it has decreased in six industries. . DSR , where is the share of employment of region j in industry i in the total employment of industry i, and s.
Does greater specialization imply greater polarization?
Do declining regions experience higher unemployment?
After the discussion in the introductory part, in the present part we evaluate the consequences of EG models for Slovenia. With interregional transport costs unchanged, regions located closer to the EU border (western and northern regions) could benefit from trade liberalization through higher FDI inflows due to lower trade costs with the EU and lower wages. As a result, border regions can approximate the home capital region in terms of relative wages and relative manufacturing output.
Once a certain threshold of trade costs with the EU has been reached, the trend towards convergence of border regions can be reversed. Therefore, regional data for member countries may exhibit an inverted U-shaped relationship between relative FDI, relative wages, and relative manufacturing output relative to foreign trade costs. This process can also be reversed when agglomeration effects in existing economic centers prevail over lower factor costs and lower trade costs in border regions.
In this case, a divergence in relative regional wages is expected in the first phase of trade liberalization and a convergence afterwards. In any case, a non-monotonic relationship between the reduction of foreign trade costs and regional relative wages is expected to occur in the long run.
Methodology and data
The Data
The Methodology
Impact of Economic Geography on regional economic concentration
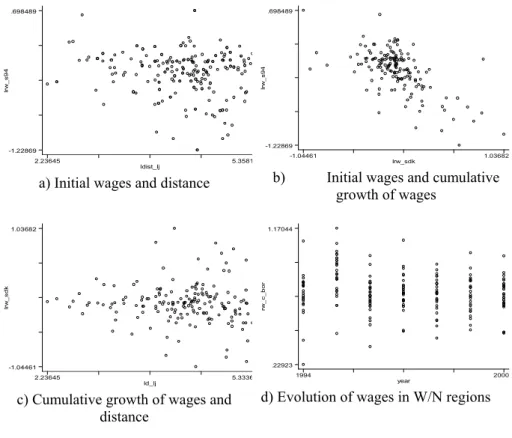
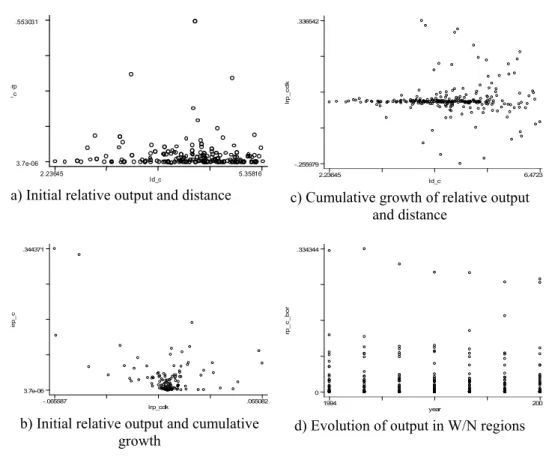
In addition, the Damijan-Kostevc EG model predicts an even more pronounced U-shaped pattern of relative regional output displacement, as direct FDI to regions bordering the EU promotes faster adjustment in the EU border areas. In contrast, the figure suggests an inverse relationship between initial relative regional output and distance to the capital. Additionally, Figure 8.7c shows that there is no convergence/divergence path for relative regional production with respect to distance from the capital, and Figure 8.7d shows no convergence in western/northern border regions (W/N).
The pattern of relative regional production relocation has been estimated using the following linear model: 3. FDI is the share of aggregated FDI in employment in the region i, TC is the region's average tariff4 as a proxy for foreign trade costs. The results in Table 8.15 suggest that both year-to-year changes and a cumulative long-term change in relative output are negatively correlated with initial relative output in the region, implying convergence with respect to the central region.
This fact, in contrast to the autoregressive convergence path, speaks in favor of divergence in relative regional production. Regions with higher relative shares of FDI converge faster to the capital city region in terms of relative output.
Impact of Economic Geography on regional distribution of FDI
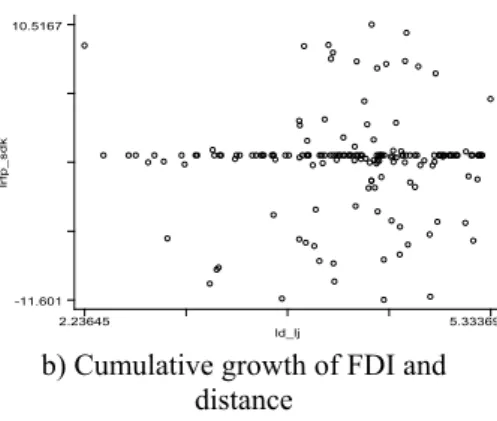
On the other hand, some convincing evidence is found in all model specifications that manufacturing concentration in Slovenia is positively correlated with the presence of foreign direct investment. Furthermore, W/N border regions do not appear to gain or lose from trade integration with the EU. As with the first test, the results in Table 8.16 provide little evidence in favor of the economic geography hypothesis.
FDI in Slovenia does not tend to concentrate in regions closer to the capital region (distance does not matter) or to EU borders (W/N border regions do not attract more FDI). It is shown that relative foreign direct investment is strongly negatively correlated with relative output and initial foreign direct investment, meaning that existing economic centers tend to attract relatively less foreign direct investment.7 Differences in relative factor costs (wages) see however, also not likely to attract more foreign direct investment. In summary, FDI in Slovenia does not seem to work according to the economic geography models.
Therefore, the impact of FDI on the relocation of production and relative wages is less than has been predicted by Damijan and Kostevc (2002). It is clear that regional FDI in Slovenia is more likely to be distributed randomly than distributed according to EG models.
Impact of Economic Geography on relative wages
The figure reveals increased dispersion of the cumulative growth in relative regional wages with distance to the capital, but no significant trend can be depicted. This fact confirms the predictions of the Krugman-Venables type of EG models, while the predictions of the simple Krugman (1991) type of EG models (monotonically decreasing relative wages) are rejected. One explanation for the lack of evidence in favor of the Damijan-Kostevc EG model, which emphasizes the importance of FDI, is the minor role of FDI in the "Slovenian transition mode".
In the first part of the paper, we found a clear pattern of regional relocation of manufacturing activities in Slovenia in terms of manufacturing output and exports. There is little evidence of the shift of employment and population between regions, suggesting that declining regions face higher unemployment rates. The second part of the present paper attempts to test whether regional development in Slovenia after integration with the EU is progressing according to the predictions of the EC theory.
However, formal tests find little evidence in favor of any of the competing EC hypotheses. Only in the case of relative regional wages in the western/northern regions have indications been found in favor of the U-shaped wage development. There are two basic explanations for the lack of evidence in favor of either. economic geography models for Slovenia.
However, it remains to be seen whether the predictions from the economic geography models better fit the data for other transition countries that are larger and have regional production structures that have been more severely affected by integration with the EU.