Review and Analysis 2002
THE HUNGARIAN LABOUR MARKET
REVIEW AND ANALYSIS
2002
Edit ed by
K ároly Fa zek as and Jenő Koltay
Ins titute of Economics, HAS Hungarian Employment Foundation Budapes t, 2002
National Employment Foundation
Translators: Fruzsina Balkay (Labour Market in Hungary) Patricia Austin (In Focus)
Design, page layout: socio-typo
Typography: Franklin Gothic, Garamond Printing: Oliton
© Institute of Economics, HAS; National Employment Foundation, 2002
The publication of this volume has been financially supported by the OFA, Employment Promotion Public Benefit Company
ISBN 963 9321 59 1
Copies of the book can be ordered by e-mail or post from the Institute of Economics
Address: Budaörsi út 45., H-1112 Budapest, Hungary Mailing address: H-1502 Budapest, P.O. Box 262 Telephone: (+36-1) 309 26 51
Fax: (+36-1) 319 31 51 E-mail: titkarsag@econ.core.hu Web: http://www.econ.core.hu
Foreword by the Editors ... 9
Labour Market in Hungary (Teréz Laky) ... 11
Introduction ... 13
1. Labour Force Participation ... 14
2. Main Labour Market Trends ... 19
2.1 Total Employment ... 19
2.2 Sectors and Branches ... 22
3. Unemployment ... 26
4. Economic Inactivity ... 32
In Focus: I. Wages: A Decade of Transformation (edited by Jenõ Koltay and János Köllõ)... 37
Introduction ... 39
1. Basic Facts ... 41
1.1 Real Wages and Earnings Inequalities (János Köllõ, Erzsébet Eperjesi Lindner)... 42
1.2 Factors Distorting Observations ... 47
Average Wage Hikes and Wage Inflation: What Published Wage Indices (Don’t) Measure (Barnabás Ferenczi)... 48
Differences in Company-Supplied and Self-Reported Earnings Data (Gábor Kézdi)... 51
2. Wage Setting: Institutions and Practices ... 54
2.1 The Wage Setting System (Jenõ Koltay) ...54
Central Level: Tripartite Agreements Replace Wage Control ... 55
Intermediate Level: Unfounded Expectations ... 58
Company Level: Wage Bargaining and Employers’ Wage Decisions ... 59
Hungarian Peculiarities: Decentralised Wage Setting with Signs of Corporatism and Paternalism ... 61
2.2 Wage-Setting Practices – Some Indirect Observations (János Köllõ)... 63
3. Evolution of Wages by Major Groups of Labour ... 70
3.1 Earnings Differences by Gender (János Köllõ)... 70
of Human Capital (János Köllõ)... 73
3.3 Regional Differences in Earnings and Wage Costs (János Köllõ)... 77
4. Wage Evolution by Economic Sector ... 82
4.1 Business Sector (János Köllõ)... 82
4.2 Sectors by Ownership (János Köllõ)... 86
4.3 Business Sector and Budgetary Institutions (Gábor Kézdi)... 92
Employment and Average Earnings ... 93
Components of Earnings Differentials ... 94
Consequences ... 97
4.4 Informal Economy (Endre Sik)... 98
5. Inequalities in Earnings and Income (Péter Szivós, Márton Medgyesi)... 102
5.1 Inequalities of Earnings and Incomes ... 103
5.2 Income Patterns ... 105
5.3 Relationship Between Earnings Level and Household Incomes ... 109
6. Wages – Closing the Gap between Hungary and Europe (Barnabás Ferenczi)... 114
6.1 The Point of Departure ... 114
6.2 Expectations ... 114
The Convergence of Producer Wage Costs ... 117
Convergence of Real Exchange Rates and Consumer Real Wages ...119
7. Endnotes ... 122
8. References ... 127
In Focus: II. Income Support for the Jobless (edited by R. István Gábor and Gyula Nagy)... 131
Introduction ... 133
1. Unemployment Benefit Systems in Advanced Market Economies and in the Post-Socialist Transition ... 133
1.1 The Economic Principles of Income Support for the Unemployed (János Köllõ)... 133
1.2 Unemployment Benefits in Advanced Countries: Eligibility Rules and Benefit Levels (Mária Frey)... 138
Type of Income Support for the Unemployed ... 138
Conditions of Entitlement for Unemployment Benefits, and Benefit levels ... 140
Comparing Entitlement Conditions ... 145
1.3 Eligibility Criteria for Unemployment Benefits in Advanced Countries (Ágota Scharle) ... 147
Cross-country Variation in Eligibility Requirements ... 147
The Effects of Strict Eligibility Requirements on Unemployment ... 149
1.4 Problems with Unemployment Benefits in the Post-Socialist Transition (János Köllõ)... 150
Systems in Hungary ... 158
2.1 Unemployment Benefits: Forms, Eligibility Criteria, and Amounts (Gyula Nagy)... 158
The Unemployment Insurance Benefit ... 158
Unemployment Assistance ... 162
2.2 Financing Unemployment Benefits (Mária Frey)... 163
3. Targeting Income Support for the Unemployed ... 170
3.1 The Number and Characteristics of Benefit Recipients (György Lázár)... 170
3.2 The Generosity and Targeting of Unemployment Benefits (Gyula Nagy)... 174
Chances of Receiving Benefit ... 174
The Benefit-Wage Ratio ... 177
Targeting Benefits ... 180
3.3 Eligibility Requirements for the Unemployment Insurance Benefit (Tünde Kóródy Koltay)... 181
Sanctions for Non-compliance ... 181
Current Practice in Applying Sanctions ... 182
Monitoring and Sanctioning in Vas County ... 184
3.4 Career Beginners Assistance (György Lázár)... 186
3.5 Change of Labour Market Status Following the Exhaustion of UI Entitlement (György Lázár)... 189
3.6 Pre-pension Schemes for the Unemployed (Ágota Scharle)... 183
4. The Disincentive and Income Effects of Unemployment Benefits ... 197
4.1 The Disincentive and Re-employment Effects of Unemployment Benefits (Péter Galasi, János Köllõ)... 197
4.2 Selected Characteristics of Unemployment Assistance Recipients in 1994 (Péter Szivós)... 201
4.3 The Share of Unemployment Benefits Within Household Incomes (Péter Szivós, András Gábos)... 206
The Structure of Household Incomes ... 206
The Relative Living Standards of Households with an Unemployed Member ... 208
The Share of Unemployment Benefits in Household Income ... 210
Typical Combinations of Unemployment Benefits with Other Source of Income ... 213
5. Recent Changes in the Unemployment Benefit System: Responses and Implications ... 214
5.1 Public Opinions on Changes in the Unemployment Benefit System in 2000 (János Köllõ)... 214
5.2 Criteria for Benefit Entitlement and Chances of Re-employment (Péter Galasi, Gyula Nagy)... 221
as of February 2000 ... 221
The Sample ... 223
Outflows and the Probability of Re-employment ... 224
People Who Worked 44–48 Months in the Preceding Four Years .... 224
People Who Worked 24–43 Months in the Preceding Four Years .... 227
People Who Worked 12–13 Months or Less in the Preceding Four Years ... 228
5.3 The Effect of the Unemployment Insurance Benefit on Individual Chances of Re-employment (János Köllõ)... 229
Alternative Methods for Measuring Benefit Amounts ... 231
The Effect of Benefits on Exit Probabilities... 234
Sensitivity Test ... 237
5.4 Assistance Recipients and Re-employment Following the Exhaustion of Unemployment Insurance Entitlement(Péter Galasi, Gyula Nagy).... 242
Basic Characteristics of the Sample ... 242
Receipt of Means-tested Unemployment Assistance after Exhaustion of Insurance Benefit ... 245
Re-employment After Exhaustion of Benefit ... 247
5.5 Local Government Practices of Providing Income Support and Public Works for the Working Age Unemployed (Károly Fazekas)... 254
Investigation Results ... 255
6. References ... 264
Statistical Data (Edited by Károly Fazekas, János Köllõ, Judit Lakatos, György Lázár)... 267
Index of Tables and Figures ... 350
The goal of our labour market yearbooks is to review the main develop- ments in the Hungarian labour market and to give an in-depth analysis of key issues. The subsequent chapters present “stylised facts” and recent re- search results together with their shortcomings. Our further intention is to guide readers in finding other relevant publications and reliable statistical sources. The contributions related to the selected themes: wages and in- comes support to the jobless give analyses on institutions, rules and market forces that shape wages, or unemployment benefits and look at resulting costs and revenue changes that have occurred over a decade. Last but not least we consider some open questions, and review problems of interpreta- tion and methodology.
The variety of subjects precludes a work with a uniform theoretical frame- work organised around one (or even several) contentious issues. However, if it fails to offer competing attempts to explain the various problems or the struggling efforts to interpret facts – in other words, if it does not help in figuring out what to do with the data presented – that is because of short- comings in Hungarian research itself. Often there are only one or two re- searchers working on a subject area, and empirical investigations have some- times had to do without the control of theory, while theoretical analyses have sometimes been developed in the absence of a fact-based hinterland.
We do not intend to offer any economic or social policy recommenda- tions but would instead prefer to promote dialogue between science and policy, by re-wording research findings in a manner that is comprehensible to a broader audience – and by underlining the areas still to be researched.
The closing chapter presenting selected statistical data gives comprehen- sive information on the main economic developments, demographic trends, labour market participation, employment and unemployment, inactivity, wages, education, labour demand and supply, spatial disparities, migra- tion, commuting, labour relations, together with some international com- parisons. Data series are presented on wage and income differentials as well as on the territorial dimension of labour market developments at lower levels of governments and spatial units.
by Teréz Laky
INTRODUCTION*
Despite its growing integration into the global economy, in 2000 the Hun- garian economy has not yet felt the effects of decelerating global growth.
The economy indeed showed dynamic development. The Hungarian gross national product increased by 5.2 percent, which exceeded the growth rates of many developed countries, implying gradual recovery from the substan- tial decline and losses incurred at the beginning of the decade, at the time of the collapse of the COMECON market. Gross earnings increased some- what faster than inflation, by 13.5 percent, and the monthly average earn- ings of those employed in companies with 5 or more employees and in public companies – representing the large majority of earners – was HUF 87,645 on average (HUF 61,930 for blue collar and HUF 121,779 for white collar workers) in 2000. However, with inflation being just below 10 percent, real earnings increased by 1.5 percent only, that is, at a slower pace than in any of the preceding three years.
Despite healthy growth in the economy total employment showed little improvement in 2000. Although the unemployment rate declined, the share of the economically inactive, that is, those not in employment, not looking for a job nor registered as unemployed, remained very high. In European comparison, despite the growth of total employment by some 37 thousand and the decline in registered unemployment by some 19 thousand, the Hungarian labour market is still closer to the less developed countries of the European Union.
In what follows, we shall review two aspects of the Hungarian labour market in 2000: a) domestic trends and b) adjustment to international trends, with special regard to those within the European Union.
As in many other countries, there are two systems of labour force ac- counting in Hungary: one based on national legislation and another one conforming to requirements of international comparison.1 We shall assess the labour market situation by both measures, focusing on demographic and economic conditions in 1999 and 2000, and, wherever possible, com- pare data to long-term trends. Though important, we shall only make a
* At the time when writing this chapter comprehensive data were available up to year 2000.
1 National regulations are essen- tially acts and legal regulations passed by Parliament reflecting the traditions and prevailing norms of a country. These cover many factors: the definition of working age in the given coun- try (as well as the conditions of- fered by the pension system);
rules codified by labour law (such as daily, weekly, and annual hours of working); employee benefits (ranging from a leave to look after children to rules of giv- ing notice). The factors that are commonly considered in interna- tional comparisons tend to be those that are applicable to most of the national regulations. To date, it is the recommendations of the International Labour Or- ganisation (ILO), based on the (so-called tripartite) agreement of employers, employees and gov- ernments, that represent the common standards which the community of nations accept and use for international comparisons all over the world.
passing reference to some recent organisational and legislative changes which are expected to have a marked influence on the labour market over the coming years (such as changes in the management of employment policy taking effect from mid-2000; the transfer of employment policy develop- ment and decision-making competencies concerning the allocation of the Unemployment Insurance Fund from the Ministry of Social and Family Affairs to the Ministry of Economic Affairs; and new regulations coming into force with the amendment of the Employment Act, with special re- gard to the reduction of the entitlement period of the Unemployment In- surance Benefit and the abolition of the means-tested Unemployment As- sistance), as these are discussed and assessed in detail later in the present volume. Other measures introduced in 2001 and 2002 (e.g., the govern- ment initiated spectacular rise of the minimum wage or the reform of gov- ernment structures) related to the labour market remain out of the scope of this review.
1. LABOUR FORCE PARTICIPATION – A EUROPEAN COMPARISON In developed countries all over the world, raising participation and restor- ing full employment has become a prime political, social and economic objective. On 1 January 2000, the total population in Hungary approached ten million, out of which 6.2 million were of working age – some 90 thou- sand more than one year earlier. The working age population continued to increase during the year by 60 thousand (according to the CSO Labour Account) and reached 6,267 thousand (annual average based on the CSO Labour Force Survey). The increase was due, in addition to demographic developments, to successive increases in the retirement age started in 1997, as a result of which women aged 57 and men aged 61 remained in the working-age category in 2000. (Despite the recent extensions, current Hungarian working-age limits – 61 for men and 57 for women – are still low compared to those in Europe, where the upper age limit is generally 64 years for both men and women. International comparisons are based on the 15–64 year age group, irrespective of national regulations.)2
It is commonly observed that, with few exceptions, participation rates tend to be higher in richer and more developed economies. This is what high levels of employment suggest in the US (74 percent) and in most EU member states as well, as in Denmark (76 percent), in the Netherlands, in Sweden and in the United Kingdom (above 70 percent) and in Austria (near 70 percent). (One exception is Portugal, which, though not one of the richest countries, still boasts a level of employment on a par with Aus- tria.) The other extreme is represented by the less developed countries of the European Union, where the level of total employment barely exceeds
2 The ILO recommendation is that 74 should be the upper limit, because in many countries of the world, as a result of the increase in life expectancy, a significant proportion of the population would like to work after reach- ing pension age. Therefore, la- bour force surveys (LFS) carried out for the purpose of interna- tional comparison by uniform principles and methods in all countries, consider as potential labour supply the population aged 15–74. The CSO Labour Force Survey conforms to these principles in every respect. Data pertaining to the 15–64 year-old are derived from this larger popu- lation. In Hungary, in 2000, the population aged 15–74 num- bered almost 7.8 million (7,785.9 thousand); however, only 23.4 thousand among those aged over 64 were employed.
50 percent of the working age population: as in Greece (56.6 percent), in Italy (53.5 percent) and in Spain (55.0 percent). In 2000, on average, 63.3 percent of people aged 15–64 were in work in the European Union. In Hungary, according to the CSO Labour Force Survey, 56.4 percent of those aged 15–64, a total of 3.85 million men and women, were earners in 2000.
Using the Hungarian definition of working age would produce the some- what better figure of 60.5 percent, but that is still is below the EU average.
The economically active population includes both those employed and also job seekers. Unemployment continued to decline in Hungary on both national and international measures. Though there is a sizeable gap (of almost 130 thousand) between unemployment figures counted in the na- tional register of the unemployed (390.5 thousand) and in the LFS (262.5 thousand),3 the two systems of accounting show a decline in unemploy- ment of similar magnitude for 2000 (with registered unemployment ap- proaching 19 thousand, and LFS unemployment around 22.2 thousand).
The 6.4 percent unemployment rate calculated on the basis of LFS data is lower than the 8.2 percent average of the EU member states. (However, the rate was lower than 6 percent in eight of the fifteen EU member states – all of which recorded a decline in unemployment – while it remained above 10 percent in three.)
Already in 1999, the EU concluded that in low unemployment coun- tries, the increasingly shorter period of job search could be accounted for by transitions between jobs. In Hungary, similar developments are observed in certain regions, and in certain occupations and skill groups, but in 2000 a significant proportion of the unemployed (44 percent) had been out of work for more than twelve months.
Workers and job-seekers (that is, the labour force) represented 64.6 per- cent of the working-age population as defined by current Hungarian regu- lations and 60.2 percent of the population aged 15–64. This in itself is indicative of the lamentably low participation rate of the Hungarian adult population, which could not be raised significantly in spite of the general improvement of the past few years. Consequently, the proportion of those out of work and not actively seeking work, that is, of the economically inactive, has remained high. More than one in three (35 percent) of those below the Hungarian retirement age were out of the labour market in 2000.
Inactivity is higher among women: more than 40 percent of those aged 15–57, that is, one in three or one in four women, decided to, or was compelled to, be out of work and to relinquish their job search.
The absence of around three in four of the economically inactive (1.7 million men and women) can be explained by demographic or social phe- nomena, such as schooling, child-care, illness, disability, or retirement. More than half a million people, however, are out of the labour force due to
3 However, the Labour Force Survey also reports a total of more than a 100 thousand (107 thou- sand in 2000) discouraged work- ers, who are willing to work but are not actively looking for a job.
personal reasons, or other reasons related to their families or to labour mar- ket conditions, and have no (visible) source of income.
The economic activity of the population has shown significant regional variation throughout the decade but, as indicated by research monitoring the changes, the initial differences between the groups of developed, less- developed and backward regions, have slowly decreased.4
The group of developed regions (including Central Hungary, Central Transdanubia and Western Transdanubia) is characterised by above average total employment; over 66 percent of the working-age population are em- ployed, and the unemployment rate is below 5 percent. In the group of less-developed regions (Southern Transdanubia, Southern Great Plain), to- tal employment exceeds 60 percent and the unemployment rate is below 8 percent. In backward regions (Northern Hungary, Northern Great Plain), total employment falls below 60 percent, and in Northern Hungary, the unemployment rate still exceeds 10 percent.
According to LFS statistics, regional variations, despite the declining trend, have not changed significantly in the past two years: the ratio of the highest and lowest unemployment rates was 2.6 in 1999, and 2.4 in 2000.
The above cited regional data conceal significant differences at the level of smaller, closed, and segmented local labour markets. Data from the reg- ister of small-regions and settlements administered by the National Centre for Labour Research and Methodology (now called National Employment Office, NEO), show significant variations in unemployment rates within large regions (Figure 1.). Moreover, differences in the unemployment rates across small regions have steadily increased in recent years. As can be seen in Figure 2., this was due first and foremost to the steady deterioration of the relative position of small regions characterised by high unemployment.
Regions initially in a better position tended to retain their relative advan- tage, while those that started as crisis zones in the early 1990s, have mostly remained among the most deprived.
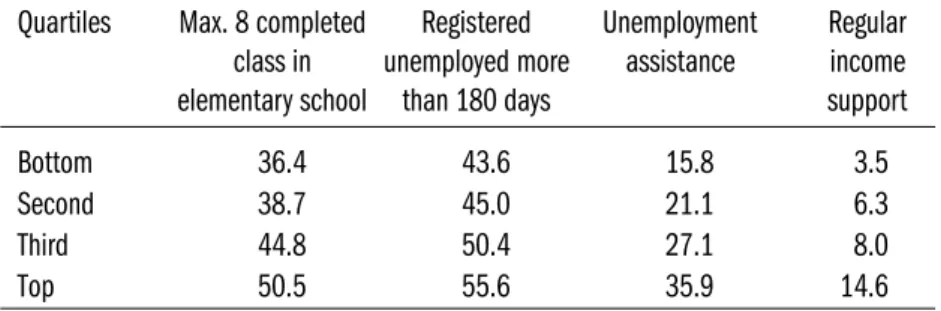
Regional disadvantages tend to accumulate. Above-average unemploy- ment rates are usually concurrent with relatively high inactivity rates, in- dicative of the fact that the lack of work opportunities is often conducive to an increase in inactivity. In disadvantaged regions, the composition of the unemployed pool tends to be unfavourable: the proportions of those with primary education, of the long-term unemployed, and hence, of those re- ceiving Unemployment Assistance or regular income support are all higher than the national average (see Tables 1. and 2.).
Isolated small regions characterised by poor labour market conditions tend to lie outside the main investment and development areas (which offer high quality infrastructure and skilled labour, etc.); investors are re- luctant to move to remote and underdeveloped regions. And although many
4 See Károly Fazekas: Regional Differences of the Labour Mar- ket. In: Labour Market Report, 2000, Main Trends in Labour Demand and Supply. National Employment Office, 2001.
percent 0.0 – 6.0 6.1 – 8.0 8.1 – 10.0 10.1 – 12.0 12.1 – 15.0 16.1 –
residents in these regions are ready to commute, most of them are still restrained by the poor transport infrastructure and high transportation costs.
Measures introduced to offset the disadvantages of underdeveloped settle- ments have not been very effective so far.
It is an increasingly pressing objective to substantially increase the level of employment and hence reduce unemployment and economic inactivity. It is in the essential interest of the individual, of society and of the economy that the largest possible number of citizens be able to work, and earn an income. This objective coincides with the joint effort of EU member states to raise the EU average of labour force participation to 70 percent by 2010.
In order to do so, however, most member states will have to make a serious effort and, working in co-operation with social partners, prepare measures in legislation, taxation, social security contributions, and education in or- der to encourage job creation and help people to return to work. Similar measures are needed in Hungary, too.
Figure 1: Registered Unemployment by Small Region, March 2001
Source: Károly Fazekas: Regional Differences in the Labour Market. In: Labour Market Report, 2001, Main Trends in Labour Demand and Supply. National Employment Office, 2002.
Figure 2: Change in the Regional Variation of Registered Unemployment by CSO Small Region, 1991–2001
0.0 0.5 1.0 1.5 2.0 2.5 3.0
2001 2000 1999 1998 1997 1996 1995 1994 1993 1992 1991
Note: The average unemployment rate for each unemployment decile divided by the me- dian.
Source: Károly Fazekas: Regional Differences in the Labour Market. In: Labour Market Report, 2000, Main Trends in Labour Demand and Supply. National Employment Office, 2001.
Table 1: The Proportion of the Registered Unemployed in the Working-Age Population, by Settlement Type and Size, 1999
Average Number of Standard Minimum Maximum Range Settlements Deviation
Type of settlement
Capital 2.5 1 0 2.5 2.5 0.0
City with county status 7.7 22 4.52 1.8 20.9 19.1
City 11.2 199 6.77 1.1 33.9 32.8
Village 14.8 2,909 11.30 0.0 79.8 79.8
Size of settlements according to their population in 1999
–500 17.2 1,032 13.17 0.0 77.5 77.5
501–2,000 14.4 1,337 10.47 1.0 79.8 78.8
2,001–5,000 11.8 483 7.97 0.9 51.0 50.1
5,001–50,000 10.7 253 7.05 0.9 38.7 37.8
50,000+ 6.7 21 3.50 1.8 16.6 14.8
Total 14.6 3,126 11.09 0.0 79.8 79.8
Source: HAS-IE Regional Database.
Table 2: Characteristics of the Registered Unemployed by Unemployment Quartile, December 2000 (percent)
Quartiles Max. 8 completed Registered Unemployment Regular class in unemployed more assistance income
elementary school than 180 days support
Bottom 36.4 43.6 15.8 3.5
Second 38.7 45.0 21.1 6.3
Third 44.8 50.4 27.1 8.0
Top 50.5 55.6 35.9 14.6
Source: HAS-IE Regional Database
Table 3: Main Labour Market Indicators in Hungary and in the EU, 2000
Employment Unemploy- Activity Inactivity ratio ment rate rate ratioa
EU average 63.3 8.2 69.0 31.0
Hungary:
– According to the national regulationb 60.5 9.3 64.6 35.4 – According to the ILO initiativec 56.4 6.4 60.2 39.8
a Population aged 15–64; calculation based on Employment in Europe,
b Employment: men aged 15–61 and women aged 15–57; unemployed: 390.5 thousand, rate calculated on the basis of the data from the National Employment Office.
c Population aged 15–64, annual average.
Source: EU: Employment in Europe 2000; Hungary: LFS, Time Series, 1992–2000, CSO, 2001; Employment and Earnings Proportions, 1998–2000, CSO 2001; Time Series of the Unemployment Register, 1995–2000, National Employment Office, 2001.
2. MAIN LABOUR MARKET TRENDS, 1999–2000
Economic and labour market processes have brought some significant changes in the Hungarian labour market in 2000. The following survey of major trends in employment, unemployment and inactivity is based pri- marily on data from the CSO Labour Force Survey.
2.1 Total Employment
As mentioned already, total employment continued to increase in 2000, but slower than expected. The level of employment at 3,849.1 thousand representing an increase by 37,6 thousand from 1999, is nevertheless still far below the 5 million (5,084.1 thousand according to the Labour Ac- count) recorded ten years earlier. Total employment had declined until 1997 when it reached a 3,646.3 thousand low (LFS).
Employment growth calculated by the Labour Force Survey includes those employed through public employment schemes and those meeting genu- ine demand for labour. On annual average, a total of 83 thousand persons in 1999, and nearly 92 thousand in 2000 were employed in public works or subsidised employment schemes (e.g. public works or subsidised em- ployment). The number of workers benefiting from some form of subsi- dised employment during the year exceeded 200 thousand.
Seeking to encourage job creation in the economy, the government granted investment subsidies in return for hiring from the unemployment register in 2000, paid from the unemployment insurance fund (Labour Market Fund), but the effects of these investments on job creation will take some time to materialise. During the year 2000, some 3000 new jobs were cre- ated with the help of subsidies granted in the preceding years.
The increase of employment of 200 thousand over three years since 1998 tended to favour women: female employment grew by 123.9 thousand, while male employment expanded by a modest 78.9 thousand. Men never- theless still represent the majority of the employed: 55 percent of the workforce are men. Moreover, almost two in three (63.3 percent) among the 3 million men aged 15–64 were in employment compared to one in two (49.7 percent) among the 3.5 million women aged 15–64, in part due to the lower female retirement age. The same factor explains why the gen- der gap in employment is smaller (65.3 percent versus 55.4 percent) when using the Hungarian definition (with lower retirement age limits) of work- ing age.
Whether considering the higher or lower upper limit of working age, as in most European countries, participation was highest among prime age workers, that is, among those aged 25–54. The level of employment was 69.7 percent for the 25–29 year-old, 75.4 percent for the 30–39 year-old, and 72.7 percent for the 40–54 year-old, and it was over 80 percent for among men aged 25–39 and 75 percent for men aged 40–59. This amounts to nearly full employment of men in the above age groups. [These appar- ently high rates are nevertheless still relatively low in European compari- son. In the member states of the European Union, at least 84.7 percent (Italy), and in several countries over 90 percent (Luxembourg, the Nether- lands and Austria) of the male population in corresponding age groups are employed.] But, above the age of 55, men and women alike seem to disap- pear from the world of work: in the 55–64 age group, only 33 percent of men and just over 10 percent of women had a job. The employment op- portunities have always been scarcer for young people, and the year 2000 brought no improvement, even though the 15–24 cohort has become slightly smaller. Less than 10 percent of those aged 15–19 were in employment (80 percent were still in school) and just over 50 percent of those aged 20–24
were working (with a much lower proportion in full time education). There are significant resources of labour in both the young and the old genera- tions.
There is little to be known as yet about changes in the effect of education on employment. However, some available data appear to lend support to the common argument that education improves chances of employment.
First is the steady growth in the number and proportion of white collar workers, and especially of highly qualified workers among the employed, and the corresponding contraction of the manual (unskilled) workforce.
This is in fact a long-term trend which continued in 2000. The second proof lies in the comparison of the educational composition of those em- ployed and unemployed. The proportion of those who completed eight years or less in primary education is below 20 percent among the employed, and exceeds 30 percent among the unemployed, while the proportion of skilled workers is by and large identical in the two groups. The difference is largest in the proportion of college and university graduates, which is al- most 20 percent among the employed and only 4 percent among the un- employed.5
It is worth noting in connection with employed population that the La- bour Force Survey recorded 71.3 thousand persons having a second job (in 1999, the corresponding number was 65 thousand). They represented a modest proportion (below 2 percent) of total employment. Two in three among them were men. Only 9 thousand (13 percent) among second job holders worked in agriculture, 12.5 thousand in manufacturing and con- struction and all others worked in repairs, education (!) and trade − unsurprisingly, since one in two second job holders are registered small entrepreneurs.
According to popular belief, there are several hundred thousand unre- corded workers beside those covered by the LFS. These people are typically recorded as economically inactive, and are principally working in agricul- ture. Pensioners cultivating family farms, smaller or bigger plots of land, petty farmers and those selling the (occasionally modest) surplus do not appear in employment statistics, even though they may be engaged in farm- ing at least 90 days in a year – as was found by a CSO micro census in 1996 in the case of 355 thousand persons otherwise recorded as inactive. There are several others among the economically inactive who take on casual or regular jobs (students in or outside school co-operatives, young people who are no longer in school but still living at home as dependent members of the household, housewives looking after their children, or ailing members of the family, etc.). Most of these would be employed by the ILO defini- tion: they performed some work for at least one hour for profit or family gain, in cash or in kind. Such work, however, can only be recorded if those
5 A true comparison would have to take into account the inactive as well, especially in the case of those of working age as defined in Hungary. Presumably, inad- equate qualifications are the rea- son why many do not even at- tempt to look for a job.
concerned could be absolutely certain that they could continue their activ- ity without paying taxes.
2.2 Sectors and Branches
The sectoral composition of employment continued to change in 2000.
Agriculture, which had accounted for the largest part of employment until the middle of the 20th century (employing one in two earners even in 1949), now employs an increasingly smaller number of (full-time) work- ers. In 1999, 7.1 percent of earners and in 2000 only 6.5 percent worked in the organised (recorded and taxed) agricultural sector. The drop in the share of agriculture in total employment and the increase in the proportion of those employed first in industry and then in services is commonly used as a basic indicator of the modernisation of the economy. One should mention that the above cited share of agricultural workers is relatively high in Euro- pean comparison.
Employment in agriculture, forestry and fishing decreased by a total of 19 thousand, and by 14 thousand for men. Only about one in two jobs in agriculture are strictly connected to farming or forestry. About 33 percent of the decrease in employment concerned such jobs, and the rest affected other occupations (managers, office clerks, machine operators, drivers, and unskilled staff ). (The number of jobs strictly connected to agriculture and forestry was in the range of 130 thousand in the course of the decade.)
As in previous years, officially recorded average earnings in agriculture were among the lowest in 2000 (monthly earnings came to HUF 59,246 for all employees, HUF 50,256 for blue collar and HUF 92,018 for white collar workers), though there were lower earnings recorded in several occu- pations (both manual and non-manual) in other branches of the economy, principally in services.
The future employment capacity of agriculture and its demand for main job holders, depends on the pace of subsequent development (e.g., the size of agricultural investments, the respective shares of extensive production and of special plants and animal husbandry, the size structure of farms, the division of labour between large and small firms, etc.). The modernisation of agricultural enterprises leads to a steady decline in the demand for manual labour – thus the pace of modernisation will determine future levels of employment in agriculture. (At the same time, smallholder farming will continue to provide a modest but essential supplement to the subsistence of hundreds of thousands, mainly inactive families – a phenomenon typi- cal in poorer countries.)
The share of industry and construction in total employment came to 33.8 percent, or almost 1.3 million in 2000, about 2 thousand more than
in the preceding year. The distribution of employment across industrial branches changed considerably during the year. The scheduled disman- tling of coal-mining, which started several years ago, was by and large com- pleted in 2000. The mines of the Borsod area were closed down in 1999 and 2000, and thousands of miners lost their jobs. The future of the mines supplying power plants has not been decided, but downsizing continues.
(Technological investments following privatisation led to job cuts of around 30 thousand in electricity, gas and water supply.)
In the eight main manufacturing branches, which include a wide range of industrial activity, the shocks experienced at the beginning of the decade are now replaced by slow but persistent shifts.
Mainly as a result of foreign capital inflows,6 the Hungarian industry, too, is increasingly subject to constant renewal and modernisation, i.e. the gradual upgrading of inputs, technology and products. The most modern branches (manufacture of motor vehicles, computing machinery, or micro- electronics components) are expanding in Hungary as well; while once important branches (such as textiles or food processing) have tended to contract. The transformation, implying many advantages and no doubt short-term disadvantages as well, affects various branches to a different ex- tent depending, among others, on prevailing economic trends. In 2000, employment dropped in four of the eight manufacturing branches (food products and beverages, textiles, wood and basic metals) from 1999 levels by a total of 15.1 thousand, while it increased in the other four branches (chemicals, non-metallic mineral products, machinery and equipment, and manufacturing) by 17.5 thousand. That is, total employment in manufac- turing remained by and large unchanged, despite significant increases in some branches and significant, at firm level often grave, losses in others.
Within industrial branches, net job creation was largest in construction, employing nearly 15 thousand more than one year earlier.
At the level of broad sectors, the earnings of industrial workers were the highest, exceeding the average of the national economy, and they also in- creased somewhat faster (by 15 percent) than average during the year. Aver- age wages came to HUF 91,108 for employees, HUF 71,728 for blue col- lar workers, and HUF 159,913 for white collar workers. Earnings were highest in the chemical industry (HUF 128,787, with HUF 91,347 for blue collar, and HUF 205,479 for white collar workers) and lowest in tex- tiles, leather, and footwear (HUF 53,450 with HUF 47,097 for blue collar, and HUF 102,779 for white collar workers).
The ranking by earnings of branches remained essentially unchanged.
Branch-level averages, however, conceal some important persistent features such as the significant earnings gap between small and large organisations.
According to CSO calculations, in 2000, wages paid by firms employing
6 In contrast with the frequent assumption, foreign capital in- vestments have a relatively mod- est share in total employment. In 1999 (the latest data available to us), foreign-owned companies employed a total of 584 thousand workers, corresponding to 15 percent of the total workforce.
They have a much larger share though in manufacturing, where 63 percent of all earners were employed by foreign-owned companies. (Foreign direct in- vestment in Hungary, 1998–
1999., CSO, 2001.)
more than 1,000 workers were 2.3 times higher than wages in organisa- tions that employ 5–9 workers. Within that framework, as shown by the papers published in Labour Market Report 2000, companies in majority foreign ownership for diverse reasons pay higher wages, than Hungarian- owned firms. This distribution persists despite the fact that in some branches job cuts occurred in large companies which tend to react to declining or- ders and negative economic trends by cutting the workforce rather than wages. (There have been layoffs for example in electricity, gas, and water supply, where earnings are the second highest within industry, coming after the chemical industry.)
Employment increased definitively in services, by 54 thousand, to ap- proximate 2.3 million. It dropped by a total of almost 10 thousand in two of the nine broad services branches that cover a wide range of activities, and increased by a total of 64 thousand in the other seven branches. A decline by nearly 3 thousand in national defence, grouped within public adminis- tration, is a consequence of the restructuring of the armed forces. The coun- try’s accession to NATO induced changes in the size and organisation of the armed forces: some 15 thousand were to leave army ranks by June 2001. Employment also declined in other community, social, and personal services, which include, as indicated by the heading, a variety of services from sports clubs to hairdressers. Since the number of sole proprietors and limited partnerships, who are typically active in these branches, increased compared to 1999, the decline in employment in this branch may indicate a shift in activities.
Employment increased significantly in three services branches.7 The first is the wholesale and retail trade; repair of motor vehicles, motorcycles and personal and household goods. The second is real estate and business serv- ices (e.g. accounting, business consultancy, and advertising). These two branches accounted for 44 thousand out of the total increase of 54 thou- sand in employment in services.
Although both branches include large organisations, these activities are typically operated by sole proprietors and small enterprises. The bulk of services that require vocational skills and a minimal amount of capital are concentrated in these two branches, which account for almost 70 percent of the 650 thousand enterprises active in services − typically sole proprie- tors and limited partnerships. Presumably, the large majority of new sole proprietors (1000 as a first job and 10,000 thousand as pensioners) regis- tered in 2000 also started up activities belonging in these two branches.
Beside these two branches, employment in education also increased sig- nificantly (by over ten thousand), while the other branches recorded mod- est growth.
7 The abbreviations used for the long description of activities grouped together in the standard international classification of ac- tivities are often misleading. For example, activities grouped into trade and real estate, include many other activities not implied by this abbreviation, but more important from the point of view of employment. Therefore, we shall use the more detailed names here.
Table 4: Level and Share of Employment by Activit y, 1999–2000
1999 2000 Change
1000 percent 1000 percent 1000
Branches persons persons persons
A–B Agriculture 270.4 7.1 251.7 6.5 –18.7
Industry – construction 1,296.1 34.0 1,298.4 33.8 +2.3
C – Mining and quarrying 24.4 0.6 19.2 0.5 –5.2
D – Manufacturing 928.9 24.4 931.3 24.2 +2.4
E – Electricity, gas, steam 89.8 2.4 80.1 2.1 –9.7
F – Construction 253.0 6.6 267.8 7.0 +14.8
Services 2,245.0 58.9 2,299.0 59.7 +54.0
G – Trade and repairing 517.5 13.6 540.9 14.1 +23.4
H – Hotels, restaurant 133.2 3.5 133.3 3.5 +0.1
I – Transport, storage 308.3 8.1 311.8 8.1 +3.5
J – Financial intermediation 80.9 2.1 83.7 2.2 +2.8 K – Real estate, renting 183.9 4.8 204.6 5.3 +20.7 L – Public administration,
Defence 301.9 7.9 299.0 7.8 –2.9
M – Education 306.9 8.1 317.8 8.3 +10.9
N – Health and social work 239.2 6.3 241.7 6.3 +2.5
O–Q Other services 173.2 4.5 166.2 4.3 –7.0
Total: 3,811.5 100.0 3,849.1 100.0
Source: Employment and Earnings, 1989–2000. CSO, 2001.
Earnings differ greatly across service branches, reflecting the diversity of activities grouped into services. One source of variation is ownership struc- ture: in the three major services branches (employing almost 40 percent of those working in the tertiary sector), the bulk of activities is operated by public organisations. Except for public administration, where earnings are slightly above the national average, the level of earnings is among the low- est in both manual and non-manual jobs in education and health care.
Although earnings in health and social work increased somewhat faster than average in 2000, the disadvantage accumulated over several decades was not significantly reduced. Earnings in the business sector are closer to competitive wage levels despite the predominance of public ownership in some activities, such as transport, storage, and communications.
The predominance of large organisations in some branches and of smaller ones in others is a branch-specific feature. The average firm size is small in real estate, renting and business activities and also in trade and repairs and in hotels and restaurants (the latter reporting the lowest earnings for blue
collar workers) which may partly explain why earnings fall well below the average in these branches. (Moreover, firms that employ fewer than 5 work- ers, and many of which operate in these branches, are not obliged to report on earnings to the CSO.) In services, and also in the economy overall, financial intermediation (including banking) comes at the top of the earn- ings distribution, with an average monthly net pay of HUF 189,444 (with HUF 80,054 for blue collar, and HUF 192,129 for white collar workers and professionals).
As for the level of employment in services, it is worth noting that the demand for services increases in proportion with prosperity, i.e. with changes in consumer tastes and increasing public expenditure on public goods (such as education, health care, environmental protection and defence). New serv- ices jobs are created in response to growth and changes in demand. In the most developed countries, more than 70 percent of earners are employed in the service sector. The corresponding figure in Hungary is 60 percent, but the level of employment in services in 2000 was still some 200 thou- sand below the level which existed at the beginning of the 1990s.
To sum up the recent changes: net job creation came to a total of 37 thousand amidst marked structural changes in the economy. Jobs cuts (of 43.5 thousand in total) affected several branches, but were balanced by job creation (of 81.1 thousand in total) in other branches, mostly in services.
3. UNEMPLOYMENT
Despite its strong performance in 2000, the economy, as mentioned al- ready, could not fully absorb slack labour. In 1998–2000, parallel with the growth of employment by 200 thousand, despite a 79.6 thousand drop in registered unemployment and the 86.3 thousand drop recorded by the LFS, registered unemployment still amounted to 390.5 thousand, and ILO un- employment came to 262.5 thousand (excluding more than 100 thousand discouraged workers, who would like to work but make no job search ef- fort). Annual averages apparently conceal substantial flows between em- ployment and unemployment.
According to data collected by the public employment service, which cover working age individuals (of the Hungarian definition) who had been previously employed or are school-leavers and have claimed some form of unemployment benefit, a total of nearly 650 thousand, and a monthly av- erage of 54 thousand, entered registered unemployment (c.f. a total of 686.6 thousand, and a monthly 57.2 thousand in 1999). The persistently high, though declining, inflow into unemployment may appear less worrying in the light of the fact that 70–80 percent of the inflow are not newly unem- ployed, but had already been on the register some time in the preceding
twelve months. However, the majority of these individuals are in fact long- term unemployed, whose registered status was suspended for a few days or months to work, usually in subsidised jobs.
In the course of the year, some 150 thousand (a monthly average of 12.5 thousand) persons entered registered unemployment, somewhat less than one year earlier (153.8 thousand). (As is well-known, not all those losing their job register with the employment services, as some workers do hope to receive assistance in their placement or living expenses for the period of job-search.) The proportion of men was higher than that of women among the newly registered unemployed (53.7 percent and 46.3 percent, respec- tively).
Despite their considerable efforts, the public employment service can offer employment mostly in subsidised jobs (public works, subsidised fixed- term employment for young persons, etc.). Although some employers (a growing proportion, currently some 40 percent, of firms reporting vacan- cies) look to hire workers through the public employment service as well (especially multinational companies launching new investments, who may want to hire dozens, or occasionally hundreds of workers), but such re- quests are not very frequent. More often, employers report vacancies to the public employment service in shortage vocations, in jobs characterised by poor working conditions and low pay, or sometimes if they could not find a suitable candidate through other channels. There is no guarantee that such demands can be met by the available unemployed pool; the same applies to labour shortages in certain regions or occupations.8
Under the given circumstances, relatively few of the registered unem- ployed can find a job with the assistance of the public employment service.
It must be noted though that the public employment service has no reliable information on placements other than in subsidised jobs. Accordingly, in 2000, 91.5 thousand, or 1.9 percent of the registered unemployed, were placed in subsidised or unsubsidised jobs (c.f. 83.2 thousand, or 2 percent in 1999.) Participants of training courses of different lengths (in 2000 amounting to a total of 88 thousand and on average 26.3 thousand at any time during the year) are also temporarily taken off the unemployment register. (The number of those on training schemes was somewhat higher, while the average duration of courses was somewhat shorter than in 1999.) Each month a few thousand persons are transferred to other forms of wel- fare provision (e.g. child-care allowance or pension). The large majority, however, remain registered unemployed, at least for the period of receiving Unemployment Benefit or, once exhausting benefit entitlement, the means- tested Unemployment Assistance.
8. In the biannual short-term prognosis prepared by the Na- tional Labour Centre (currently NEO) based on the expectations of company executives, several companies indicated labour shortages as the reason for the under-utilisation of production capacities in the second half of 2000.
In 2000, 33.7 percent of the registered unemployed received Unemploy- ment Benefit of HUF 22,826 per month on average and 36.8 percent re- ceived Unemployment Assistance (a monthly HUF 13,280 Ft on average).
Recipients of regular income support, which replaced unemployment as- sistant from 1 May 2000, numbered a total of 32.7 thousand persons by the end of the year, and were granted a monthly HUF 11,620 on average.
The shortened period of eligibility to Unemployment Benefit and the abolition of the Unemployment Assistance is likely to accelerate the de- crease in the number of the registered unemployed. In practice, those who had little trust in the efficiency of placement services provided by the pub- lic employment service, discontinued registration following the exhaustion of eligibility for benefits. During the year, 210 thousand individuals (a monthly 17.5 thousand on average) left the register; 32.1 thousand more than the new entrants. On average, the 54.1 thousand monthly inflow was opposed to a total monthly outflow of 56.8 thousand (c.f. the positive net monthly inflow of 34 persons in 1999). The pool of the long-term unem- ployed, some of whom had been out of work for several years, still remains very large, though their unemployed status may be occasionally interrupted by short spells of employment in public works or other temporary jobs.
In 2000, there were three schemes targeted at the long term unemployed, financed by the Unemployment Insurance Fund (Labour Market Fund) and/or the central budget: traditional public works under local govern- ments, or on government projects (such as flood prevention), and manda- tory public employment of at least 30 days for those receiving regular in- come support (replacing the means tested Unemployment Assistance). The above, variously defined and funded, three schemes provided temporary employment to large numbers. (In 2000, over 93 thousand were employed on public works, though on some occasions, for a few days only. An aver- age of 23.7 thousand were on public works at any one time during the year.
Local councils responsible for the management of these schemes usually merge them in order to improve efficiency.) The casual workers scheme represents another opportunity for short term employment, whereby the registered unemployed can suspend benefit entitlement and work for pri- vate employers in temporary jobs, recording the dates of employment in a booklet issued by the public employment service. This scheme however has not been very popular, despite several reforms to ease the conditions of application over the years (some 9 thousand used it in 1999 and 12 thou- sand in 2000).
The majority of the long-term unemployed are men and women subject to some disadvantage (poorly qualified, too young or too old to be employ- able, sick or caring for a sick relative, residing in a small village far away from urban centres, belonging to the Roma minority, etc.). They also tend
to be over-represented in the economically deprived regions of the country, in villages and small settlements with less than 500 inhabitants, that are characterised by permanently high rates of unemployment.
The real problem with the registered unemployed today is not so much the rate of unemployment (although that, too, is still high), but the high proportion of the long-term unemployed. Local communities and govern- ment organisations will need to find further, and more effective ways to help the most disadvantaged groups. The unemployment figures indicated by the CSO Labour Force Survey are somewhat different, but the overall picture is the same. The definition of unemployment used for interna- tional comparisons covers individuals out of work, but – and this is the main criterion – actively looking for work, irrespective of national retire- ment age limits and previous employment. Those counted among the un- employed in the LFS may or may not be registered unemployed.
On the one hand, those registered unemployed who rely exclusively on placement services of the public employment service are not considered to meet the job search criterion. (At best, they may be included among dis- couraged workers, separately reported, who want to work but are not look- ing for a job actively.) On the other hand, persons with no previous em- ployment experience and those past retirement age may be regarded as un- employed. Using this definition, unemployment reached 284.7 thousand in 1999, and 262.5 thousand in 2000. According to the survey introduced in 1992, unemployment stood at 444.2 thousand in 1992, increased until 1993 (to 518.9 thousand); and has gradually declined from then on.
The proportion of men among the unemployed has been essentially sta- ble at 60 percent since 1992. In the age group of the youngest, those aged 15–19, there are relatively few active job seekers; and there are even fewer among those aged 55 or above, the great majority of whom have given up hope of finding a job. 38 thousand among the unemployed (14.5 percent) have never worked; 20 thousand (7.3 percent) have been out of work for over 8 years. The majority (56 percent) lost their jobs or started their job search within the preceding twelve months. The rest are long-term unem- ployed; 60 thousand (23 percent) have been looking for a job for 1–2 years, another 23 thousand for three years, and almost 29 thousand for more than 3 years.
The majority of the unemployed pool in 2000, lost their jobs due to plant liquidation or reorganisation, or due to job cuts. This was the reason in the case of 52 percent of those who lost their job within twelve months.
Those with a previous employment experience were employed in manufac- turing (30.5 percent), trade and repairs (14 percent) or construction (10.7 percent), that is, in the course of the years, these three branches of the economy released 55 percent of those looking for a job in 2000. Job-seek-
ers include a relatively high proportion (16 percent) of school-leavers, and persons intending to re-enter the labour market after compulsory military service or maternity leave. The large majority (83 percent) of those with a previous employment experience are blue-collar workers, with 34 percent skilled, 28 percent semi-skilled, and 28 percent unskilled. Of the 17 per- cent of white collar workers, 5 percent were in office and administrative jobs. Despite the growing demand for highly qualified labour, 23 thousand (12 percent) had been employed in jobs requiring higher qualifications or in executive positions; with the share of long term and recent unemployed among them being more or less the same.
The 262.5 thousand unemployed made genuine efforts to job search:
they monitored advertisements, asked for the help of relatives, friends and acquaintances, called on the public employment service (20 percent con- tacted private job exchange agencies as well); 65 percent visited employers personally, some 33 percent placed advertisements, and less than 2 percent relied exclusively on the public employment service. However, in the course of the year, only 1,200 indicated that, although they were still unemployed, they had been promised a job starting within 30 days. Around 54 percent of the unemployed would like to have a full-time job – the others would accept part-time employment as well (but only 4 percent looked exclu- sively for the latter).
In most cases, wage expectations are quite modest: average net earnings calculated on the basis of expectations are around HUF 41 thousand, with HUF 43.3 thousand for men and 37.5 thousand for women. Within that, 10 percent would be satisfied with the minimum wage in effect in 2000 (with a few hundred willing to work for as little as HUF 10,000 a month).
Another 58 percent considered the HUF 40,000 minimum wage in effect from 2001 as the target figure, and the 26 percent expecting higher wages also stopped at HUF 60,000. (Let us note that in 2000 average monthly gross earnings came to HUF 61,930 for blue collar workers.)
In summary, although the two types of unemployment statistics differ in many respects, they both show that the Hungarian unemployment rate − relatively low in European comparison − did not decrease considerably in 2000. In the economy which showed a healthy performance, but was still in a state of transition and increasingly exposed to international economic trends, gross inflow into unemployment neared 150 thousand in the course of the year (149.3 thousand recorded by the public employment service and 145.7 thousand recorded in the LFS).
Table 5: Selected Unemployment Statistics
1999 2000
No. of percent No. of percent
persons persons
Based on National Employment Office databasea
Number of registered unemployed 409,519 390,492
– Male 221,155 54.1 209,710 53.7
– Female 187,969 45.9 180,782 46.3
– Under 25 year 85,400 20.9 79,091 20.3
– Manual worker 336,832 82.2 321,178 82.2
– Non-manual worker 72,687 17.8 69,314 17.8
– Received Unemployment Benefit 128,184 31.3 131,665 33.7 – Received Unemployment Assistance 159,825 39.0 143,515 36.8 – Received Regular Social Assistance 36,139b
Entrants (monthly average) 57,214 4,136
– New entrants 12,813 12,445
Leavers (monthly average) 57,179 56,811
Based on CSO Labour Force Surveya
Active job seakers (1000 persons) 284.7 262.5
– Male 170.7 60.0 159.5 60.8
– Female 114.0 40.0 103.0 39.2
– 15–24 age 78.6 27.6 70.0 26.9
– Manual workers 234.7 81.4 217.9 83.0
– Non-manual worker 53.0 18.6 44.6 17.0
– Seeking for job in the last 1–12 months 156.1 55.1 145.7 55.8 – Seeking for job more than 12 months 127.0 44.9 115.6 44.2
a Annual averages.
b November – December, 2000.
The decline in the level of unemployment in spite of the high entry rates is mostly explained by exits timed at exhausting eligibility for benefit and by the abolition of the Unemployment Assistance. (According to the public employment service this is the cause of 70–80 percent of the monthly out- flow from registered unemployed. The LFS reports of the level of unem- ployment but not of entries or exits between labour market states.) Pre- sumably, a (small) fraction of those leaving unemployment may have re- turned to work, especially those who with a short unemployment spell.
The expansion in total employment however is more likely to have fa- voured formerly inactive persons returning to the labour market.
4. ECONOMIC INACTIVITY
The goal of raising the level of employment highlights the importance of inactivity, i.e. the potential labour supply of individuals not in employ- ment and not actively looking for work. In Hungary, despite the modest though steady growth of employment and the steady decline in unemploy- ment, the low level of participation proved slow to increase, which places a severe burden on individuals, families and society alike: 35.4 percent of the working-age population was inactive in 2000. (In international compari- son, the situation is, of course, even worse: almost 40 percent of those aged 15–64 are inactive.)
In the course of the last decade, in parallel with the deteriorating state of the economy, the number of those leaving the labour market voluntarily or under some constraint has increased. (In the years when unemployment was at its highest, this tendency was encouraged by early retirement schemes.) Although the improvement of the economic situation halted the increase in inactivity, it has not succeeded in reversing the process: beside the 700 thousand persons in education, more than 1.5 million working-age men and women were inactive in 2000. There was little change compared to 1999: the inactive pool decreased by some 51 thousand among those aged 15–19 or 40–59, and it increased by around 15 thousand among the 20–
39 year group; that is, the number of the inactive dropped and that of the employed increased by approximately the same number.
The inactivity rate, calculated as the inverse of the participation rate (em- ployed + unemployed), exhibits marked variation by age group and sex.
The 15–19 year-old (mostly still in education) apart, the inactivity rate is 40 percent (slightly up from 1999) for those aged 20–24, lowest at around 20–25 percent for those aged 25–54, and as high as 65 percent for those aged 55–59 (and 95 percent of those aged over 59). The female inactivity rate is higher in every age group than the corresponding rate for men; in 2000, 29.7 percent of working age men and 41.3 percent of working-age women were inactive.
Employment, job-search and withdrawal from the labour market may be voluntary or involuntary. Inactivity may be a voluntary choice for those past the age of 15 who continue their studies or for those choosing to stay home looking after their children, and for those choosing to retire when reaching a pensionable age. This choice, however, may be dictated by ne- cessity if the 15–16 year-old leaving school with no specific skills stays at home and does not even try to find a job, if a baby is born so that the
mother may receive a modest allowance relieving her, for some years at least, of a hopeless job search; or if pensions represent a safe alternative to unemployment. Individual choices are made by assessing individual and family circumstances as well as economic conditions and available oppor- tunities in the locality.
Of a plethora of considerations, statistics only record a selection of typi- cal factors, which may socially justify and explain absence from the labour market. In what follows, we shall review such reasons for inactivity in the working age population as reported in the LFS.
Table 6: Composition of the Economically Inactive Working-Age Population, 2000
Total Women
1000 percent 1000 percent
persons persons
Economically inactive 2,216.5 1,260.7
As a percentage of the
working age population 35.4 100.0 41.3 100.0
From this:
– Student 710.2 32.0 357.7 28.4
– On child care allowances 283.7 12.8 279.6 22.2
– On pension 714.1 32.2 329.5 26.1
– Other purposes 508.5 23.0 293.9 23.3
Source: LFS, Time Series, 1992–2000, CSO, 2001.
Students represent a significant group among those absent from the labour market. The number of youngsters staying in education after completing the eight-year elementary school is steadily increasing. Their proportion among the 15–24 year group was 27.4 percent in the school-year of 1969/
70; 25.4 percent in 1979/80; it rose to 43.9 percent in 1998/99 and was 46.4 percent in 1999/2000. More than three in four among those aged 15–
19 are in education, the majority staying until the age of 18. Within the age-groups concerned, a small proportion (8 percent) is inactive for other reasons. This 8 percent numbers 54 thousand and includes young women on maternity leave, school dropouts, youngsters waiting for admission into higher education or for starting compulsory military service, or waiting for a job opportunity. Since they have no income of their own, they must rely on support from their families. In the age-group of the 20–24 year-old, only 20 percent are in education; their proportion decreasing with age (only 9 percent of the 24 year-old are on full time courses.) Together with those
in education, as mentioned above, 40.7 percent of those aged 15–24 were inactive, partly for observed reasons (such as child care) and partly for other, unknown reasons.
There is no data available for other age groups to distinguish reasons for inactivity. Beside students (concentrated mostly in the age groups of 19–
24), the second large group among the inactive, already larger than that of students, is that of those pensioned off for diverse reasons. Retirement due to disability or accident may occur in practically any age group. Workers in some occupations subject to a reduced retirement age may retire earlier. In the course of the past decade, until 1998 essentially, some 40–45 thousand were pensioned off prior to reaching retirement age as part of a government initiative to curb unemployment. (Since the gradual tightening of eligibil- ity rules and the introduction of pre-pension unemployment benefits, in- dividuals aged 3 years below the retirement age are more likely to be unem- ployed, i.e., economically active.) Although those who retired earlier are transferred to the old-age pension scheme once they reach the regular pen- sionable age, their group was still growing in 2000, by a total of 33 thou- sand during the year.
The various forms of child-care provision tend to keep young women out of the labour market. Despite the steady decline in the number of births, the number of persons – mainly women – benefiting from one of the three forms of child-care provision (child-care fee, child-care allow- ance, child-care support) has increased, with minor fluctuations, during the 1990s. In 2000, the number of persons inactive due to child care de- creased by some 13.5 thousand compared to Labour Account data for 1 January, but it still stayed in the range of around 300 thousand.
Apart from the above well-identified reasons, more than 500 thousand men and women stayed away from the labour market for other reasons.
Inactive individuals are naturally present in every economy. Even in coun- tries characterised by high levels of employment, there are people who do not want to or cannot engage in work for personal reasons (e.g. looking after a sick relative, lack of jobs matching their qualifications, or a well-paid spouse). However, in Hungary, especially in certain age groups, too high a proportion stay away from the labour market for unknown reasons (50 percent for the 35–39 year-old, 47 percent among the 40–44 year-old; and 39.2 percent among the 30–34 year-old). Men are over-represented in this group of the inactive (66.8 percent are men among the 30–34 year-old; 63 percent among the 25–29 year-old; and 57.6 percent among the 35–39 year-old). More than one in two women aged 40–44 (51.5 percent) were inactive for unknown reasons.
One may assume that, given the traditional pattern of labour division in families, the majority of women inactive for unknown reasons, and with-