2009
Editorial Board
Károly Fazekas – director, Institute of Economics (IE HAS)
• Mária Frey – senior researcher, Institute for Social Policy and Labour (ISPL) • János Köllő – senior research fellow, Institute of Economics (IE HAS) • Judit Lakatos – head of department, Hungarian Central Statistical Office (HCSO) • György Lázár – senior advisor, Public Employment Service (PES) • Gyula Nagy – associate professor, Corvinus Univer- sity of Budapest
Series Editor Károly Fazekas
The hungarian Labour MarkeT
review and anaLysis
2009
edited by
károLy Fazekas & János köLLő
institute of economics, ie has national employment foundation budapest, 2009
& National Employment Foundation
Translated by: Anna Babarczy, Szilvia Hámori, Ágnes Kozma, Ágota Scharle
Revised by: Anna Lovász, Stuart Oldham Design, page layout: font.hu
Typography: Franklin Gothic, Garamond Printing: ETO-Print Nyomdaipari Kft.
Copyright © Institute of Economics IE HAS & National Employment Foundation, 2009
ISSN 1785-8062
The publication of this volume has been financially supported by the OFA National Employment Foundation.
Copies of the book can be ordered from the Institute of Economics.
Mailing address: H-1112 Budapest, Budaörsi út 45.
Phone: (+36-1) 309 26 49 Fax: (+36-1) 319 3136 E-mail: biblio@econ.core.hu Web site: http://www.econ.core.hu
Foreword by the Editors ... 9
Labour market activity and wages in 2007–2008 (Zsombor Cseres-Gergely, Károly Fazekas & Mónika Bálint) ... 17
Introduction ... 19
1. Labour market participation ... 21
2. Wages between 2001 and 2007 ... 34
Conclusions ... 38
References ... 39
In Focus ... 41
Preface ... 43
I. The Hungarian labour market – a European perspective (Blanka Bajnai, Szilvia Hámori & János Köllő) Introduction ... 44
1. The data ... 4
2. Employment in the population aged 1–64 years ... 4
3. Employment and working hours among the 1–9 year old non-student population ... 46
4. The non-employed of “best working age” ... 48
. In between work and non-work ... 61
6. From education to the labour market – entering the labour market and unemployment among young people ... 72
7. Men approaching retirement age ... 88
8. Concluding remarks ... 91
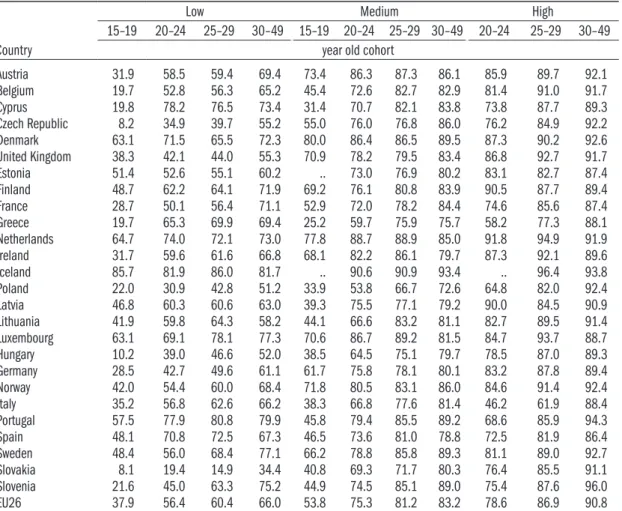
Appendix 1: Participation in regular education, individuals, aged 20–29 ... 93
II. The failures of “uncertified” vocational training (Gábor Kézdi, János Köllő & Júlia Varga) ... 9
Introduction ... 9
1. Basic skills of vocational training school students and graduates ... 98
2. Employment and workplaces of the population educated at vocational training schools ... 106
3. On the deficiency of data available for longitudinal analysis ... 112
4. Wages ... 127
. On the “shortage of skilled workers” ... 131
6. Barriers to improving vocational training programmes ... 133
Appendix 2.2: The occupational classification used for the analysis
of skilled workers’ wage advantage ... 142
Appendix 2.3: EBRD survey, 2001 ... 142
References ... 144
The legal and institutional environment of the Hungarian labour market (Mária Frey) ... 149
Introduction ... 11
I. Unemployment compensation ... 11
1. Entrepreneurial contribution and benefit ... 13
2. Reform of the system of unemployment compensation ... 13
3. Regular social assistance ... 18
4. Experiences of the implementation of new rules ... 161
II. Active labour market schemes, services and programmes ... 163
1. Labour-market training ... 166
2. Wage subsidy for the long-term unemployed ... 170
3. Public work ... 173
4. Business-start up support for unemployed people ... 17
. Incentives for employers of people with disabilities ... 176
6. Support for job-creation ... 179
7. Commuting and travel subsidies ... 181
8. Reduced contributions to promote the employment of disadvantaged people ... 182
9. The employment of casual workers ... 184
10. Employment services ... 186
11. Labour-market programmes ... 189
III. Governance and financing of the Hungarian employment policy ... 191
1. The governance structure of employment policy ... 191
2. The system of financing labour market policies ... 194
3. Labour dialogue ... 196
References ... 199
Statistical Data ... 201
1. Basic economic indicators ... 203
2. Population ... 204
3. Labour market status ... 207
4. Employment ... 21
. Unemployment ... 22
6. Wages ... 241
7. Education ... 21
8. Labour demand indicators ... 2
10. Migration ... 266
11. Industrial relations ... 267
12. International comparison ... 268
Description of the main data sources ... 271
Index of tables and figures ... 277
Blanka Bajnai – IE HAS Mónika Bálint – IE HAS
Zsombor Cseres-Gergely – IE HAS, CEU Károly Fazekas – IE HAS
Mária Frey – ISPL Szilvia Hámori – IE HAS Gábor Kézdi – CEU, IE HAS
János Köllő – IE HAS Judit Lakatos –HCSO
György Lázár – PES
Júlia Varga – Corvinus University of Budapest, IE HAS
The series of our labour market yearbooks was launched with the goal of review- ing the main developments in the Hungarian labour market annually, and of giving an in-depth analysis of selected issues.
1. Labour Market Activity and Wages in 2007–2009
The introductory chapter of the volume discusses trends and recent changes in employment, activity, and unemployment in Hungary between 2007 and the first quarter of 200. Because the first part of the “In Focus” chapter discusses certain important aspects of the Hungarian labour market in an international comparison, this chapter concentrates mostly on recent events. Although not much data is available for in-depth analysis, the Introduction discusses the first signs of the impact of the economic crisis which unfolded following the autumn of 2008 along with other dominant features of the macroeconomic environment.
Unfortunately, the last two years did not bring about positive changes in the employment situation in Hungary. Not only was Hungary already performing the worst in terms of employment figures within the EU by mid-2008, it is also likely that the crisis will make it even more difficult to escape from this situa- tion. Indeed, the Hungarian GDP contracted by 2.5 percent in the first quar- ter of 200, and is expected to shrink further at a rate of 6 percent during the whole year – this has a direct effect on employment, but also an indirect one through contracting domestic demand. The Introduction analyses stylised facts to show how employment has changed in different groups of the population, with an emphasis on the largest groups which were already displaying small ini- tial employment rates. Data show that the employment situation had already worsened among the least educated prior to the outbreak of the crisis, and did not improve among the young mothers with small children, and inhabitants of the least developed regions especially those in the small villages. Improvement is visible only among the highly educated and among older workers who were affected by the increase in the pension age.
Differences in employment rates of distinct groups of the population and their changes are affected by factors that can be influenced by policy on dif- ferent time horizons. The employment rate of the least educated can only be improved through the systematic development of the education system to help
the accumulation of marketable human capital, and the removal of institutions and restrictions that make their employment more costly than necessary. Fur- ther increase of the pension age to 65 – already voted for by the Parliament – makes an increase in the employment rate of older people very likely. These are effects that work in the longer term, but there is room for improvement also in the shorter term. Following the outbreak of the crisis, the overall unemploy- ment rate increased rapidly – it is expected to reach 11 percent during 200 –, and a new type of unemployment appeared at the same time: that of skilled, but not highly educated people. Both of these changes in unemployment make the need for a modern unemployment support system even clearer than before.
Putting personalised services in place, along with strict accounting for search efforts and the re-calibration of the unemployment benefit system to make the search for a high quality job viable also for higher earners, are tasks that are un- avoidable. Finally, although it is not a measure aimed directly at employment policy, the restructuring of the tax system (and the adjustment of the system of social transfers accordingly) is instrumental in increasing the employment chances of any individual.
The second part of the Introduction looks at wages. Trends in the evolution of wages are characterised through the use of aggregate indicators for all earn- ers, and additionally for several subgroups. Special attention is paid to the gen- der wage gap and to regional differences.
2. In Focus
The In Focus section of the Hungarian Labour Market yearbook usually sum- marises previously published research.* This year the editors decided to depart from this tradition to some extent. The first part of this year’s In Focus presents a simple descriptive statistical overview of the Hungarian labour market as seen through the microdata of the European Labour Force Survey (EU LFS). The chapter does not attempt to give an explanation for observed deviations from European trends (if any). What it undertakes to do is present the comparative data in order to bring clearly to light those specific Hungarian phenomena that actually need to be explained by future research. Naturally, this compels us to present more statistics than usual, while explanations and references to the lit- erature will be given far less attention.
The data confirms that the substantial disadvantage observed among the en- tire 15–64 year old population in Hungary is primarily explained by low levels of employment among the oldest and the youngest: the transition from school
* In Focus parts of the previous volumes discussed the following topics: 2002: I. Wages: A Decade of Transformation, II. Income Support for the Jobless; 2003: I. Labour – the Supply Side, II. Labour – the Demand Side; 2004: Labour Market Inequality and Geographical Mobility in Hungary; 2005:
Education and the Labour Market; 2006: Industrial Relations in Hungary; 2007: Wages: New De- velopments. 2008: Education and the Labour Market. Each volume can be downloaded from the homepage of the Institute of Economics-HAS: http://econ.core.hu/english/pub/mt.html
to work is a slow-moving process, and a large number of men over the age of 40 have left or are leaving the labour market permanently. Mothers with small children constitute a third group whose employment level lags far behind the European average. (The latter problem was discussed in detail in last years’ In Focus.)
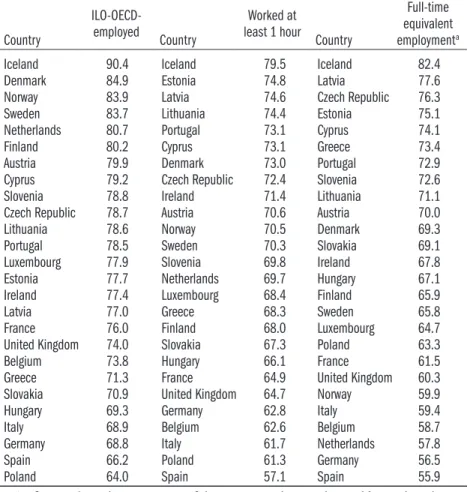
With regard to people “of the best working age,” Hungary’s disadvantage is far less pronounced thanks to a relatively low level of absenteeism and long working hours. In terms of full-time equivalent employment within the non- student population aged 15–5, Hungary occupies a medium position close to Slovakia and not far removed from Denmark, Finland, or Ireland, with a score 7.1 percent above the old EU members’ average.
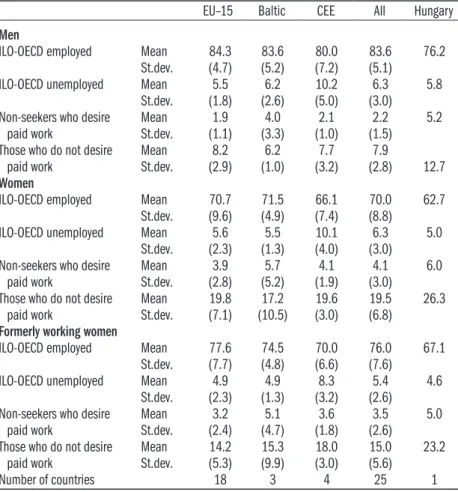
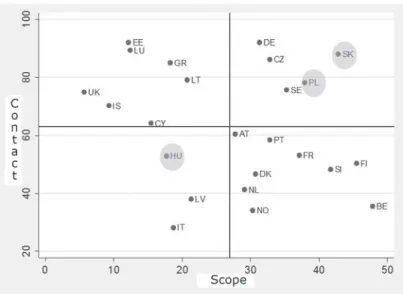
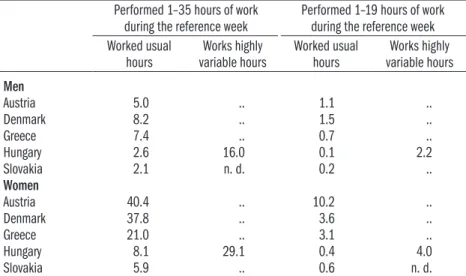
The sections on the prime-age population identify striking contrasts with the West-European patterns of employment and non-employment. The Hungar- ian prime-age population is divided into two groups with a remarkably sharp boundary between them: those who work the standard eight hours a day, five days a week, and a strikingly large group of those who are out of work and who do not even search for jobs. Forms of labour attachment other than full time employment are underdeveloped and rudimentary: few of the employed work part time, few workers are temporarily away from their workplace; few people have working hours deviating from the standard, and those who do, do not owe this to flexible working arrangements; few people work at home; few work- ers participate in adult training programmes, and even fewer attend training courses as part of their regular working hours. Of those who are not employed, few are actively seeking employment, and few register with the unemployment agency. The share of persons out of work who have no desire to find paid em- ployment is particularly high.
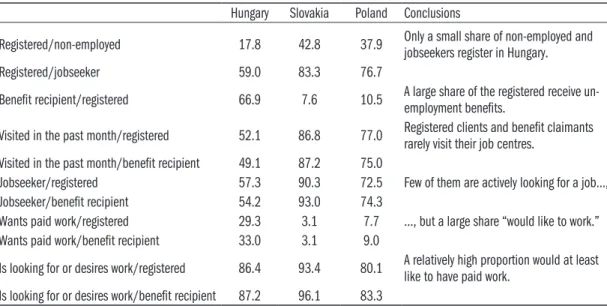
Most of the above-mentioned characteristics are common to Central and East European countries, and some of them can also be observed in Southern Eu- rope. The low level of job searching, however, is a unique feature of the Hungar- ian labour market compared to other former communist countries. A section comparing Hungary, Poland, and Slovakia finds that the situation in Hungary is most probably due to its system of unemployment assistance. The majority of the non-employed, including those aged 15–5, receive disability pension or child-care benefits. As a result, few of them are registered in the job centres and, in addition, few of those who are registered are actively looking for jobs. While registration practices and job searching among the registered unemployed dif- fer substantially across the three countries considered, the linkages between job search and education, gender, age or duration of joblessness are similar.
The data on the young call into question some widely held stereotypes. The concerns voiced in connection with youth unemployment – in particular un- employment among young university graduates – appear to be overly pessimis- tic in light of the results of a European comparison.
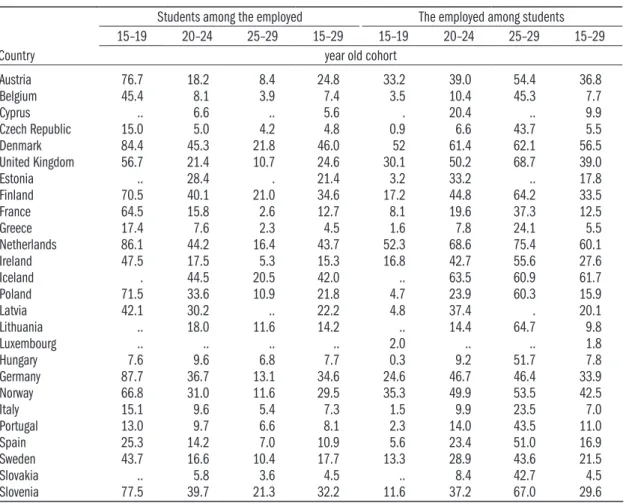
The basic statistics do indicate relatively high unemployment among young people in Hungary. The exceptionally wide range of the ILO-OECD employ- ment and unemployment rates across the EU suggest, however, that these indi- cators cannot accurately capture the highly complex process of transition from school to work. The section on youth employment finds that the ILO-OECD indicators are heavily affected by the system of vocational training and by the patterns of student work, both of which are factors that show extreme variation across the countries of Europe. The level of youth employment in Hungary is substantially lowered by the infrequency of apprentice work among secondary school students, and the low share of students working in parallel with their college or university studies. It is a notable feature of the data that not even student workers are likely to have jobs with atypical working hours such as part-time, seasonal, weekend, or evening/night-time employment. Hungarian student workers are also less mobile: they remain in the same job for a longer time. The data does give cause for concern, however, in the case of the young who leave the education system with only primary qualifications (mostly sec- ondary school dropouts).
The results for men older than 40 are less astonishing given Hungary’s infa- mously permissive retirement policies. Among the 24 European countries under analysis, Hungary has the highest share of men in retirement or permanently disabled within each education group, and the situation is especially alarming for the youngest cohort aged 40–4.
More in line with our usual practice, in the second part of In Focus a specific aspect of the labour market is discussed in as much detail as is possible, on the basis of currently available research evidence. Vocational training is a relatively under-researched area of the Hungarian labour market, even though not a day goes by without businessmen and policy makers making explicit comments on the shortage of skilled workers, the quality of training, and the desirable direc- tion of development.
“Uncertified” vocational training, in which no upper secondary (Matura) qualifications are awarded, remains an important segment of the Hungarian education system. Research addressing the quality of training and the skills and labour market careers of vocational school graduates depicts a troubling picture of this form of education. The chapter summarises the main findings of the Hungarian literature, and presents the most important data supporting the belief that vocational training is an ailing part of the educational system, and is an area where profound reforms are required.
Vocational training school (VTS) students have always come from relatively poor and uneducated social backgrounds and from among the lowest-achieving primary school graduates, but the gap between secondary schools and VTS has critically widened over the past decade. The children of parents who have a pri- mary school background are eight times more likely to enrol in vocational train-
ing than children from better educated middle class backgrounds. Almost two thirds of Roma children in post-primary education attend this type of school.
Children of parents who have at least Matura qualifications represent no more than a quarter of VTS students. These schools are characterised by five to six times higher dropout rates, and two and a half to three times higher grade re- tention rates than vocational or academic secondary schools. The students and graduates tend to show very poor performance on skills assessment tests. The data on wages indicates that the market value of vocational qualifications has been depreciating, and the only reason why employment remained relatively high was that a large share of VTS graduates became employed in simple jobs requiring no qualifications.
While adverse selection is a part of the picture, it cannot be accepted as the sole explanation for the low level of skills typical of VTS graduates, or as an excuse for the failures of the education system. Those graduating from VTS displayed substantially poorer performance than those graduating from secondary schools prior to the contraction of traditional vocational training. Data from the mid- 10s on the basic skills of VTS graduates did not show the kind of improve- ment relative to older generations that was observed in the case of secondary school graduates. Furthermore, adverse selection obviously does not lessen, but merely transforms and makes more difficult the task facing educators: schools have to educate students with lower initial abilities to a level that helps them find employment in the service sector and modern manufacturing industry.
The data and research results discussed in this part of In Focus suggest that vocational training fails to equip students with the basic skills and competen- cies needed for post-school development and adaptation. This conclusion is supported by direct observations such as test scores, as well as indirect evidence based on the employment careers and wages of VTS graduates. Occupational mismatch and the deficiencies of practical skills are part of the problem, but the authors believe that by focusing on the problem of basic skills, they are ad- dressing the key issue.
Hungarian firms are keen to employ workers with vocational qualifications (preferred to primary school educated workers) for jobs with low literacy re- quirements, but even the VTS graduates are excluded from knowledge-intensive jobs. With respect to literacy, the demands of new workplaces are much clos- er to the Western pattern than those of old workplaces. An especially marked change can be observed in blue-collar jobs. Changing demands and the low level of basic skills have a major impact on the employment prospects of the VTS graduates.
The importance of basic skills is also highlighted by research on “skill short- ages”. While we have convincing empirical evidence that vocational qualifica- tions have become less marketable, the media, business chambers, and economic policy makers have repeatedly complained of a shortage of skilled blue-collar
workers. The available firm-level evidence suggests that the problem essentially lies in difficulties in adjusting to technological advances rather than in some sort of “underproduction” of vocational qualifications.
The chapter arrives at some conclusions relevant to training policy. If, as is often demanded, the training system is tailored to companies’ short-term needs, the long-term employment prospects of participants will suffer. Publicly financed vocational training should focus on enhancing participants’ general competen- cies and core vocational skills, since it is these that empower skilled workers to successfully participate in advanced training and retraining programmes and in company-funded on-the-job training programmes that are necessary to ac- quire the specialised knowledge required by their employers throughout their careers, i.e., to enjoy long-term labour market success. Education programmes that neglect to emphasize the enhancement of basic skills leave their graduates in a despondent position.
3. The Legal and Institutional Environment of the Labour Market The previous issues of the Labour Market Review provided an overview each year of the main changes in the legal and institutional context of the labour market and the drivers of these changes. This year, instead of presenting the changes, we provide up-to-date information on current regulations. As has happened on several occasions in the past, this year once again a major legislative review – the Pathway to Work Programme – was also commenced during the writ- ing of this volume. The final proposal, however, was not available at the time of its submission. Therefore, in addition to the facts, the likely changes will also be discussed. The legal basis of the current institutional system of the Hungar- ian labour market was created by Act IV of 11 on the Promotion of Employ- ment and Unemployment Compensation (Employment Act), which created a stream of insurance for unemployment benefits, established the institutions of organised social dialogue, established a single public employment service, and expanded the range of active labour market policies. Their current legislative framework and implementation is reviewed in this chapter.
4. Statistical Data
The closing chapter presents a comprehensive collection of statistical data on the Hungarian labour market. It gives exhaustive information on the social and economic developments, such as demographic trends, employment, unemploy- ment and inactivity, wages, education, labour demand and supply, regional dif- ferences, migration, commuting and labour relations, along with some interna- tional comparisons. Labour market developments broken down to the regional level are included as well.
* * *
The publication of this volume was supported by the National Employment Foundation. The editors are grateful to numerous experts from the Institute of Economics HAS, Central Statistical Office, National Employment Service, Corvinus University of Budapest, Central European University, Ministry of Social Policy and Labour and the Public Employment Service for their valu- able contributions, comments and suggestions.
and wages in 2007–2008
Zsombor Cseres-Gergely
Károly Fazekas
Mónika Bálint
IntroductIon
One distinguishing feature of the Hungarian labour market compared with either the developed Western European countries or the neighbouring ex-so- cialist states, is the extremely low level of employment. In 2007 the employ- ment rate of the population between 15–64 years of age was 56.7 percent, which is more than ten percentage points below the OECD average. Recently, Hungary’s position has deteriorated further, so that now, out of the 29 OECD countries, only Turkey fares worse (Figure 1). The deficiencies of the labour market take a huge toll on the individual as well as on society as a whole. The lack of jobs and stable wage earnings lead to poverty, the weakening of social ties, the erosion of knowledge and skills and deteriorating health and life ex- pectancy. The low employment rate also reduces the number of those paying social security contributions and in the long run makes the social security sys- tems impossible to finance. Through poor socialization, the lack of jobs has a negative impact on the entire career of the next generation.
Figure 1: Employment rate of the 15–64 age group in the oEcd countries in 2008
Source: OECD Dataset: LFS by gender and age-indicators.
The past few years have witnessed several ambitious government proposals to remedy the situation and expand employment in Hungary. The magnitude of the task at hand is well illustrated by the fact that in order to reach the cur-
0 20 40 60 80 100
Iceland Switzerland Denmark Norway Netherlands Sweden New Zealand Canada Australia United Kingdom
Austria Finland United States
Japan Germany G7 countries Oceania North America Portugal Ireland EU 15 OECD countries Czech Republic
EU 19 Spain France Luxembourg Europe Korea Slovak Republic
Greece Belgium Mexico Poland Italy Hungary Turkey
rent average employment level of the Western European countries Hungary would need to provide jobs for approximately 680,000 inactive citizens. In order to be on par with Switzerland, at the top of the ranking, or with the North European countries such as Sweden, Norway and Denmark, Hungary would need to increase the number of employees by over 1.3 million. In 2004, during the preparation of the Lisbon action plan the Hungarian government made a commitment to meet the employment objectives for 2010 approved by the European Commission. The objective was to increase the number of employees by 100,000 each year, so that Hungary could reach the employ- ment rate of 70 percent. Contrary to these plans, employment in Hungary only increased by a total of 31,000 in two years. The convergence programme approved by the EU Commission in 2006 already took account of these reali- ties and set much more modest targets for the period 2007–2011 (Republic of Hungary…, 2006). The programme projected a GDP increase of 2.2–2.6 percent for 2007–2008 and 4.2–4.5 percent for 2009–2010, respectively. This relied on the assumption that the activity rate would increase by 2 percent for 2009–2010, not specifying how employment and unemployment would change within that overall figure. Nonetheless, the government trusted that the economic development programmes financed by the National Develop- ment Plan, and the proposed measures to help the disadvantaged regions would close the gap and that the new employment subsidies for disadvan- taged workers would be sufficient to expand employment.
However, the end of 2006 brought a downturn in the macroeconomic en- vironment of the Hungarian labour market. Not least due to the consider- able pressure from the European Union, Hungary implemented the restric- tive measures proposed in the convergence programme for cutting the budget deficit. Although the austerity measures resulted in improved budget balance indicators, the restrictions also caused far slower economic growth than ex- pected, investments dropped and the growth potential of small and medium- sized firms significantly deteriorated. Gradually it became obvious that even the modest employment objectives of the National Development Plan were impossible to meet.
While no real progress was seen, the global financial and real economy cri- sis beginning in the autumn of 2008 further reduced the likelihood of future expansion. The country is now faced with the same structural problems but without the advantage of the global economic boom of the previous years.
Table 1 shows that Hungary has not experienced a drop in the GDP as large as in the fourth quarter of 2008, but the decrease was even larger, 6.7 percent in the first quarter of 2009. While construction and agriculture do not seem to be affected by the recession (yet), industrial production acted as a leading indicator of GDP growth: it shrunk earlier and to a greater extent than GDP itself. The slowdown of the previously dynamic growth and the subsequent
contraction of export clearly show that it is the exporting, most importantly manufacturing firms that are affected by the downturn.
table 1: Selected indicators of the Hungarian economy, 2007–2009 Q1, quarterly data (same quarter of the previous year = 100)
2007 2008 2009
Q1 Q2 Q3 Q4 Q1 Q2 Q3 Q4 Q1
GDP 102.6 101.0 100.8 100.7 101.8 102.1 101.3 97.5 93.6 Industrial production 109.0 106.7 109.0 107.0 108.0 105.7 99.3 88.5 77.7 Construction 98.7 93.5 80.0 78.4 82.5 93.6 94.0 100.8 95.9 Purchase of agricultural
produces 108.5 114.2 110.5 84.6 100.2 91.6 96.2 118.5 117.2 Export 119.0 117.0 116.8 110.4 113.1 109.7 100.7 91.1 83.7 Source: HCSO Stadat.
1. Labour markEt partIcIpatIon
Trends in employment and unemployment
Considering only the aggregate indicators of employment and unemploy- ment,1 it is fair to say that the relatively calm period of 2007 and the first half of 2008 was succeeded by gravely negative trends. Stagnating at a low level since the turn of the Millennium, the Hungarian employment rate ranked lowest among the Visegrád countries by 2008. While the employment rate has significantly increased in Poland, Slovakia and Slovenia over recent years and even the Czech Republic produced some noticeable growth, Hungary has been unable to rise above the level of the past decade (Figure 2). The only significant change was seen in 2008 when the employment rate, with no re- serves for growth, immediately reacted to the worldwide decrease of market demand. The long run trend is equally characterised by stagnation. Follow- ing the modest rise by 300,000 between 1997 and 2000, the size of the em- ployed population fluctuated within the very narrow range of 3,850,000 and 3,900,000 until 2008 (Figure2).
Overall, the employed population grew by 22,000 between 2004 and 2007, and the employment rate consequently increased from 56.8 to 57.3 percent.
This gain, however, evaporated in less than a year: as a result of the crisis, the employment rate dropped to the level seen five years ago. Current figures are even worse than in late 2008 and make it clear that the employment effects of the crisis are starting to unfold only in 2009. Table 2 shows that the 55.1 percent employment rate in the first quarter of 2009 was 1 percentage point less than during the same period last year (56.1 percent). Although data of this frequency are affected by seasonality, comparing changes between two quarters to changes between the same quarters in the previous years allows us to control for this effect to some extent and the conclusion remains un-
1 In all cases the aggregate ac- tivity data shown in this sec- tion refer to the age group of 15–64.
changed.2 The drop in the number of the employed between the past year’s fourth quarter and the first quarter was 114 thousand, almost double the 60 thousand drop between the similar periods of the past year.
Figure 2: Employment rate of the 15–64 population in the Visegrád countries, 2000–2008
Source: Eurostat.
table 2: Economic activity of the 15–64 population in Hungary, quarterly
2007 2008 2009
Q3 Q4 Q1 Q2 Q3 Q4 Q1
Employment rate 57.7 57.1 56.1 56.5 57.3 56.7 55.1
Unemployment rate 7.3 7.8 8.0 7.7 7.8 8.0 9.7
Activity rate 62.2 61.9 61.0 61.2 62.1 61.7 61.0
Source: HCSO Stadat (LFS).
It is structural deficiencies that lie behind the low and very stable Hungar- ian activity rate and these are very hard to influence in the short run. A sig- nificant increase in employment would require a major development of the available labour force, the renewal of the education system, improvements in the conditions of commuting, and a strong stimulus of labour demand first and foremost through the reduction of the tax burden on labour. In Hun- gary, low employment is coupled by relatively low unemployment rates and very high inactivity. The exceptionally low job search intensity of the unem- ployed is mainly due to the low education level of those involved, the lack of job related skills and knowledge, the high commuting costs compared to res- ervation wages, the underdeveloped transportation infrastructure and, last but not least, poor labour supply incentives within the welfare system. Ad- aptation to the new situation created by the worldwide economic crisis is not an easy task in any country. Indeed, Eurostat data show that the drop in em- ployment rates was not the largest in Hungary between the third and fourth 50
60 70
Slovenia Slovak Republic Poland Hungary Czech Republic
2008 2007 2006 2005 2004 2003 2002 2001 2000
2 If we believed that it is only the crisis that makes 2007 and 2008 different, we could say that this is a difference in ap- proach to measuring its effect.
Naturally, there are others af- fecting the Hungarian labour market, most importantly the over-time effects of the austerity measures.
quarters of 2008 – Latvia, for example suffered a 2.5 percentage point loss.
Indeed, the 0.6 percentage point drop was exactly equal to the EU–25 aver- age. Unfortunately, no comparable data exists for the first quarter of 2009, so we can not compare that change to international benchmarks. It is expected however, that the structural problems behind the low employment rate will make adjustment more difficult than it would be in the case of a well func- tioning and flexible labour market.
Figure 3: trends in labour market activity, 1998–2008
Note: The right scale indicates the unemployment rate.
Source: KSH Stadat (LFS).
After 2004, unemployment began to increase. Expanding employment and increasing unemployment also led to a slight increase in the activity rate (Fig- ure 3). The government preferred to attribute the increasing job search activ- ity of the inactive population to the development of employment services and the improving of job prospects. Unfortunately, the analysis of labour market flows does not seem to support this interpretation. All trends seem to indicate that rather than the increasing job search activity of the inactive, the rise in unemployment has been caused mostly by the growing unemployment among the poorly educated young between 15–29 years of age and college graduates entering the labour market (Fazekas and Telegdy, 2007).
The impact of the budgetary restrictions was barely felt in 2007 and in 2008 – it was hard to separate from the impact of the global crisis. In 2007 and for the most part of 2008, there was little change in the size of the 15–64 popula- tion and in either the employed or the unemployed population. The share of firms planning to increase or decrease their workforce did not change signifi- cantly in the labour demand prognosis issued by the Public Employment Of- fice.3 The first signs of decreasing labour demand resulting from the fallback
50 60 70
Employment rate Activity rate
2008 2007 2006 2005 2004 2003 2002 2001 2000 1999
1998 5
6 7 8 Unemployment rate
3 See chapter Statistical Data in the volume for the data.
of economic growth are now visible. In 2008, the unemployment rate rose well above the previous trend, and instead of the usual seasonal drop in the first months of the new year, it showed a rapid rise to already approach double digits in the first quarter of 2009 (Figure 5). This increase shows a deviation from a trend expected on the basis of past experience by at least 65 thousand.
The vacancy rate varied around 10–12 vacancies per 100 job seekers between 2000 and 2005, but started to drop thereafter. In 2008, it reached an all time low value of 5.7 (Figure 4). Although this process had already started before the crisis materialised, it does make it less likely that the labour market can absorb the newly laid off.
Among all labour market indicators, it is unemployment that shows most closely the reaction of the labour market to the drop in demand. Still, it is stock measure and thus does not show the various influences whose combi- nation resulted in this increase. Unemployment increases by companies and businesses laying off employees and decreases through hiring over time. Lay- offs can occur one by one or en masse and can vary according to the differ- ent characteristics of the employee and the employer. Individuals laid off do not transform into unemployment necessarily and might find a job quickly – but the increase in the unemployment rate does not suggest this to be the case now. Layoffs cannot fully characterise the increase in unemployment, but their evolution is nevertheless indicative of the number of workers that has to be absorbed as a minimum by the labour market.
3 6 9 12 15
2008 2007 2006 2005 2004 2003 2002 2001 2000
1999 6
8 10
2009 2008
2007
Figure 4: reported vacancies per 100 registered jobseekers Figure 5: unemployment rate, 2007–2009
Source: National Employment Office. Source: KSH Stadat (LFS).
Based on data from the Public Employment Service, Figure 6 shows the number of mass-layoffs announced and the number of workers affected by the announcements between January 2000 and April 2009, the latest avail- able data point. The number of mass layoffs announced has increased after
November 2008, and the number of workers affected has increased even more so. Layoffs between November 2008 and April 2009 have affected a total of 28,415 employees, most of whom were working in the manufacturing indus- try and in the more developed, western part of the country. Although this figure is not low, it can in itself explain only around 40 percent of the increase in the level of unemployment (provided that the probability of transition from unemployment is low). The figure deliberately covers a longer period.
By looking at data from 2007 only, it might seem that the increase from the end of 2008 was huge. Looking at earlier data however, it seems that layoffs of this magnitude did occur earlier too, but did not lead to a comparable in- crease of unemployment.
Figure 6: the number of announced mass-layoffs and the number of workers affected, January 2000–april 2009, monthly
Source: Public Employment Service monthly first releases.
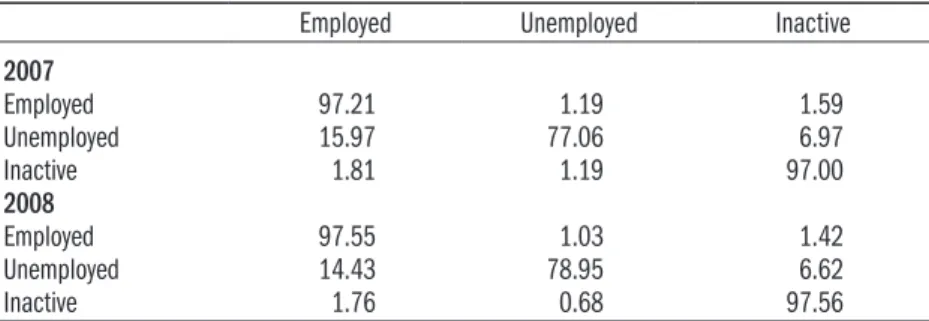
Using individual-level panel data from the LFS, we can take a look at the sta- bility of the unemployment state and the chance of escaping unemployment.
Connecting the indicator of economic activity with the same indicator in the next period shows the proportion of individuals who were in a given la- bour market state in the first period, and were in another in the second peri- od. In other words, we are looking at a set of transition probabilities, such as the probability that someone will be employed in the next quarter given that she or he is unemployed in the current quarter. Table 3 shows these transi- tion probabilities for the third and fourth quarters of 2008 and for 2007, as a
30 60 90 120 150
Number of announcements
2009 2008 2007 2006 2005 2004 2003 2002 2001 2000
1000 2000 3000 4000 5000 6000 7000 8000 Number of workers
affected by announcement
benchmark. It is interesting to see that prior to 2009, there is no sign of dra- matic changes in the labour market. The transition probabilities into unem- ployment or inactivity have not increased, but decreased. At the same time,
“staying” probabilities are higher for all states and also the escape probabili- ties from unemployment and inactivity have decreased. This indicates a sig- nificantly decreased flexibility of the labour market, but also shows that the drop in the unemployment rate was unexpected in the first months of 2009, as there was no increase in the employed-unemployed transition probability prior to that. All this evidence shows, in accord with Figure 4, that until the end of 2008, there was no significant change in turnover of the unemployed, that is the rise of the unemployment rate contributed to a great extent to the increase of the longer-term stock of the unemployed.
table 3: transition probabilities between the last quarters of the years 2007 and 2008
Employed Unemployed Inactive
2007Employed 97.21 1.19 1.59
Unemployed 15.97 77.06 6.97
Inactive 1.81 1.19 97.00
2008Employed 97.55 1.03 1.42
Unemployed 14.43 78.95 6.62
Inactive 1.76 0.68 97.56
Source: Calculations from HCSO LFS microdata.
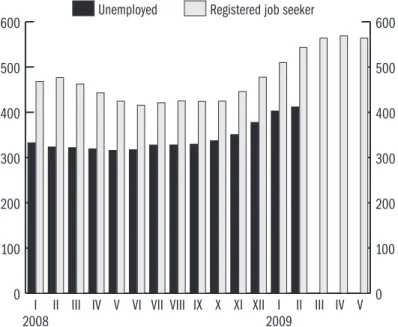
The registered unemployed and those characterised by the ILO definition are two overlapping, but distinct populations – there are unemployed persons searching for a job but not registered as such, and there are even more who are registered, but fail to fulfil some of the ILO criteria. Bearing this difference in mind, we can consider the always up to date information on the registered unemployed, extending as far as May 2009. As Figure 7 shows, the number of the registered unemployed has been on the rise since the autumn of 2008 and also after the beginning of the new year, similarly to the number of ILO un- employed. Recent figures show that after an increase of around 50 thousand in 2009, the first slight decrease is visible in May for the first time.
The government’s report on the implementation of the Second Nation- al Development Plan published for discussion by the social partners (Pro- gramme…, 2008) projected an annual economic growth of 2–3 percent and some expansion of employment for the years 2008–2013. Only two months later, the November 2008 inflation report of the Hungarian National Bank was already accounting for the gloomier prospects of world markets and forecast an annual 1–2 percent reduction of employment by 2010. Even the most recent forecasts expect a turnaround only after 2010. By 2008 the fast-
spreading global financial melt-down and the expected consequences in the real economy had made it inevitable for the government to review its previ- ous, very optimistic projections. The National Action Programme submitted to the European Commission in November 2008 for the implementation of the Lisbon Strategy (NFÜ, 2008) calculated on a GDP reduction of 4 per- cent and forecast an increase in employment only after 2010. In the spring of 2009 the government expected such growth only a year later and, in full ac- cord with the prognosis of the Hungarian National Bank, forecast that the GDP will shrink by 6.7 percent in 2009 and by around 1 percent a year later.
Sadly, given the actual GDP growth figures in Table 1, this forecast does not seem to be far-fetched.
Figure 7: the number of unemployed defined following the ILo criteria and the number of registered unemployed – in thousands
Source: HCSO Stadat (LFS) and PES data.
Note: the numbers following the ILO definition are three month moving averages starting at the indicated month
As we have seen, today we still have limited knowledge of the relatively slowly unfolding labour market impacts of the economic crisis. The direction of ad- aptation, however, is determined not only by recent unemployment data but also by the structure of the labour market that has evolved over recent years.
For the past 18 months, the Hungarian economy has been characterised by relatively high nominal wage growth. Private sector firms gradually harmo- nised with the very significant salary increases implemented in the public sector since 2002 (see Figure 16 below). Based on the evaluation of the Hun-
0 100 200 300 400 500 600
0 100 200 300 400 500 Registered job seeker 600
Unemployed
V IV III II I XII XI X IX VIII VII VI V IV III II I
2009 2008
garian National Bank, this would more likely force companies to respond to decreasing demand by reducing employment. Therefore, we can expect mas- sive layoffs in 2009 and unemployment may grow by over 2 percentage points.
The May 2009 inflation report of the Hungarian National Bank estimates that 180,000 people will lose their jobs, primarily in the private sector.
Undoubtedly the layoffs in the private sector will affect not only the number of unemployed but also their composition, which seems to be supported by the fact that the unemployment rate is growing in parallel with dismissals. Ear- lier the majority of the unemployed were poorly educated people and young adults entering the job market. In 2009, however, the tendency of the previ- ous years is taking a sharp turn: as a result of the increasing number of factory close-downs and lay-offs, the share of skilled workers among the unemployed is on the rise. It is unfortunate that neither the unemployment benefit system nor the labour market organization is prepared for the challenge of this new, and fundamentally different, situation.
Although growing unemployment among the active population is an alarm- ing trend, the low level of Hungarian employment, for the most part, can be explained by low activity. The analyses attempting to uncover the roots of the problem (Köllő, 2005, 2006; Fazekas 2006; Scharle, 2008) primarily attribute the low Hungarian employment rate to the following factors:
– people with poor education represent a large group and their employ- ment rate is very low,
– employment is relatively low among the population aged 15–25,
– employment is also low among older workers aged 55 and older and near the statutory retirement age,
– employment of women is low and especially low among mothers with small children
– employment is extremely low in disadvantaged regions and small settle- ments.
Looking beneath aggregate trends, we may discover some changes in the employment situation of these groups. Unfortunately, the past two years have presented a deteriorating rather than an improving tendency.
Differences by educational attainment, age and gender
Figure 8 indicates that the exclusion of the poorly educated from the labour market has become more significant over the past two years. The total employ- ment rate rose with the increasing share of educated workers, but employment rates have fallen in all educational sub-groups except for college graduates.
Among those with only 8 years of primary and those with vocational education there is a very drastic fallback of 3–5 percentage points (approx. 8 percent).
Unemployment has increased primarily within this group since 2004. The unemployment rate for those with 8 years of primary school or less increased
from 12 to 18.5 percent between 2004 and 2008, while the employment rate increased significantly only among college and university graduates.
The outbreak of the crisis has changed the long-term trend to some extent.
Following its usual seasonal variation, the number of unskilled and college- educated registered unemployed has increased up to December 2008. Dif- ferently from its former cyclical behaviour, the former increased by around 16 thousand and the latter has not decreased but increased by 2 thousand from January to May. This implies that the remaining 36 thousand of the total increase of 54 thousand must be attributed to a rise in skilled, but less than college-educated employment having worked for the hardest hit manu- facturing sector.4
The expansion of employment shows considerable variation across gender and age groups. The employment rate significantly dropped among young peo- ple (15–19 and 20–24 age groups) due to increasing unemployment among poorly schooled new entrants and, more importantly, due to the expansion of higher education. It is mostly men in the 30–50 age group who experienced employment growth. No doubt, the expansion of employment is closely related to the increase in the statutory retirement age: employment increased signifi- cantly only in the age group affected. Over the past ten years, the employment rate has grown by over 15 percentage points among women between 50–54, over 20 percentage points among men between 55–59 and over 25 percentage points among women between 55–59 years of age (Figure 9).
–6 –5 –4 –3 –2 –1 0
1 Men Women
Higher education Secondary
Vocational secondary
Primary 0
5 10 15 20 Higher education 25
Secondary
Vocational secondary Primary
2008 2007 2006 2005 2004 2003 2002 2001 2000 1999 1998
Figure 8: Employment and unemployment rate by educational attainment, 1998–2008
Employment rate by educational attainment and gender, Unemployment rate by educational attainment, 1998–2008 1998–2008 (percentage point)
Source: KSH Stadat (LFS)
4 Note that when looking at the effect of individual character- istics, the difference between registered and ILO unemploy- ment can be even wider than it is on average, due to the potential effect of the characteristics on job search.
Figure 9: Employment rate differences by age and gender, 1998–2008 (percentage point)
Source: KSH Stadat (LFS)
A similar number of men and women have lost their jobs since the crisis began, and no significant change has happened in the employment rate of men and women over the past years. In 2008, 63 percent of the male 15–64 age group were employed, which was 12.4 percentage points higher than the 50.6 per- cent employment rate among women in the same age group. Figure 10, how- ever, clearly indicates the significant change in women’s unemployment over the recent years. In the decade following the change of the political regime, unemployment was 20 percent lower among women than among men. The relative position of women began to significantly worsen in 2001 and since 2006 there has been an improvement. Since 2004 the female unemployment rate has been higher than that of men; this difference was as high as 10 per- cent in 2006 and even in 2008 there was a 5 percent gap.
Figure 10: Female unemployment and employment as a percentage of the male unemployment and employment rate, 1998–2008
Source: KSH Stadat (LFS) –20
–15 –10 –5 0 5 10 15 20 25
30 Men Women
65–74 60–64 55–59 50–54 45–49 40–44 35–39 30–34 25–29 20–24 15–19
60 80 100
120 Unemployment rate Employment rate
2008 2007 2006 2005 2004 2003 2002 2001 2000 1999 1998
Rising unemployment among women has, in part, to do with the increase of the retirement age for women. Labour market activity, employment and un- employment have all increased in the age groups affected by the increased age limit. Another factor contributing to increasing unemployment among women was the massive layoffs in the public sector over recent years. Between 2003 and 2007, the number of civil servants has been decreasing at an average an- nual rate of 20,000. Since more women work in the public sector than in the private sector, the dismissals here had a larger impact on women than on men.
Both before and since the beginning of the crisis, the economic slowdown has had a larger impact on the private sector and consequently on men, explaining the recent reversal of the earlier trend in female unemployment.
Sectoral and regional differences in employment and unemployment
According to the Labour Force Survey of the HCSO in 2007, 88 percent of the total employed population were paid employees. Due to the budgetary restrictions, in 2007 the number of employees in the public sector was re- duced by 50,000, which is over 6 percent. This negative trend was somewhat balanced out by the increased employment in the private sector. However, in 2008 the public sector (except for public administration) continued to shrink and unemployment increased even in the private sector in a number of indus- tries. Despite being closely related to the crisis, the real estate and the finan- cial sector were able to close the year with an employment increase of 20 and 10 percent respectively, while the transportation, construction and energy industries suffered a loss of 14, 21 and 12 percent respectively. (Figure 11).
Although we do not yet know for sure in which sectors the employment loss was the greatest in the first part of 2009, mass layoff figures suggest this to be manufacturing. In April 2009, 60 percent of the firms announcing mass layoffs and 76 percent of the persons affected by them were in this sector.
Disparities in employment and unemployment across regions and small re- gions have seen little change despite all the government subsidies and EU co- hesion grants provided for development goals, substantial job-creation subsi- dies, and widely used active labour market programmes. Quite the contrary:
an even more powerful polarization is visible in the country. Employment was relatively high (55 percent) in Central Hungary and the western and central Trans-Danubian counties while the employment level in the rest of the coun- try was around 43–48 percent in late 2008 (Figure 12).
Ironically, it is the crisis which might be the influence with the greatest equalising power regarding unemployment. While registered unemployment has grown by 24 percent in the western part of the country (excluding South- ern Transdanubia), the growth was only 6 percent in the remaining part. At the same time, hiring shows a geographically more even distribution. Except
for the Northern Great Plain, the drop in hiring compared to the same months is between 35–45 percent for all regions.
Figure 11: changes in the number of employees by industry, 2006–2007 and 2007–2008 (percent)
Source: KSH Stadat (LFS).
Figure 12: Employment rate in the planning regions, 1998–2008
Source: KSH Stadat (LFS)
A more accurate picture of regional disparities emerges from the analysis of small regions or settlement-level data. The unemployment register of the Pub- lic Employment Service indicates that in recent years there has not been any significant change in the differences of unemployment rates across sub-regions and between the specific settlement types. Figure 13 shows the evolution of the relative differences in registered unemployment. With the small regions arranged into deciles based on their unemployment rate, the lines in the fig-
–25 –20 –15 –10 –5 0 5 10 15 20 25
2007-2008 2006-2007
Total Other public servicesHealthcareEducation Public administrationAccommodationTransportationManufacturingConstructionReal estateAgricultureFinancialEnergyTrade
40 50 60
Southern Great Plain Northern Great Plain Northern Hungary Southern Transdanubia Western Transdanubia Central Transdanubia Central Hungary
2008 2007 2006 2005 2004 2003 2002 2001 2000 1999 1998
ure indicate for each decile the ratio of the average and the median unem- ployment rate, thus controlling for fluctuations in the level of unemployment.
Apparently, most of the large and stable differences result from the very high unemployment rates of the small-regions that belong to the top two deciles.
The relative situation of the top two deciles with the highest rates somewhat improved between 2002–2006 but has worsened over the past two years. 10–
11 percent of Hungary’s population live in regions where unemployment is above 20–22 percent (28 percent for the top decile), where estimates put the employment rate of the 15–64 group at 36–50 percent and where no improve- ment but actually deteriorating employment conditions can be expected.
Figure 13: Variation in registered unemployment across small regions, 1991–2008
Figure 14: registered unemployment by settlement type, 1990–2007
Note: the average unemployment rate of the specific settlement types divided by their median unemployment rate.
Source: MTA KTI employment database.
Figure 14 shows the evolution of relative differences in average unemployment rates by settlement type. The discrepancies are stunning. In 2007 the share of
0.0 0.5 1.0 1.5 2.0 2.5 3.0 3.5
2008 2007 2006 2005 2004 2003 2002 2001 2000 1999 1998 1997 1996 1995 1994 1993 1992 1991
0.0 0.5 1.0 1.5
2.0 Median
Village with less than 500 residents Village with 500–1000 residents Village with 1000–2000 residents Village with 2000–5000 residents Village with more than 5000 residents Other town
County town Budapest 2007
2006 2005 2004 2003 2002 2001 2000 1999 1998 1997 1996 1995 1994 1993 1992 1991
the registered unemployed in the working age population of villages with less than 500 residents was 13.7 percent, while the same indicator was only 2.3 percent in Budapest and 5.7 percent in county towns. The figure shows that the relative situation of settlements with less than 5000 residents worsened in the early 2000s but then somewhat improved in recent years. One should note however that the share of the inactive population is extremely high in the most disadvantaged settlements.
2. WagES bEtWEEn 2001 and 2008
In 2008 the average gross earnings of full-time employees was HUF 199,000, equal to net HUF 122,000. The gross income of civil servants was 14 percent higher than the earnings of private sector employees. Figure 15 illustrates the increase of the net real wage and the GDP between 2001 and 2008. As a re- sult of the budgetary restrictions, the decrease was followed by stagnation in 2008. The evolution of wages was in line with the slow-down in GDP growth following the crisis.
Figure 15: net real wage and gdp growth, 2001–2008
Source: KSH Stadat.
Figure 16 illustrates the increase of the net real wage in the private and the public sectors between 1998 and 2008. It is clear that after the large pay rise in the public sector in 2001–2, wage increases in the private sector have tended to exceed those in the public sector. Hence, the wage advantage of the public sector dropped from 22 percent to 12 percent between 2002 and 2008. The figure does not yet show the impact of abolishing the 13th monthly salary, which would further reduce the advantage of the public sector.
80 100
120 Net real wage GDP
2008 2007 2006 2005 2004 2003 2002 2001
Figure 16: Wage ratio between the private and the public sector, 1998–2008
Source: Inflation report of the Hungarian National Bank. November 2008.
Figure 17: real wages of employees, 2006–2007
Source: KSH Stadat.
The gender wage gap
In 2007 the average gross income of full-time employees in Hungary was HUF 188,000. For men the average was HUF 202,000 and for women HUF 173,000, showing a sizeable gap in line with the long-term trend. Women’s wages fell 14.6 percent short of men’s in 2007, which is 1.8 percentage point higher than a year before and even above the 2005 figure (13.9 percent) (PES, 2008). The gender-wage gap is not unique to Hungary but is typical world- wide. From the very beginning, the European Union have made efforts to es- tablish equal employment opportunities: the 1957 Treaty of Rome included the principle of “equal pay for equal work”; in 1997 equal employment op-
–25 –20 –15 –10 –5 0 5 10
2008 2007 2006 2005 2004 2003 2002 2001 2000 1999 1998
–5 0 5 10 15 20
Total Other community and personal servicesHealthcare and social servicesEducation Public administration, defence, mandatory social securityReal estate , economic servicesFinancial services Transportation, storage, postal service, telecommunicationsElectricity, gas, steam and water supplyAccommodation services, hospitalityTrade, vehicle repairManufacturingConstructionAgricultureMining
portunities for men and women were included among the directives; in 2003 the European Union issued a directive to reduce wage differences between the genders by 2010.
From 24 percent in 1997, the wage difference between men and women in Hungary had dropped to the EU–27 average by 2002. In 2006 the aver- age salary for women was 11 percent less than for men, which was no major change to the year before but a significant drop compared to a decade ear- lier.5 The salary corrections implemented in the budgetary sector after 2001 were a major factor in reducing the wage difference between men and women since more than half of the public servants (68 percent in 2007) were women (PES, 2008).
A number of factors contribute to the gender wage gap: variation in the characteristics of the employers (branch of industry, ownership, size, legal form, location, etc.) and in the characteristics of employees (age, education- al attainment, employment history, family background, etc.). In addition to the characteristics of the labour market mentioned above, the lower earn- ings of women compared to men could also result from discrimination in the job market.
Concerning the wage gap by industry, in 2007 women continued to enjoy an advantage in fishing (0.1 percent), construction (15.3 percent) and were paid only a little less than men in mining (4.3 percent) and transportation, storage, postal service, and communication (1.9 percent). It should be men- tioned however that the number of women employed in those sectors is rela- tively low compared to the total workforce and they typically hold white-col- lar jobs that result in higher salaries than for the blue-collar male workers.
The disadvantage of women compared to men is largest in the financial sec- tor (41.7 percent), manufacturing (28.1 percent), and accommodation and hospitality (27.3 percent).
When considering the characteristics of employers, experience shows that the wage difference of women tends to increase with age and wage band, and is also higher for married women compared to their unmarried peers (Koncz, 2008). When examining the wage gap in main employee categories, the dis- advantage of women is larger within the groups of blue-collar and white-col- lar workers than combined (Figure 18). This is explained mostly by the fact that 56–57 percent of working women are white-collar workers and white- collar men and women tend to earn more than blue-collar workers. The fe- male-male wage ratio for white-collar workers was around 60–67 percent between 1998 and 2007, which is 10 percentage points lower compared to that of blue-collar workers. The larger wage gap of white-collar workers may be attributed to the fact that men are more likely to fill executive positions with higher salaries than women.
5 http://epp.eurostat.ec.europa.
eu/tgm/graphToolClosed.do?t ab=graph&init=1&plugin=1&
language=en&pcode=tsiem0 40&r=true&toolbox=legend.
Eurostat, Downloaded: 22 Sep- tember 2008
Figure 18: Women’s gross wages as a percentage of men’s, 1998–2007
* Based on the tables presented in the Statistics chapter.
Source: Based on page 127 of KSH (2007).
Based on international and Hungarian experience, it is fair to say that beside labour market discrimination and the different characteristics of employees, the gender wage gap is also determined by employment segregation, i.e. fe- male employees are concentrated in certain professions. Such typical female occupations include sales, cleaning, administrative personnel, dressmaking, kindergarten and primary school teachers and caregivers.
When examining the wage gap across levels of education, data suggest that women with college degrees suffer the largest disadvantage. In 2007, wom- en with three or four-year college degrees had a disadvantage of 30.5 percent while those with five-year university degrees earned 23.6 percent less than their male counterparts. The gap was smaller for those with 2–3 years of vo- cational education (21.7 percent), 4 years of general secondary education (17.6 percent), 4–5 years of vocational education (16 percent), those with incom- plete primary education (12.8 percent) and also for those with 4 years of vo- cational secondary education (with A levels) (12.4 percent).6
Regional wage differences
The decades following the transition to a market economy witnessed a steady rise in the raw wage differential (i.e. differences including composition-effects) between Central Hungary, the Central and West Trans-Danubian region and the rest of the country. From the turn of the millennium these differences be- gan to decrease but over the past two years a slight increase has been visible.
In 2007 only the South Trans-Danubian region was able to produce a higher wage increase than Central Hungary (Figure 19).
60 70
80 Blue-collar White-collar
2007*
2006*
2005*
2005 2004 2003 2002 2001 2000 1999 1998
6 See chapter “Statistical Data”
in the volume for the data.
Figure 19: average gross earnings as a percentage of the national average, 2001–2007
Source: FSZ Wage tariff record
table 4: monthly gross earnings by region
Region
2006 2007
HUF previous
year = 100 HUF previous
year = 100
Central Hungary 212,001 109.9 229,897 108.4
Central Trans-Danubian region 157,824 106.9 173,937 110.2 West Trans-Danubian region 156,499 107.4 164,378 105.0 South Trans-Danubian region 144,189 105.8 156,678 108.7
North Hungary 152,521 109.1 159,921 104.9
Northern Great Plains region 142,142 108.4 153,241 107.8 South Great Plains region 143,231 109.8 153,050 106.9
Total 171,794 108.9 186,229 108.4
Source: KSH.
The data in figure 9.5 in the Statistics chapter of this volume indicate that the differences by county are even more significant and have shown no de- cline. An analysis of the causes behind regional wage differences indicate that regional differences in wages, for the most part, are attributed to variations in the composition of the workforce and in the productivity of firms. Once these two factors are controlled for, regional wage differences appear to have significantly declined in the second half of the 1990s, while no significant change has occurred in this respect in recent years.
concLuSIonS
Until the second half of 2008, the Hungarian labour market was relatively unchanged compared to previous years both in terms of its structure and its main institutions. The effects of the convergence programme launched in 60
90 120 150
Central Hungary Central Transdanubia Western Transdanubia
Southern Transdanubia Northern Hungary
Northern Great Plain Southern Great Plain 2007
2006 2005 2004 2003 2002 2001