International Communications Market Report 2010
Research Document
Publication date: 2 December 2010
Contents
Key Points 7
1 The UK in context 15
2 Comparative international pricing 67
3 Television and audio-visual 109
4 Radio & audio 181
5 Internet and web-based content 205
6 Telecoms 253
7 Appendix A : Basic data used in the report 349 8 Appendix B: Consumer research methodology 353 9 Appendix C : Price benchmarking methodology 379
10 Glossary & Table of Figures 403
Introduction
Purpose of this report
This is the fifth year that Ofcom has published comparative international data on the communications sector, benchmarking the UK against comparator countries. It aims to provide a statistically-driven international comparative context for the UK communications sector. This is a core responsibility for Ofcom, enabling us to assess how the UK market is performing in an international context.
Putting the UK market into an international context is essential to allow us to benchmark the availability, take-up, use and pricing of communications services. International developments are also becoming increasingly important to the experience of UK consumers in using
communications services, as service provision globalises, technological innovation breaks down traditional national market boundaries, and international bodies (such as the European Commission, the GSMA and the ITU) become increasingly important in informing regulatory policy and defining technological standards.
We are publishing this report to help fulfil our commitment to research markets constantly and to remain at the forefront of technological understanding, and it meets the commitment we made in our 2009/10 annual plan. It complements other research published by Ofcom and forms part of the Communications Market series, which includes a UK report and specific reports for England, Northern Ireland, Scotland and Wales (all published in August 2010).
This report is used widely to support our policy development, in order to benchmark the UK’s communications sector, to learn from market and regulatory developments in other
countries, and to inform the context of Ofcom’s regulatory initiatives. It also contributes to the richness of information we draw upon – alongside other publications such as our Consumer Experience reports and, of course, the UK Communications Market – to enable us to understand how our actions and priorities influence outcomes in markets and,
ultimately, for consumers. However, the report itself does not draw any policy conclusions.
Rather, we present the data in a factual and statistical report. We hope that this will act as a useful reference tool for stakeholders, as well as providing support to our policy development The information set out in this report does not represent any proposal or conclusion by Ofcom in respect of the current or future definition of markets and/or the assessment of licence applications or significant market power or dominant market position for the purposes of the Communications Act 2003, the Competition Act 1998 or other relevant legislation.
Scope of the report
The report compares the availability, take-up and use of services in the UK and 16
comparator countries - France, Germany, Italy, the US, Canada, Japan, Australia, Poland, Spain, the Netherlands, Sweden, Ireland, Brazil, Russia, India and China, although we focus on a smaller sub-set of comparator countries for some of our analysis.
Data and methodologies
Data in this report generally cover the 2009 calendar year. We show trends using a five-year historical time series wherever possible.
All currency conversions use the average market exchange rate during 2009, as provided by the IMF. We have opted to convert data from every year at this fixed rate, so that currency fluctuations do not obscure market trends. The exception to this methodology is in the
international price benchmarking analysis, where we have used purchasing power parity adjusted exchange rates. All figures are nominal unless otherwise stated.
The document draws on a combination of desk research and discussions with industry bodies, operators, regulators and commentators. The data were gathered with the support of consultancy firm IDATE, which has attempted to verify sources and provide market
estimates where data are incomplete. Telecoms pricing consultancy Teligen built a bespoke model to enable our analysis of comparative international pricing and populated it with specifically-sourced tariff data (collected in July 2010). Comparisons between data in this report and its predecessors will not always be possible, owing to changes in definitions over time, in the method of collecting data and due to the availability of new data sources.
Similarly, some UK data published in this report may not be directly comparable with data published in other Ofcom reports, such as the UK Communications Market Report.
Among others, thanks are due to Analysys Mason, PricewaterhouseCoopers, Screen Digest, the European Audiovisual Observatory, Warc, Producers Alliance for Cinema and Television (Pact), Cullen International, The Nielsen Company, The European Interactive Advertising Association Mediascope Europe 2010, Efficient Frontier, Credit Suisse, UK Trade and Industry (UKTI), Mediametrie, Eurodata TV Worldwide, the Television Research Partnership (TRP), and the European Broadcasting Union (EBU) for the permissions they have given us to use their data.
We endeavour to ensure that data in this report are comprehensive and the most accurate currently available. However, with a document so wide in scope, and with reliance on third parties for some data, there will always be omissions and occasional inaccuracies.
Comments and feedback on this report are welcomed at [email protected].
Executive summary: the experience of UK consumers compared to those in other countries
The data within this report tell an interesting story about how the global communications sector is evolving, and paint a broadly positive picture about how UK consumers continue to have comparatively high levels of use of communications services, are at the forefront of the use of new technologies, and benefit from lower prices than those available to consumers in many other countries.
Overall, we find that globally communications markets are changing at a rapid pace. People are becoming increasingly connected – there were around 500million new mobile
connections in 2009. This means that there are now around six mobile connections for every ten people in the world, and new devices and services such as smartphones, digital video recorders (DVRs), high-definition TV and a whole raft of online services are dramatically changing the way consumers all over the world communicate with each other and consume media content.
And we find that consumers in the UK are at the forefront of many of these changes. Levels of broadband and mobile take-up are higher than in most of our comparator countries; the UK has the highest take-up of digital TV, DVRs and digital radio among all the countries we looked at for this report. Smartphone ownership is growing faster in the UK than in other countries, and penetration is higher than in all our comparator countries with the exception of Italy. UK mobile users are also more likely to use social networking services than those in the other countries for which we have data
Yet the use of ‘traditional’ communications services in the UK also remains more resilient than in many other countries. Across all of the countries we examine there has been a decline in the use of fixed-line voice services as people increasingly use mobile phones, but
the decline in fixed-line voice has been less marked in the UK than in other countries, both in terms of overall connections and in call volumes. And, while use of the internet continues to increase in the UK and in other countries, the UK consumer on average watched the same amount of television in 2009 as in 2008.
Consumer take-up and use of communications services therefore compares favourably to that in other countries. Related to this, our analysis finds that the prices available to UK consumers are relatively low. Mobile prices are lower in the UK than in five other comparator countries (France, Italy, Germany, Spain and the US) for all but the lowest-use connections, and fixed-line voice pricing is also lower than in all the other countries, except for low users.
However, we also note that overall fixed-line voice prices in the UK increased slightly between July 2009 and July 2010, while it fell in the other five countries, and that the fall in mobile prices in the UK was lower than in the other countries. The price of basic and premium pay-TV packages is more expensive in the UK than in most other countries, although we note that variation in numbers and types of channels and different types of programme content means that like-for-like comparison is difficult.
There are some areas where the UK trails behind other countries. Only 0.2% of UK
households had a super-fast broadband connection at the end of 2009, compared to 34% in Japan, 12% in Sweden and 7% in the US. And while HSPA+ and LTE deployments are beginning to deliver high-speed mobile services in some countries (offering theoretical maximum speeds between 21Mbit/s and 100Mbit/s), no UK mobile operator has yet upgraded its network beyond HSPA. However, we also compare deployment plans for superfast broadband and report that by 2015, two-thirds of UK households should have access to services of ‘up to’ 40Mbit/s or higher, a larger proportion than in most other countries.
Structure of the report
The report is divided into six chapters:
• The UK in context (page 15) provides a broad overview by looking at comparative international communications markets from an industry perspective, from a consumer context and by comparing regulatory contexts. We then present a brief overview of three key ways in which communications markets are globalising.
• Comparative international pricing (page 67) compares the typical prices people pay across our main comparator countries, for a range of different ‘baskets’ of
communications services.
• Television and audio-visual (page 109) considers recent developments in both broadcast and on-demand services and compares the industries and consumer experience among our comparator countries. We also include a section comparing local TV in the UK to that in other countries.
• Radio and audio (page 181) compares and contrasts radio listening across our comparator countries, including the use of digital platforms. We compare the
revenues generated, and in the radio listener section look at differences in PSB radio around the world.
• Internet and web-based content (page 205) focuses on two recent developments that are influencing the wider communications markets around the world – the take-up of smartphones and the growth of internet advertising. It then provides a comparative overview of internet take-up and use in our comparator countries.
• Telecoms (page 253) examines how global revenues flattened during 2009 even while use continued to increase. We examine the different contexts for deployments of superfast broadband networks and different levels of Voice over IP take-up. We then analyse the communications sectors in our comparator countries from an industry perspective before examining consumer take-up and use of telecoms services.
We also include a list of key points for each of the chapters, which serves as a summary of the main findings.
Key Points
Key points: the UK market in context
• Global communications sector revenues were largely flat in the year to 2009, growing just 0.3% to £1,113bn. (Page 18).
o Global telecoms service revenues rose 1% to £878bn in 2009
o Global television revenues fell 1% between 2008 and 2009 to £208bn, reflecting falls in advertising
o Global radio revenues fell 9% between 2008 and 2009 to £28bn, reflecting falls in advertising revenues
• Total UK telecoms, radio and television revenue was £39bn in 2009. The US, Japan and China have the largest communications sector revenues of our
comparator countries, at £276bn, £100bn and £70bn respectively, but revenue per head is highest in the US (£899), Australia (£808) and Japan (£790). This compares with the UK at £630 per head. (Page 21).
• Global advertising expenditure fell by 13% to £254bn in 2009. TV remained the largest single component, accounting for £97bn of revenues (38% of the total) – a fall of 9% from the previous year. Online was the only growth area, rising by 1% over the same period to £37bn, 15% of the global total. The internet accounted for a larger proportion of advertising spend (27%) in the UK than in any other comparator country. (Page 23).
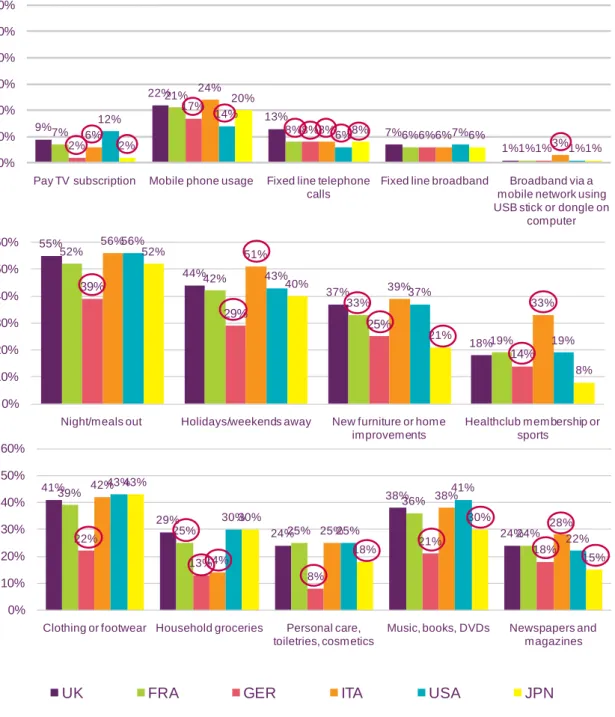
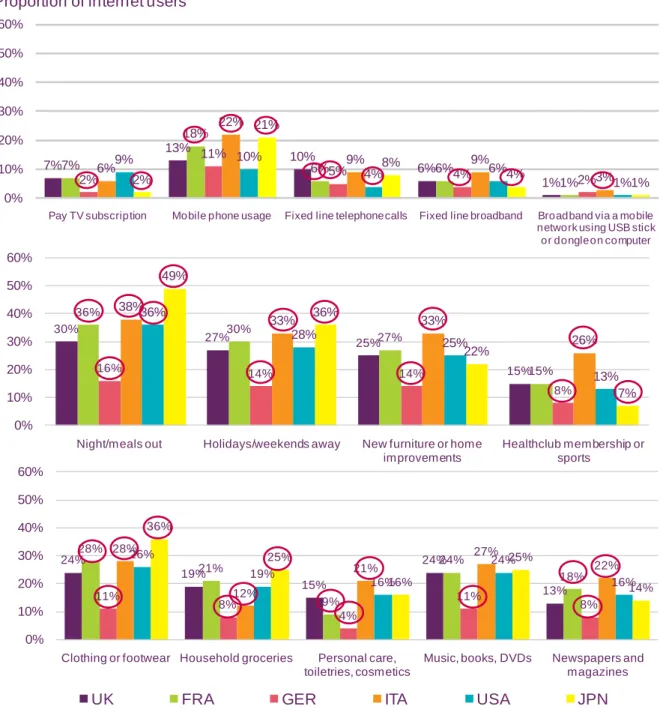
• Consumers appear less likely to have reduced their expenditure on
communications than on other goods and services. Our online survey in six countries found that the UK was in line with several other countries, while Germany had the lowest proportion of consumers who had reduced their expenditure on a range of goods and services. (Page 30).
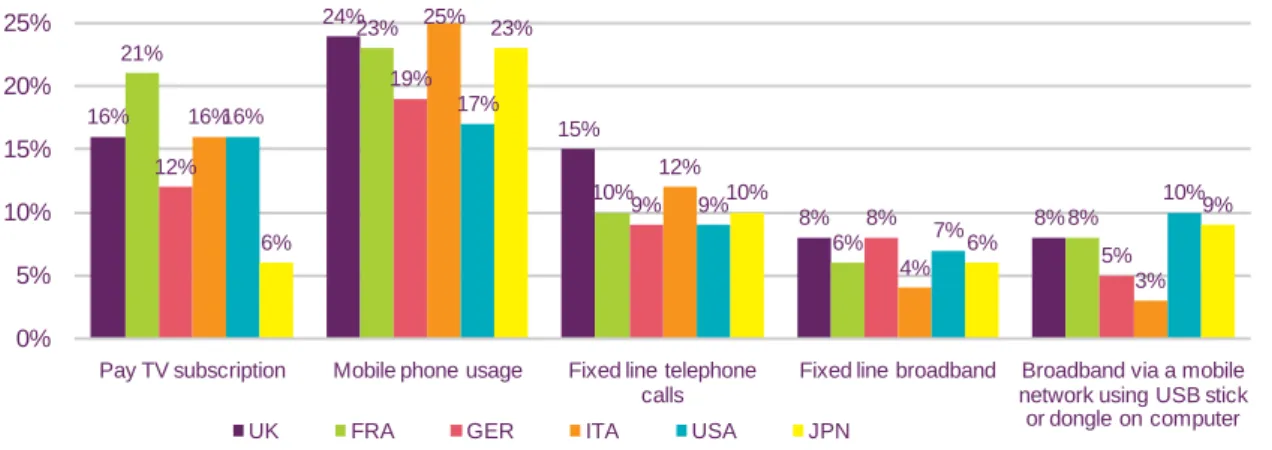
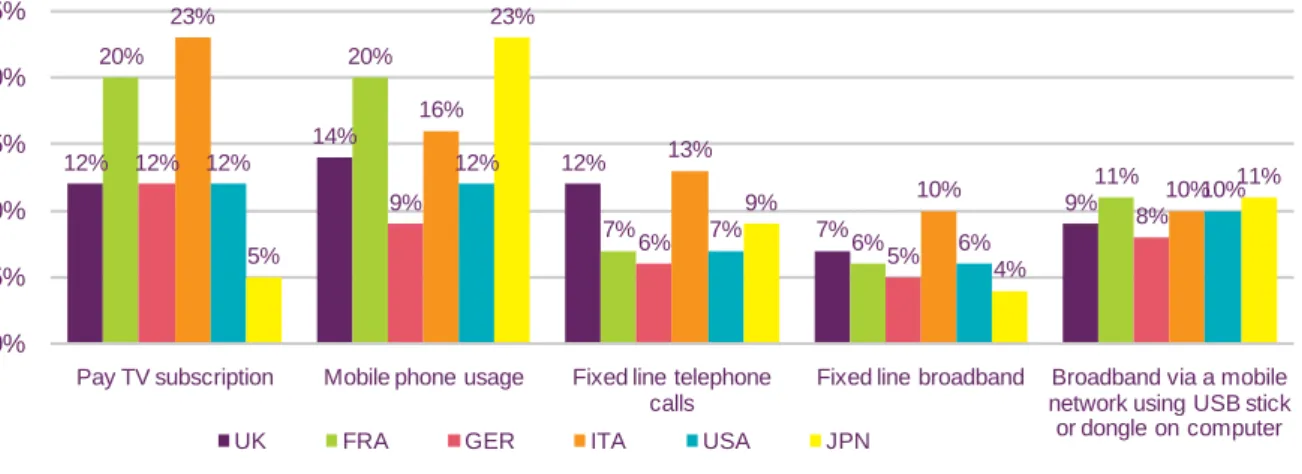
• The communications service on which most survey respondents had reduced expenditure over the past 12 months was mobile, where 24% in the UK said they had lowered their expenditure. The country with the highest proportion of mobile users saying they had reduced expenditure was Italy (25%) and the lowest was the US (17%). (Page 28).
• Spend on broadband has been generally more resilient than on other
communications services. Eight per cent of fixed broadband users in the UK and Germany said they had reduced spending on the service in the previous 12 months, and just 4% in Italy said they had reduced their spend on broadband. (Page 28).
Key points: comparative international pricing
• Overall, prices in the UK compare favourably to those in France, Germany, Italy, Spain and the US. We compared the pricing of five ‘baskets’ of services
representative of the communications use of five typical households and found that the UK offers the lowest prices for four of the five baskets when looking at the
‘weighted average’ of single-service pricing, and for three of the five baskets when looking at ‘best-offer’ pricing. (Page 106).
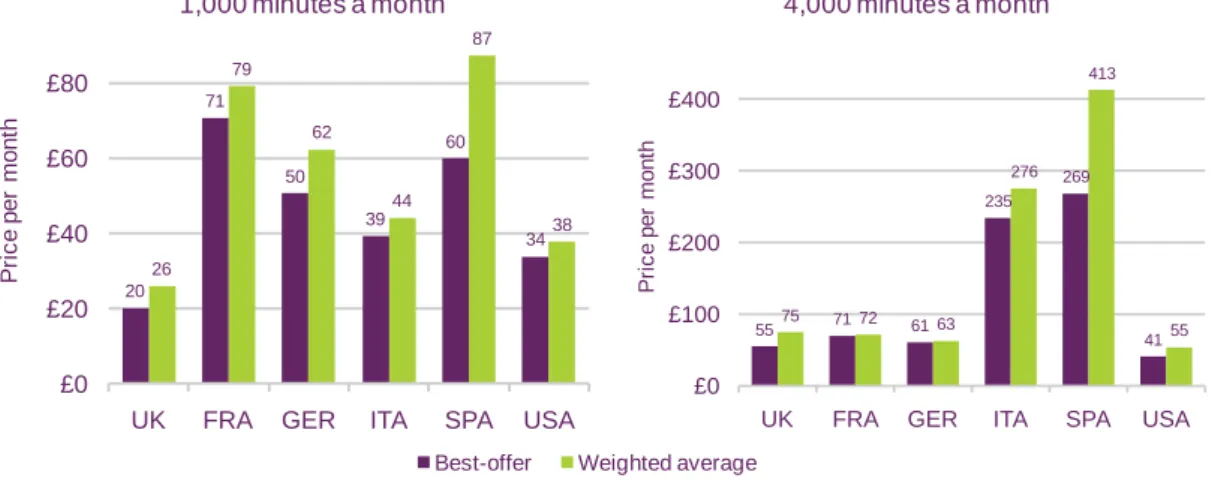
• Much of this difference is due to lower mobile prices in the UK than in the other countries – with the UK offering the lowest prices both in terms of ‘weighted average’
pricing and best-offer pricing for all of the mobile connections we looked at except the very low-use connections (60 minutes a month), where Italy and Germany offer lower pricing. (Page 78).
• Although overall mobile prices in the UK are lower than in the other five
countries, the gap is narrowing; prices fell by 8% in the UK between July 2009 and July 2010, compared to falls of 24% in Italy, 23% in Spain, 16% in France and 11% in Germany. (Page 80).
• Fixed-line voice pricing in the UK also compares favourably to that in the other five countries. As calculated from the weighted average of the best-value tariffs from the three largest operators in each country, the UK offers the lowest pricing of the six countries for three of the four baskets, with France and the US less expensive than the UK for the lowest-use basket. However, prices increased in the UK between July 2009 and July 2010, whereas they fell in all other countries. (Page 77).
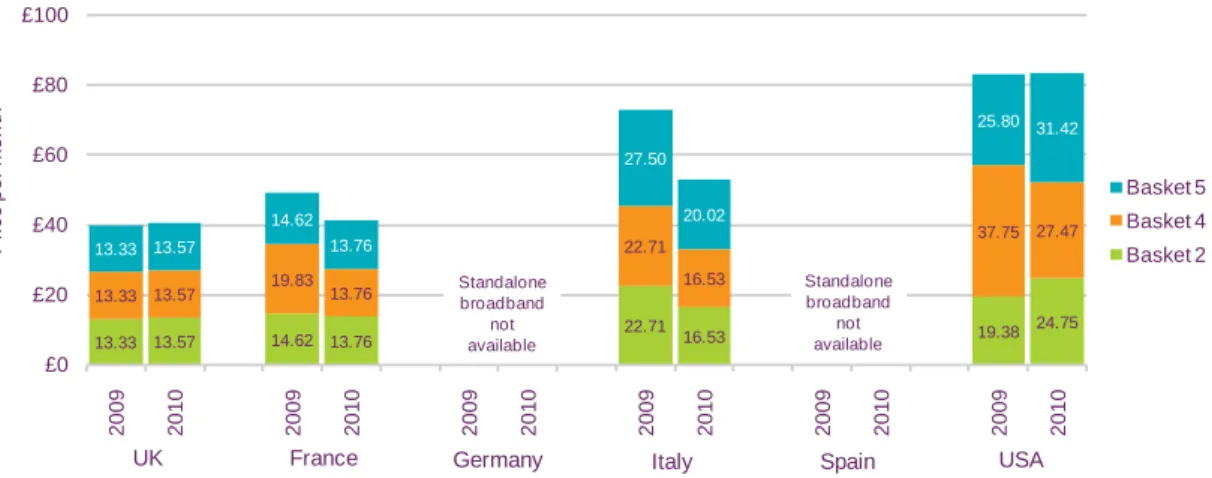
• For stand-alone broadband, pricing in the UK, along with France, is lower than in the other countries. However, comparisons of stand-alone broadband are not very useful as most broadband in all the European countries we consider is purchased with a ‘bundle’ along with at least one other service – and stand-alone broadband is not available from the largest operators in Germany and Spain. (Page 82).
• In all the European countries analysed, consumers can make significant savings by purchasing ‘dual-play’ (voice and broadband) or ‘triple-play (voice, broadband and TV) bundles rather than subscribing to the lowest-price stand- alone services. In the UK, the best price for a basic ‘voice and broadband’ dual-play bundle was 15% lower than the lowest price achievable by purchasing the services separately, the price for a triple-play service, including basic pay-TV, was 10% lower than stand-alone services, and the price for a triple-play bundle, including premium pay-TV (sport and movies), was 17% lower than for stand-alone services. (Page 74).
• In terms of bundled services, pricing in the UK compares favourably with other countries for a basic bundle of broadband and voice services, but once a pay-TV requirement is also included, pricing in the UK is comparatively more expensive.
Among the European countries, the UK is the most expensive for a basket of fixed voice, fixed broadband and basic pay-TV services, and France and Italy are less expensive for a basket of fixed voice, fixed broadband and premium TV services.
(Page 75).
Key points: TV and audio-visual
• Global TV revenues declined in 2009, by 1.0% year on year to £208bn. Growing income from pay TV providers – up by 5.8% to £102bn - failed to offset declining TV advertising revenue in 2009. Net TV advertising revenue fell by 8.9% year on year from £95bn to £86bn. (Page 112).
• With digital switchover already completed in five comparator countries and imminent in several others, digital TV penetration rose across all the countries included in our analysis during 2009. In the UK and Spain 91% of homes took digital TV, followed by the USA (83%) and France (81%). (Page 114).
• At the end of 2009, there were over 400 million digital TV households across all comparator countries, an increase of nearly a quarter (24.5%) compared to 2008. Spain (17 percentage points) and Poland (11pp) saw the highest rate of digital take-up, compared to lower rates of digital migration in more mature markets such as Sweden (3pp). (Page 156).
• Pay TV accounted for 61% of TV households across all comparator countries in 2009, a rise of two percentage points on 2008. For the first time, the majority of households in the UK took a pay TV package (51% versus 49%). (Page 160).
• The TV industry globally is taking advantage of a broad range of technologies to offer consumers increasing convenience, quality and control over their viewing. Our consumer research found that HD-ready TV sets were most widely adopted in the UK (59% of respondents), slightly ahead of the US (57%). (Page 120).
• The UK was the second biggest market for pay-DVR homes at the end of 2009 with 7.8 million devices, up by 40% on 2008. The US had the highest number, 34.7 million DVR subscription homes at the end of 2009, up by more than a quarter (26%) year on year. The UK also has a sizeable free-to-air DVR market, led by Freeview and Freesat (around four million such devices had been sold by the end of 2009).
(Page 144).
• An average viewer among the 17 comparator countries consumed 207 minutes of TV each day in 2009. US viewers watched more TV than in any other country (280 minutes per person per day, up by 1.1% year-on-year). They were followed by viewers in Poland at 240 minutes (up 3.4% year-on-year) and those in Italy (238 minutes, up by 1.7%). People in the UK watched an average of 225 minutes, a figure unchanged from 2008. (Page 163).
• Of the European countries, the highest proportion of Entertainment
programmes was broadcast in France (23%) with the lowest proportion in the Netherlands (8%). In most countries News accounted for between 10% and 20% of programmes with the exception of Spain at 22% and at the other end of the scale, Poland at 6%. (Page 153).
• Local/regional TV services (which are often subsidised) are available in all our comparator countries. Italy had the greatest number of dedicated local/regional channels (631), compared to 9 in the UK. In UK, Germany, the Netherlands, Sweden, the USA, Canada and Australia, commercial broadcasters deliver local/regional content within a national service through ‘opt-outs’ or network-affiliate arrangements.
(Page 169).
Key points: radio and audio
• Global radio revenue totalled £27.6bn in 2009, down £2.7bn (9%) since 2008.
The figure was also down by 5% in nominal terms in the four years since 2005.
Commercial radio revenue grew in a number of developing countries, particularly Brazil, India and China, but this was more than offset by decline in the US, the largest global commercial radio market. UK radio income was down 7.1% year on year. (Page 192).
• Of the £27.6bn revenue generated by radio in 2009, advertising revenue was down by 14% to £17.9bn, while public funding rose by 1.9%, and satellite radio subscriber revenue grew by 5.1%. As a result, advertising revenue accounted for around two-thirds (65%) of total radio income in 2009, down from almost three- quarters (72%) share in 2005. (Page 192).
• The UK radio industry was the fifth largest of all of the 17 comparator countries (behind the US, Germany, Japan and France). UK revenues stood at £1.2bn (£19 per head) in 2009, equivalent to a 4% share of the global total. (Page 193).
• Radio’s share of display advertising varies from country to country. It was highest in Canada and the US, accounting for 13% and 11% of total advertising spend respectively. In the UK, radio advertising spend took a 4% share. (Page 196).
• Digital radio take-up in the UK was the highest among the countries we
surveyed. Almost a third (31%) claimed to own and use a digital radio. Take-up was lower in Japan (3%) and the US (7%). With different interpretations of the term ‘digital radio’ across nations, this should be taken into account when interpreting these results. (Page 201).
• Ownership and use of personal media players (such as MP3/MP4 and iPods) was highest in Italy, with nearly two-thirds (64%) of people claiming to own and use such a device. Ownership in the UK was second-highest at 52%. (Page 201).
• Downloading or listening to audio content such as music tracks and podcasts was most popular in Italy, with 48% claiming to download or listen to music through websites. The figure was lowest in Germany (31%), and about average in the UK at 40%. (Page 188).
• Listening to radio stations online was most popular among people in France, at 41% and lowest in Japan, at 16%. The UK was also slightly lower than average, at 29%. (Page 188).
• Listening to FM radio through a mobile phone was most popular in Italy; almost a third (31%) of respondents there claimed to have listened to radio on their mobiles, compared to only 5% in Japan. The UK was in line with the average, at 18%. (Page 189).
• Listening to MP3 tracks via a mobile was also highest in Italy (33%), this time also matched by Germany (33%). This activity was least popular in Japan (17%) and the US (18%) compared to 26% in the UK. (Page 189).
Key points: internet and web-based content
• As a proportion of all ad spend, UK internet advertising has demonstrated the largest and steadiest growth of all our comparator countries since 2004. In 2009 the UK also had the largest spend per head on internet advertising; all
countries experienced treble digit growth over the period 2004 to 2009. (Page 214).
• The UK is one of the leading countries for fixed broadband take-up, with 70 connections per 100 households at the end of 2009. Only the Netherlands (85), Canada (80) and the US (71) had a higher number of connections per 100
households. The number of connections has grown rapidly in Brazil, Russia and China to reach 21, 29 and 26 per 100 households respectively. (Page 223).
• Apart from Sweden, the UK has the highest number of mobile broadband connections per 100 households in Europe, There are 16 connections per 100 households in the UK, compared to 29 for Sweden. Outside Europe, connections per 100 households were highest in the US (30) and Australia (27). (Page 224).
• Take-up of smartphones and mobile internet devices is growing rapidly. Italy leads Europe in levels of smartphone take-up among the countries we looked at (26 per 100 population). Spain (21 per 100 pop) and the UK (18 per 100 pop) have the next highest levels. Growth since 2009 was highest in the UK at 70%. (Page 211).
• More than a third of UK internet users (37%) claim to have accessed the
internet on their mobiles. This is a similar number to users in France (37%) and the US (36%). Of our survey countries only Japan had higher take-up (70%) – driven by early 3G roll out and historically high mobile internet levels there. (Page 248).
• Social networking continues to grow rapidly, driven by high take-up among the younger population in all comparator countries. The proportion of internet users using social networks is now 62% in the UK, 58% in France and 66% in Italy. Growth was highest in France (115%) and Italy (106%). (Page 238).
• The UK has the highest percentage of mobile owners who use their phone for social networking (24%) across our survey countries. Japan has the most compared to the total number using social networks on the internet. (Page 244).
• UK consumers buy most items and spend most money on web purchases. UK shoppers on average made 19 purchases online in the six months to November 2009 and spent an average of £1031. This was much higher than consumers in the next highest European country, Poland (14 purchases; £325). (Page 218).
• Mobile advertising spend per capita in Japan outstrips its nearest rival, the UK, by a ratio of almost 5 to 1 – but the UK is growing rapidly. Japan spends £5.57 per head, in the UK the figure is £1.14. High 3G network take-up in Japan has made mobile a more attractive proposition to advertisers. (Page 220).
• Internet access via desktop computers is lowest in the UK. The UK had the lowest reported level of internet access using desktops, with just 58% of web users using a desktop to get online. The contrast is greatest among young people: 83% of 18-24s use a laptop to access the internet, but just 40% use a desktop. (Page 231).
Key points: telecoms
• Telecoms service revenues declined in seven comparator countries during 2009. The greatest fall was in Ireland (down 9.6%), while UK revenues fell 3.2%.
Revenues in Australia increased 7.4% during the year, and there were also increases in the BRIC countries, although at slower rates than in previous years. (Page 257).
• Global telecoms connectivity continued its advance in 2009. There were around 500 million new mobile connections in 2009, bringing the total to 4.5 billion, or six for every ten people in the world. (Page 255).
• UK households have comparatively high levels of connectivity, with among the highest number of fixed-lines per 100 people (54), fixed broadband connections per 100 people (29) and mobile connections per 100 people (129) at the end of 2009.
Germany had the highest fixed-line take-up (58 per 100 people), Italy the highest mobile take-up (152 per 100 people), and the Netherlands the highest fixed broadband take-up (37 per 100 people). (Page 317).
• Despite stagnating or falling revenues, mobile connections and use generally continued to grow in 2009, although mobile call volumes actually declined in France and Spain (they increased by 7% in the UK). (Page 302).
• There are wide variations in the take-up and availability of super-fast fibre- based broadband services. At the end of 2009 34% of households in Japan had a super-fast connection, compared to 0.2% in the UK. However, around the world there are large scale super-fast network deployments; by 2015, 66% of households in the UK are set to have access to next-generation broadband, representing greater availability than in most comparator countries. (Page 261).
• Voice over IP (VoIP) has seen large growth in many countries over the past few years, and by the end of 2009 there were 26 VoIP subscriptions per 100 population in France, where people use VoIP in place of a standard fixed line. Take-up of specific VoIP subscriptions was much lower in the UK (5 per 100 people), however, 17% of people claimed that a PC was to make voice calls in their home. (Page 273).
• The average cost of a broadband connection in the UK in 2009 (£15.42) was the second lowest among our comparator countries after Poland (£11.02). Cost per connection was highest in Australia, Spain and the Netherlands. (Page 346).
• Among six countries surveyed, the US and Italy had the highest proportion of mobile-only homes (29%) in October 2010. In the UK 13% of homes used mobiles as their sole form of telephony. (Page 330).
• Mobile messaging use continued to grow in most countries, although there were large differences in volumes of use. In Australia an average of 254 SMS and MMS messages were sent per person per month in 2009, while in Japan SMS is hardly used. Among the European countries for which data was available Ireland had the highest use (218 messages/person/month), followed by the UK (140). (Page 344).
• The UK was the only one of our comparator countries where fixed broadband revenues fell in 2009 (down 0.1%). Fixed-voice revenues fell in all countries except Brazil during 2009 and mobile revenues fell in some countries, with the falls greatest in the UK and Spain (both down 3.2%) and Ireland (down 11.9%). (Page 260).
Key comparator metrics: Summary table
UK FRA GER ITA USA CAN JPN AUS ESP NED SWE IRL POL BRA RUS IND CHN
TV and audio-visual
TV industry revenue (£bn) 10.5 10 11.2 7.9 81.5 3.5 24.9 3.6 4 2.3 1.4 0.9 2.1 8 2.8 4 8.7
Change in revenues (%,YOY) 0.2 2.4 -0.4 -2.9 -1 -0.2 -4.6 0.1 -9.4 -0.8 -3 -2.1 5.7 12 -12.2 14.1 7.6
Revenue per capita (£) 169 160 137 135 265 104 196 168 86 136 150 190 53 40 20 3 7
Largest TV platf orm DTT DTT ACab DTT DCab DCab ACab ATT DTT ACab ACab DSat DSat ATT ATT ACab ATT
Largest TV platf orm (% of homes) 41% 32% 40% 36% 38% 38% 27% 39% 62% 43% 45% 46% 49% 55% 44% 61% 40%
TV viewing per head (mins/day) 225 205 212 238 280 217 n/a 183 226 184 165 185 240 227 228 138 158
Digital TV take-up (%) 91 81 48 71 83 69 69 61 91 57 55 66 57 38 26 23 25
Pay TV take-up (%) 51 56 65 25 90 92 58 31 28 99 97 76 84 14 49 78 47
Digital switchover date 2012 2011 2008 2012 2009 2011 2011 2013 2010 2006 2007 2012 2013 2016 2015 2013 2015
Radio and audio
Radio Industry revenue (£bn) 1.2 1.3 3.0 1.1 10.7 0.9 2.6 0.5 0.5 0.4 0.3 0.2 0.1 0.3 0.2 0.1 0.8
Change in revenue (%, YOY) -7.1 -4.3 +1.9 -5.1 -15.7 -6.6 -3.9 -5.7 -17.5 -4.8 -1.7 -13.3 -22.9 +12.3 -35.7 +18.2 +7.2
Revenues per capita (£) 19 20 37 20 35 27 20 22 4 24 32 42 3 1.6 1.3 0.1 0.6
% income f rom public f unding 64 63 80 57 0.5% 16 62 n/a n/a 41 84 40 14 n/a n/a n/a n/a
Listening (hours /head/week) 22.1 20.9 21.7 21.0 18.5 18.3 12.6 n/a 12.6 24 19 31 33 n/a 39 n/a n/a
Public radio share (%) 55 22 58 19 5 13 8 n/a 6 32 65 33 25 n/a 24 n/a n/a
Internet and web
People online (m) 39.1 44.9 44.9 25.7 195 n/a 59.5 14.6 25.0 n/a n/a n/a n/a 39.3 n/a n/a n/a
Fixed BB conn. per 100 HH 70 69 62 49 71 80 64 66 56 85 66 63 40 21 29 4 26
Mobile BB conns. per 100 HH 16 7 3 16 30 20 19 27 11 7 29 13 9 n/a n/a n/a n/a
Mobile-only broadband HH (%) 6 1 11 13 6 n/a 6 n/a n/a n/a n/a n/a n/a n/a n/a n/a n/a
Internet access via a mobile (%) 37 37 27 31 36 n/a 70 n/a n/a n/a n/a n/a n/a n/a n/a n/a n/a
Telecommunications
Telecoms service revenues (£bn) 27.4 32.6 37.2 25.6 183.8 18.1 73.0 13.3 21.4 8.7 3.9 2.4 5.9 30.0 16.4 10.3 60.8
Telecoms revenues per capita (£) 442 506 452 440 599 540 574 626 462 522 427 529 155 151 117 9 46
Fixed lines per 100 population 53.9 37.0 57.5 37.3 46.0 55.6 39.1 48.2 42.7 36.5 56.8 42.5 25.7 20.8 32.5 3.2 23.7
Monthly outbound f ixed-line
minutes per capita 179 141 161 117 167 174 57 213 122 114 202 150 34 91 0 0 10
Mobile connections per 100
population 129.1 95.1 131.5 151.7 93.0 69.9 87.1 119.2 117.4 124.9 133.1 115.0 117.3 87.0 148.8 45.1 56.3
Monthly outbound mobile minutes
per capita 159 131 92 163 618 312 91 254 128 199 182 185 107 54 165 103 248
Fixed broadband connections per
100 population 29.3 30.3 30.3 21.2 27.3 30.8 25.0 25.0 20.8 37.0 32.5 21.2 13.6 5.6 10.6 0.7 7.8
The International Communications Market 2010
1
1 The UK in context
Contents
1.1 The global communications industry in context 17
1.1.1 Introduction to Section 1 17
1.1.2 Putting the global communications industry in context 17
1.1.3 Communications sector revenues 18
1.1.4 The recession and the communications sector 25
1.2 The UK consumer in context 33
1.2.1 Introduction 33
1.2.2 Take-up of services and bundles 33
1.2.3 Use of devices and services 36
1.2.4 Attitudes towards devices and activities 39
1.3 Regulation in context 41
1.3.1 Introduction 41
1.3.2 Regulatory authorities worldwide 41
1.3.3 Implementing the EU regulatory framework for electronic communications 45 1.3.4 Monitoring implementation of the EU Audiovisual Media Services
Directive (AVMS) 47
1.3.5 Promoting and protecting competition 48
1.3.6 Empowering and protecting consumers 53
1.3.7 International spectrum policy 56
1.4 Globalising communications markets 61
1.1 The global communications industry in context
1.1.1 Introduction
In the first section of this report we provide a broad overview which places the UK communications sector in a global context.
• The global communications industry in context: (Section 1.1): We compare the size of the UK communications sector to that of other countries and discuss the impact of the recession on the sector.
• Consumers in context (Section 1.2): We present findings from our consumer research on attitudes, use and take-up of communications services in the UK and five comparator countries.
• Regulation in context (Section 1.3): We highlight recent international developments in communications regulation and their impact on citizens and consumers.
• Globalising communications markets (Section 1.4): Our case studies illustrate the increasing internationalisation of communications markets.
1.1.2 Putting the global communications industry in context
In this section we discuss the UK communications sector in the global context, comparing the size and nature of the sector to that of other countries. We also discuss what impact the global recession may have had on communications sector stakeholders.
Given the complexity and scale of the ‘communications industries’ there are many potential definitions of the ‘communications sector’. These could, for example, include consumer electronics, network equipment, music, the film industry, online, software, games, newspapers magazine and books, in addition to telecoms and broadcasting revenues.
Given Ofcom’s core duties, we focus primarily on the telecoms, television and radio industries. However, we also discuss related sectors, where this helps to provide a wider context.
Key points
• Global communications sector revenues were largely flat in the year to 2009, growing just 0.3% to £1,113bn. Of these revenues, subscriptions (from consumers and businesses) accounted for 88% in 2009 (87% in 2008).
• The US, Japan and China had the world’s largest communications sector revenues at £276bn, £100bn and £70bn respectively, compared to £39bn in the UK. Revenue per head is highest in the US (£899), Australia (£808) and Japan (£790). This
compares with the UK at £630.
• Global advertising expenditure fell by 13% to £254bn in the year to 2009, compared to a 12% fall in the UK. TV advertising spend remained the largest single component (38%), but online was the only growth area, rising by 1% over the same period to
£37bn, 15% of the total.
• Our consumer communications survey found that respondents were less likely to have reduced expenditure on communications than on other goods and services, in particular eating/going out and holidays. UK consumer behaviour was in line with that of other countries. In general consumers in Germany were less likely to have
reduced expenditure on a range of goods and services than in the other countries.
• Among subscription services, our survey found that spend on mobile was hit hardest;
24% of respondents in the UK with mobile service said that they had reduced spend in the previous 12 months, but fewer in Germany (19%) and the US (17%). This compared with fixed broadband, where 8% in the UK and Germany said they had reduced spend, compared to 4% in Italy.
1.1.3 Communications sector revenues
The communications sector generated £1,113bn in revenues in 2009
The communications sector is a major contributor to the global economy, with telecoms service television and radio revenues growing by 0.3% to £1,113bn in 2009, far slower than the 2005-2009 average of almost 4% per annum.
Telecoms services accounted for almost 80% of global communications sector revenues, growing by 0.9% in 2009 to £878bn. This included fixed voice, mobile voice and data, and internet access.
Despite growing by an average of 4% per year between 2005 and 2009, TV revenues fell 1% in 2009 to £208bn, largely driven by a decline in advertising revenues during the economic downturn.
Radio was the smallest of the three sectors, reporting revenues of £28bn for 2009.
Revenues fell by 9% in 2009, as cyclical pressures combined with structural changes (shifts towards online) in advertising markets to contract the overall size of the sector. Radio is the only sector where total revenues fell between 2005 and 2009. When inflation is taken into account, the decline in radio advertising spend is even greater in real terms.
Further detail on sector revenues is provided in the relevant chapters in this report.
Figure 1.1 Global communications revenues
Source: Ofcom analysis based on data taken from PricewaterhouseCoopers Global Entertainment and Media Outlook 2010-2014 @ data / Ofcom for US and UK TV revenues and all telecoms revenues.
Interpretation and manipulation of data are solely Ofcom's responsibility. Ofcom has used an exchange rate of $1.5643 to the GBP, representing the IMF average for 2009.
Note: Net TV advertising revenues for Russia have been calculated by discounting 15% of TV advertising spending to remove agency fees and production costs.
Subscription revenues comprise 88% of all service revenues
Figure 1.2 below breaks down the three main sources of revenue from communications services: subscriptions revenues (i.e. direct payment for services by consumers and businesses), advertising revenues, and licence fees.
In some countries governments and local authorities subsidise communications services directly or indirectly. Given the complexity in measuring and defining subsidies, we have generally not attempted to quantify them (except for licence fees). Virtually all telecoms revenues are drawn from subscriptions, although some ISPs are attempting to increase advertising revenue, and some telecoms services receive public funding.
Overall, subscription revenues comprise the largest source of revenue for the
communications sector, accounting for £982bn in 2009 – 88% of the total. This is up two percentage points since 2005, a function both of the relative growth of the telecoms sector, and the decline in advertising revenue as a proportion of television revenue.
£749bn £791bn £838bn £870bn £878bn
£176bn £189bn
£204bn £210bn £208bn
£29bn
£30bn
£31bn £30bn £28bn
£954bn
£1010bn
£1074bn £1110bn £1113bn
0 200 400 600 800 1000 1200
2005 2006 2007 2008 2009
Radio
Television
Telecoms 4.1% 0.9%
4.3% -1.0%
-1.3% -9.0%
3.9% 0.3%
05-09 08-09 Annual Growth
Figure 1.2 Source of global revenues for telecoms, radio and TV services
Source: Ofcom analysis based on data taken from PricewaterhouseCoopers Global Entertainment and Media Outlook 2010-2014 @ data / Ofcom for US and UK TV revenues and all telecoms revenues.
Interpretation and manipulation of data are solely Ofcom's responsibility. Ofcom has used an exchange rate of $1.5643 to the GBP, representing the IMF average for 2009.
Note: Net TV advertising revenues for Russia have been calculated by discounting 15% of TV advertising spending to remove agency fees and production costs. All telecoms revenues have been allocated as subscription revenues.
Total communications revenue and revenue per head are highest in the US
Communications markets vary between individual countries, reflecting differences in size, disposable income and service take-up, in addition to policy decisions surrounding the imposition of licences or the payment of subsidies. Of the 17 countries we include in this report, the US had the largest communications sector on both an absolute (£276bn) (Figure 1.3) and a per-capita basis (£899) (Figure 1.4), while UK revenues, at £39bn, were the third largest in Europe, behind Germany (£52bn) and France (£44bn).
£821bn £873bn £931bn £968bn £982bn
£107bn £112bn £116bn £116bn £104bn
£25bn £25bn £26bn £26bn £27bn
0%
20%
40%
60%
80%
100%
2005 2006 2007 2008 2009
Public licence fee
Advertising
Subscription
£954bn £1010bn
3.1%
-9.9%
1.4%
£1113bn
£1110bn
£1074bn
2.2%
-0.7%
4.6 % 05-09 08-09 Annual Growth
Figure 1.3 Communications sector revenues in 2009
Source: Ofcom analysis based on Ofcom / IDATE data for telecommunications/TV and Ofcom
analysis based on data taken from PricewaterhouseCoopers Global Entertainment and Media Outlook 2010-2014 @ Ofcom's responsibility. Ofcom has used an exchange rate of $1.5643 to the GBP, representing the IMF average for 2009.
Notes: Telecoms revenue excludes revenue from narrowband internet and corporate data services and broadband revenues for BRA, RUS, IND and CHN.
Among our 17 comparator countries, China was the third largest communications market, with £70bn service revenues in 2009, although per-capita revenues at £53 are nearly twelve times smaller than those in the UK (£630). Revenue per head is higher in the US, Australia and Japan than in the European countries, primarily due to higher spend on telecoms services, although TV revenues were 36% higher in the US than in any other country.
Among the European countries, Ireland has the highest revenue per head, followed by France and the UK.
61 73
184
9 25
81
1 3
11
70
100
276
0 50 100 150 200 250 300
CHN JPN USA
10 16
30 6
2 4
9
21 13
18 26
37 33 27
4 3
8 2
1 1
2
4 4
3
8
11 10 11
1
1
3 1
1
14 19
38 8
3 6
11
26 17
22
35
52 44
39
0 10 20 30 40 50 60
IND RUS BRA POL IRL SWE NED ESP AUS CAN ITA GER FRA UK
Telecoms Television Radio
Revenue £bn
Figure 1.4 Communications sector revenues per head in 2009
Source: Ofcom analysis based on Ofcom / IDATE data for telecommunications/TV and Ofcom
analysis based on data taken from PricewaterhouseCoopers Global Entertainment and Media Outlook 2010-2014 @ Ofcom's responsibility. Ofcom has used an exchange rate of $1.5643 to the GBP, representing the IMF average for 2009.
Notes: Telecoms revenue excludes revenue from narrowband internet and corporate data services and broadband revenues for BRA, RUS, IND and CHN
Global advertising expenditure fell substantially in 2009 - although online continues to grow
While accounting for a minority of total communications sector revenues, advertising
remains a key source of revenue for radio and television services. Growth in advertising has historically been linked to growth in GDP, reflecting the interplay between advertising, business and consumer confidence, and consumer expenditure. Total global advertising revenue declined by 13% during 2009 due to the economic downturn.
46 9
117 151 155
529 427
522 462
626 574 540
599 440
452 506 442
7 3
20 40
53
190 150
136 86
168 196 104
265 135
137 160 169
1 0
1 2
3
42 32
24 4
22 20 27
35 20
37 20 19
53 13
138 193
211
761 609
682 551
816 790 671
899 595
626 687 630
0 200 400 600 800 1000
CHN IND RUS BRA POL IRL SWE NED ESP AUS JPN CAN USA ITA GER FRA UK
Telecoms Television Radio
Revenue /head (£)
However, Figure 1.5 also shows that structural changes in advertising have led to a
considerable redistribution of advertising spend. In particular, internet advertising continued to grow, and accounted for just under 15% of total advertising expenditure in 2009,
compared to just over 4% in 2004. By contrast, press advertising has been hit particularly hard, with spend on newspaper and magazine advertising experiencing the greatest
proportional declines over the period, collectively accounting for a third of total expenditure in 2009 compared to 44% in 2004.
Figure 1.5 Global advertising expenditure, by source
Source: Warc dat
Figure 1.6 illustrates this point further by detailing the wide variation in the performance of different types of advertising between 2004 and 2009. Between 2004 and 2008, the total advertising market grew by an average of 5.9% a year. In 2009 this trend was reversed, with revenue falling by 12.8%, reflecting the global economic downturn. Radio suffered more than TV, with expenditure falling 14.8%. However, the largest decline over the one-year period comes from newspapers and magazines.
Figure 1.6 Global advertising expenditure growth
Source: Warc dat
There are significant differences in the mix and size of advertising among our comparator countries (Figure 1.7). At £85.3bn in 2009, the US was the largest advertising market, 6.5 times the size of the UK market (£13.1bn in 2009). Germany was the largest advertising market among our comparator countries in Europe (£15.4bn in 2009).
73 75 76 79 75 59
29 31 32 33 32
25
85 89 94 102 106
97
20 21 21 22 22
18
13 15 16 17 18
10 14 22 16
31 36
231 247 263 37
286 291
254
0 50 100 150 200 250 300
2004 2005 2006 2007 2008 2009
Internet Outdoor Cinema Radio Television Magazines Newspapers
£bn
Total
advertising Newspapers Magazines Television Radio Cinema Outdoor Internet
2004- 2008 CAGR
+5.9% +0.6% +2.3% +5.8% +1.7% +7.2% +8.6% +38.7%
2008- 2009 annual growth
-12.8% -20.5% -21.6% -9.0% -14.8% -6.4% -13.3% +1.1%
2004- 2009 CAGR
+1.9% -4.0% -3.0% +2.7% -1.8% +4.4% +3.8% +30.2%
Figure 1.7 2009 Advertising expenditure analysis
Source: Warc dat
Note: Excludes expenditure on cinema advertising in CAN, JPN and CHN
The internet accounted for a larger proportion of advertising spend (27%) in the UK than in any other comparator country. This is in line with higher spending on online purchases in the UK than in other countries (See section 5). TV advertising remains the single largest source of revenue in the majority of the 17 countries, including the UK, and accounted for over half of total advertising spend in Poland, Brazil and Russia in 2009. In Ireland and India, where paid-for newspaper circulation increased between 2000 and 2008 by 45%1
The fall in UK advertising expenditure of 12% between 2008 and 2009 was greater than that in Germany (down 9%) but in line with France (down 12%). Total US advertising spend fell
, newspapers accounted for more than 40% of advertising spend in 2009.
1 Source: OECD, 2010, The evolution of news and the internet. Available from
23%
31% 35%
45%
10% 10% 8%
41%
31%
7%
15% 9%
2%
10% 7% 8%
4%
2%
43%
21% 22% 25%
52% 64%
54%
42%
40%
9%
6% 3%
10% 7%
4%
4%
3%
8%
5%
4% 5%
9%
6% 3%
13%
7%
7%
12%
22% 25%
8% 13% 12% 12%
3%
11%
0%
10%
20%
30%
40%
50%
60%
70%
80%
90%
100%
ESP NED SWE IRL POL BRA RUS IND CHN
Internet Outdoor Cinema Radio TV Magazines Newspapers
25% 21%
36%
18% 19%
29%
17%
30%
9% 15%
14%
12% 12%
8%
7%
8%
28% 30%
23%
52%
37% 31%
43%
32%
4%
7%
4%
5%
11% 13%
3%
6% 9%
11% 5%
2%
4% 4%
15% 4%
27%
16% 18% 10%
17% 16% 15% 17%
0%
10%
20%
30%
40%
50%
60%
70%
80%
90%
100%
UK FRA GER ITA USA CAN JPN AUS
Proportion of total advertising expenditure
4.9 3.3 1.8 1.1 2.0 5.0 3.9 2.6 11.8
Total £bn 13.1 10.3 15.4 7.4 85.3 6.5 25.6 6.0
16%. Despite the global economic downturn, Brazil, India and China reported growth in advertising spend of 7%, 17% and 11% respectively. In Russia it fell by 25%.
For further details on advertising in each sector, please see the relevant section of this report.
1.1.4 The recession and the communications sector
We published our last full International Communications Market Report two years ago; in late 2008, against the backdrop of Lehman Brothers’ insolvency in September that year, and concerns about other banks. Since then, the size and nature of the downturn has affected all sectors of the economy, including communications, as consumer and business confidence has been eroded, unemployment has risen, and governments and central banks around the world have used monetary and fiscal stimulus packages to mitigate the effects of the
recession.
The ability of firms to raise and maintain debt was a key focus during the initial part of the recession, characterised as the ‘credit crunch’. This spread from the financial sector to other parts of the economy, affecting firms’ capital expenditure decisions as well as consumer confidence and consumer spending. As many countries return to economic growth, recovery measures are also affecting the communications sector around the world, in particular the level of public funding to the sector.
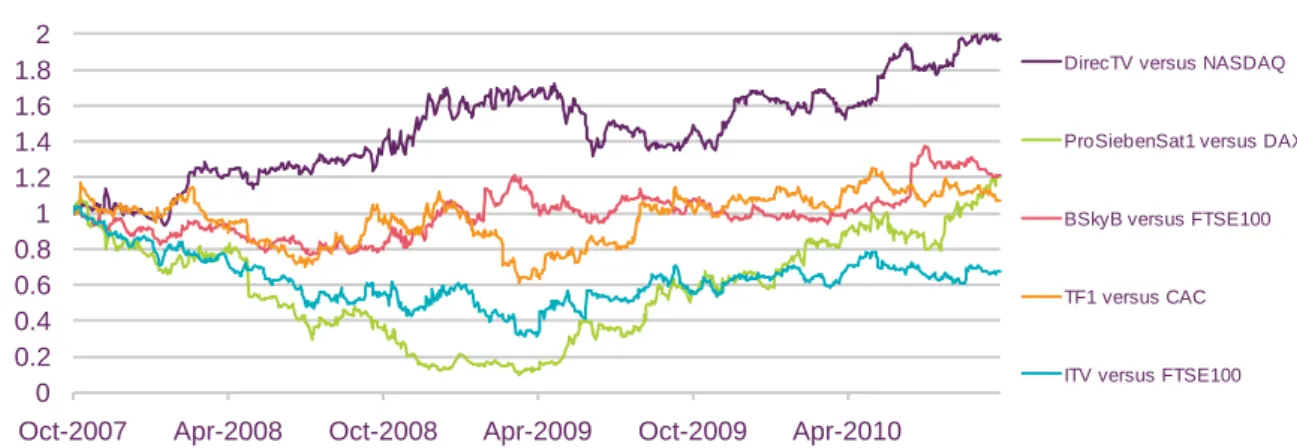
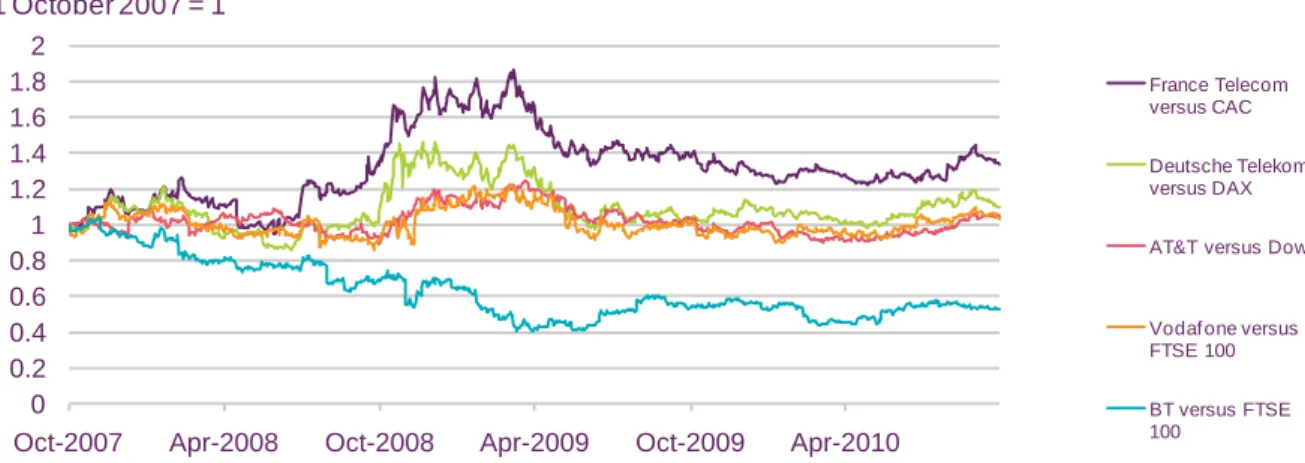
The impact of the economic downturn on publicly-quoted companies
Many of the world’s largest communications companies are publicly quoted. Their share prices are subject to short-term volatility at times of uncertainty, and to longer-term
pressures arising from concerns about lower long-term economic growth and hence lower revenue and profitability. However, the link between communications service revenues and trends in the wider economy is complex, reflecting factors such as the price sensitivity of consumers, the level of competition, the regulatory environment, the extent of providers’
pension liabilities, and the confidence of investors in management decisions.
In response to these challenges, a common response for many companies is to reduce costs, either internally or via mergers. An example is the merger of T-Mobile and Orange’s UK operations into Everything Everywhere, which was announced in September 2009 and officially launched in July 2010. Many communications firms have also reviewed their product ranges, introducing lower price entry points, in an attempt to retain and attract subscribers seeking to reduce spend. Examples of this include the range of SIM-only mobile offerings launched in the UK throughout 2009, and a general movement towards
incentivising consumers to move to longer contracts, with 24-month terms now most common in the UK.
Between late 2008 and early 2009, telecoms shares outperformed the wider market, partly reflecting falls in other sectors, in particular financial stocks, in the light of the bank
recapitalisations. Figure 1.8 shows that since 1 October 2007 (before the start of the credit crunch and economic downturn), large telecoms operators on several of our key comparator markets have either outperformed, or performed in line with, the wider market, (although it should be noted that the constituents of the indices vary between countries). This may reflect a relative confidence in the ability of individual telecoms companies to generate future
revenues, or may also reflect a wider defensive mindset in which investors switch from higher-risk stocks to lower-risk sectors.