Consumer advice trends
Consumer statistics from the
Citizens Advice service in England and Wales
Quarter 2 2016/17
Contents
Introduction
A note about sources.
Focus
Problems with parcel delivery Key statistics Q2 2016-17
Consumer Service detail Q2 2016-17 Consumer Service cases part one Consumer Service cases part two
Issues at level 2
Increases in issues at part two Decreases in issues at part two Top 5 second tier issues Top 5 second tier Increases Top 5 second tier decreases Consumer Service cases part three
Issues at level 3 (>500 issues)
Decreases in issues at part three (>500 issues)
Top ten increases in issues Top five decreases
Transaction types Trading practices
Payment & Purchase Methods Energy cases
Q2 2016-17 Online services
Top ten consumer content page views Q2 2016-17 Comments
Consumer debt/money pages Local Citizens Advice
Consumer Issues (Inc: financial products, travel and utilities) Other consumer related Issues
Appendix one: Client profiles
Appendix 2: Client Satisfaction & outcomes
Appendix 3: Consumer Service Advice Issue statistics Appendix 4: Our Services
Introduction
Citizens Advice, the statutory consumer champion, has an unparalleled wealth of
information about the problems that consumers have. This publication reports on advice to the public on consumer issues by Citizens Advice in England and Wales whether they contacted local Citizens Advice, our Consumer Service or sought advice from our website.
A note about sources.
The data used is based on clients who have provided a post code which identifies their country as England or Wales. It excludes clients living in Scotland and anonymous (unknown) clients.
We also include statistics on the whole of the Citizens Advice service in England and Wales in our quarterly publication Advice Trends (please note: consumer figures in that report include cases from Consumer Service clients living in Scotland and anonymous citizens and are therefore different from this publication.)
Percentage increases and decreases are calculated comparing this quarter with the same quarter the previous year.
The report covers four main areas:
1. A summary of the key statistics for Q2 2016-17 2. Focus on a story in the data
3. Detailed stats from the Consumer Service, online and local services 4. Appendices covering client profiles, client satisfaction and stats tables.
Focus
Problems with parcel delivery
In 2015/16 UK consumers experienced 4.8 million delivery problems, and spent 11.8 million hours trying to resolve them. Once compensation consumers received for these 1 problems has been taken into account, consumers were still left £148 million out of pocket.
When consumers are unsure how to resolve a problem or pursue a complaint themselves they often turn to the Citizens Advice Consumer Helpline for advice. Though this helpline we help people with an average of 218 queries related to parcel delivery issues every month. 2
The run up to Christmas is the busiest period for the UK parcels network as consumers order goods online and post parcels to family and friends across the country. It is estimated that 260 million parcels were handled by parcel companies on behalf of e-retailers in November and December 2015. Royal Mail handled 130 million. 3
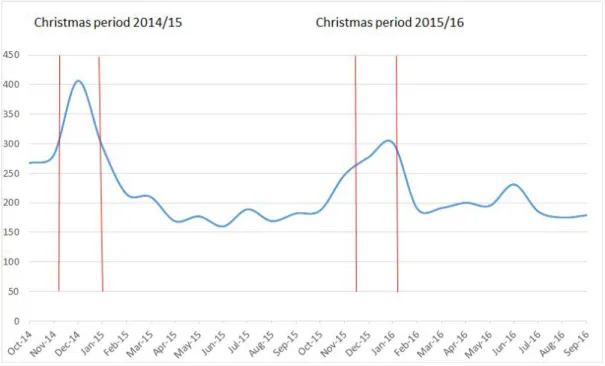
We see this peak in activity reflected in our own data. The number of consumers who contact us about issues with their parcel delivery increases significantly over the
Christmas period. Between October 2015 and December 2015 we saw a 32% increase in the number of parcel issues reported to us. This includes Black Friday and Cyber Monday, 4 the lead up to Christmas and Boxing Day as well as January sales when people return gifts and take advantage of more online discounts.
The graph below shows the total number of parcel issues recorded by the Consumer Service Helpline between the 1st October 2014 and 1st October 2016.
1https://www.citizensadvice.org.uk/Global/CitizensAdvice/Consumer%20publications/Final_ConsumerDetriment_OE.pdf
2This is based on searching the keyword ‘parcel’ in Post line contact notes, and the keyword ‘parcel’ in Consumer Service Helpline contact notes where the complaint type was either failure in delivery or collection, or all other complaint types excluding these, and the payment method was through distance sales.
3 http://edelivery.net/2016/05/parcel-deliveries-break-1-billion-barrier/
IMRG and Experian reported a record-breaking £1.1bn was spent online on Black Friday 2015
Figure 1: Consumer service and post line parcel issues between 1 October 2014 and 1 October 2016
The Citizens Advice website also sees a spike in traffic to its post advice pages during the Christmas period. For example, on 18 December 2015 alone our advice pages on what to do if your post or parcel has not been delivered received 1,449 hits - an increase of almost 60% compared to the same day in the previous month (915 hits).
Figure 2: Unique page views for online advice on undelivered post/parcels over Christmas period 2015/16
What are the most common problems?
A common theme running through the calls we receive about parcel delivery is confusion.
For example, our clients are often confused about the process for securing compensation when sending parcels that are lost or damaged. Some also find that parcels they paid extra to insure aren’t covered because the package contained glass, china or valuable documents.
Suzie sold a laptop to someone online and took care to ask about sending it using an insured service which she purchased in store through an agent. When the laptop arrived to the buyer the screen was smashed and Suzie was unable to obtain compensation.
The laptop was not covered in the detailed terms and conditions of the contract which she was not told about at the counter when deciding which insured service to purchase.
Others are caught out by unexpected fees, for example handling fees when receiving a parcel from outside the EU. They will not receive their items until these fees have been paid. For example:
Lucy wanted to know her rights in relation to high handling fees. She ordered a phone from China and was invoiced for customs charges plus a £20 administration fee. Lucy has ordered from outside the EU before, and wasn’t expecting such a high handling charge from the postal operator handling the delivery.
The frustration caused by the original problem can be compounded by trouble getting through to the parcel operator to try and resolve the issue. Those who do manage to contact the operator often aren’t satisfied with the response they receive.
Alan contacted us about a damaged parcel that had been misdelivered. He had spent time and money for call charges contacting both the parcel operator by phone and email as well as the retailer and had found the responses unsatisfactory and was still unclear about his rights to a refund.
It can also be difficult for consumers to establish who to claim compensation from - the retailer they bought the goods from or the company that delivered the parcel. The
Consumer Contract Regulations 2013 make it clearer that consumers should get in touch with an e-retailer directly about any issue up until a parcel is delivered to them.
However, consumers are often not aware of this, and can passed around between the e-retailer and the parcel company, with neither willing to accept responsibility for resolving the problem and compensating the consumer.
Key statistics Q2 2016-17
In Q2 2016-17 our direct services to the public in England and Wales advised clients on 5 455,000 consumer issues and our online service had nearly 4m content page views.
Consumer Service
● Our specialist Consumer Service dealt with 149,000 issues by phone, email or letter
Local Citizens Advice (consumer related)
● Our local Citizens Advice service dealt with 326,000 consumer related issues (including consumer debt, consumer housing and consumer legal issues) face to face, on the phone or by email.
Online services
● Our online service had nearly 2.3million consumer content page views, an decrease of38% compared to Q2 2016/17. We also had over 1.7 million debt and money page views, an increase of 36%.
5 Please note these statistics only relate to England and Wales and do include services in Scotland or anonymous clients (without a postcode). Data in this report is therefore different from our other Advice Trends report.
Consumer Service detail Q2 2016-17
Consumer Service cases part one
Problems by part 1 category Q2 2016/17
% of total problems
% change
House fittings and appliances 32,053 22% -5%
Transport 28,288 20% -2%
Personal goods and services 13,846 10% -12%
Other household requirements 12,896 9% -10%
Leisure 11,472 8% -10%
Professional and financial services 10381 7% -12%
Commercial goods and services 864 1% -3%
Broadcasting 84 0% 45%
Unknown 33,297 23% 18%
Total 143,181 -2%
Energy (consumers) 5,318 -14%
Mail (consumers) 206 39%
Grand total 148,705 -3%
Comments
● The number of Consumer Service cases where the issue was in scope and identified reduced by 7% to 109,884.
▲ Part one issues trends over the last 18 quarters
▲ Consumer part one issues percentage of total Q2 2016-17
Consumer Service cases part two
Issues at level 2
Top 10 part 2 consumer issues Q2 2016/17 % all change
Second hand cars 14,859 10% -3%
Home maintenance and improvements 12,387 9% -1%
Telecommunications 6,174 4% -8%
Furniture 6,117 4% -6%
Large domestic appliances 4,726 3% 0%
Other personal goods and services 4,533 3% 7%
Professional services 3,939 3% -7%
Car repairs and servicing 3,501 2% -1%
PCs accessories software and services 2,761 2% -21%
Insurance 3,020 2% -5%
The top ten second tier issues account for 43% of all issues and 56% of all known issues.
▲ Top five part two issues over the last 18 quarters
Increases in issues at part two
Top 5 part 2 increases Q2 2016/17 change
Other motoring costs 2,681 20%
Unknown 29,868 18%
Holidays 1,498 8%
Other personal goods and services 4,403 7%
New cars 1,343 4%
(>1,000 issues)
Decreases in issues at part two
Top 5 part 2 decreases Q2 2016-17 change
Toiletries perfumes beauty treatments and hairdressing 1,873 -36%
Audio-visual 1,746 -22%
Personal computers accessories software and services 2,827 -21%
Letting and property management services 1,303 -9%
Entertainment catering and accommodation 2,075 -9%
(>1,000 issues)
Comments on part two issues
Top 5 second tier issues
● Second hand cars remain the major issue at 10% of all issues. 76% of these issues related to cars purchased from independent dealers.
● Home maintenance and improvements accounts for 9% of all issues. The biggest categories in this area remain: General building work at 26%, central heating at 8%, roofing at 12%, fitted kitchens at 10% and plumbing at 7%.
● Telecommunications accounts for 4% of all issues. The majority of these cases relate to mobile phone service agreements at 32% and mobile phone hardware also at 42%. Landlines account for 20% of issues.
● Furniture is 4% of all issues. Upholstered furniture is 15% and Non-upholstered furniture is 32%, Beds & mattresses are 21%.
● Large domestic appliances account for 3% of all issues. Tumble dryers/washer dryers now account for 15% of these issues. Washing machines are 15 % and Fridges & Freezers are 19%.
Top 5 second tier Increases
● Other motoring costs are up 20%. This is mainly due to a 33% increase (to 1,826 issues) in car parking and clamping.
● Holidays are up 18%
● Other personal goods and services are up 7%
● New Cars issues are up 4%. Issues about new cars purchased from a franchise dealer issues are up 66% and purchased from independent dealer are up 31%
● Other motor vehicle purchases are up 2%.
Top 5 second tier decreases
● Toiletries, perfumes, beauty treatments and hairdressing cases have reduced 36% because of the drop of 32% in the number of cases about beauty treatments.
However, there are also decreases in most other third tier codes in this category.
● Audio-visual issues are down by 22%. TVs is the biggest category at 896 and is down 52%. There are drops across most categories.
● Personal computers accessories software and services are down 21%.
● Letting and property management services issues are down by 9%, mainly due to a drop of 14% in letting agents (to 747) and a 3% drop in landlords (to 391).
● Entertainment catering and accommodation casesare down 9%
Consumer Service cases part three
Issues at level 3
Top 10 third tier issues
Q2 2016-17 Change Last 12 months
Other 12,717 24% 48,781
Other general building work 3,253 24% 10,357
Purchased from franchise dealer 2,922 14% 10,700
Mobile phones (hardware) 2,570 6% 10,189
Independent garage 2,531 -9% 9,851
Mobile phones (service agreements) 1,997 -22% 8,888
Upholstered furniture 1,950 -5% 9,851
Car parking and clamping 1,826 33% 7,365
Womens clothing 1,686 -5% 5.907
Roofing 1,430 0% 6,017
Top 10 increases at third tier issues Q2 2016-17 Change
Tumble dryers 632 379%
Holiday/travel 534 57%
Car parking and clamping 1,826 33%
Other general building work 3,253 24%
Other 12,717 24%
Replacement doors 755 24%
Purchased from franchise dealer 2,922 14%
Purchased privately 1,248 9%
Fitted kitchens 1,261 7%
Fitted bathrooms 680 7%
(>500 issues)
Decreases in issues at part three
Top 5 decreases at third tier issues Q2 2016-17 Change
Beauty treatments 600 -36%
Spares and accessories 578 -35%
Central heating (inc installation and servicing) 971 -27%
Laptops notebooks and tablet PCs 1,199 -25%
Mens clothing 517 -22%
(>500 issues)
Comments on part three issues
Top ten increases in issues
1. Tumble dryers issuesare up 379%. 84% of issues were due to defective goods.
This is likely to be as a result of concerns in the news about the recall of potentially dangerous tumble dryers.
2. Holiday and travel are up 57%. 67% of issues are substandard services /defective goods.
3. Car parking issuesare up 33%. 51% of issues are due to substandard services.
4. Other general building work issues are up 24%. Substandard services account for 52% of issues, Defective goods 12% and cancellation 8%.
5. Other issuesare up 24%.
6. Replacement doors issuesare up 24%. Defective goods accounts for 44% of all issues. 29% are due to substandard services and 6 misleading claims / omissions.
7. Purchase from a franchise dealer are up 14%. Defective goods are 71% of issues.
8. Second hand cars purchased privately are up 9%. Defective goods are 62% of issues
9. Fitted Kitchens are up 7%. Substandard services are 48% of issues and defective goods 31%
10.Fitted bathrooms are up 7%. Substandard services are 56% of issues and defective goods 20%
Top five decreases
1. Beauty treatments issues have decreased by 36%. The main reasons are spread across 5 categories. Substandard services 29%, Defective goods 19%, Misleading claims/omissions 21%, Cancellation 6% and Business practices 8%.
2. Spares and accessories issues have decreased by 35%. Defective goods are 57% of issues and misleading claims/omissions 12%.
3. Central heating (inc installation and servicing) issues are down 27%.
Substandard services account for 47% of issues, Defective goods are 19%, Misleading claims or omissions are 10% and Cancellation is 5%.
4. Laptops notebooks and tablet PCs are down 25%. Defective goods are 61% and Substandard services account for 15% of issues.
5. Mens clothing is down 22%. Defective goods are 32%, Substandard services 17%, Misleading claims/omissions 18%, Cancellation 5% and Business practices 5%.
Transaction types
Consumer Service cases are not only coded by the type of goods and services the case is about, but also by type of trading practice, the purchase method and payment method.
Trading practices
The table below shows the main complaint types. Defective goods or substandard services account for x% of cases (where the complaint type is known).
Complaint Type Number Q2
2016-17 %
Defective goods 41,313 29%
Substandard services 28,460 20%
Misleading claims/omissions 11,872 8%
Business practices 5,452 4%
Type 1 Type 2 Number
Q2 2016-17 % of Type Defective
goods Defective goods 27,332 66%
Breach of contract 8,499 21%
Safety 3,679 9%
Sub standard services
Substandard services 19,594 69%
Customer service 7,183 25%
Misleading claims or omissions
Verbal misrepresentation/misdescription 3,301 29%
Advertising 2,968 26%
Failure to supply full information 2,365 20%
Incorrect/misleading pre-shopping advice 1,698 15%
Payment & Purchase Methods
Card payments make up 44% of all known purchase methods with cash accounting for 22% of known payments.
The remaining known payments are made up of: 6% direct debit, 4% cheque, 3% other credit (not HP), 2% banker’s draft, 3% HP, 3% Paypal and 12% other
12% of all cases are recorded as “Not Paid”. These related mainly to reports of scams and frauds where the client has not made payment but is seeking advice or reporting the issue.
The table below shows the top four purchase methods by the top 9 payment types for Quarter 2 2016/7. The graph on the following page shows the percentage splits.
Payment Type Trader
premises Internet Telephone Doorstep Invited
Debit card 11,983 7,880 3,242 886
Cash 11,521 693 899 3,011
Credit card 5,149 4,348 1,397 486
Direct debit 1,588 890 1,675 223
HP 2,436 75 70 44
Other credit (not HP) 2,109 278 94 248
Banker's draft 548 368 258 419
Cheque 632 110 339 1,537
Paypal 58 2,349 44 7
Sub Total 36,024 16,991 8,018 6,861
▲ Top 9 Payment methods as a percentage of all purchase methods
Energy cases Q2 2016-17
Top energy issues at first tier
Q2 2016-17
% All % Change
Billing errors 1,688 32% -23%
Information 1,201 23% -2%
Metering 674 13% -29%
Debt/Disconnections 506 10% 11%
Transfers 395 7% -15%
Distribution/Transportation 300 6% -9%
PPMs 77 1% -29%
Marketing 128 2% 36%
Smart Meters 79 1% 229%
Customer Service failure 16 0% -47%
Price Comparison Services 2 0% -50%
Unknown 254 5% -10%
Total 5,318 100% -14%
(All data is from England and Wales only)
Comments on Energy Issues
● Billing errors: have decreased by 23%.
● Information: The decrease of 2%. There are two issues that have changed; the largest category of How to change supplier is down 32% to 600 issues and Non domestic contract issues have increased by 116% to 201 issues.
● Metering: Issues are down 29%.
● Debt/Disconnections: These have increased by 11% to 500. While there have been some larger percentage increases and decreases over the last 18 quarters, the quarterly average has been relatively low at 579.
● Transfers: Issues are down 15%.
▲ Energy issues trends over the last 18 quarters
Exclusions
As previously noted, data from clients living in Scotland, Northern Ireland or anonymous clients has been excluded.
Online services
In Q2 2016-17 we had nearly 2.3 million views of consumer content pages on our website. This is a decrease of 38 % compared to Q2 2015-16 and is 15 % of all content page views on our website. The decrease is due to a reorganisation of our online site in line with changed consumer legislation from October 2015. Visitors can now access all consumer content and tools across fewer pages.
Due to the restructure, it is not possible to provide meaningful comparisons at a page level to previous years. Therefore we have only provide details of the top page views in Q2 2016-17.
Top ten consumer content page views Q2 2016-17
Type Page Title Views
Complaint Report to Trading Standards 153,841
Comp Claim compensation if your flight's delayed or cancelled 98,061 Post Check your post collection and delivery times 86,033
Faults Return faulty goods 58,442
Rights The Consumer Rights Act 2015 53,369
Parking Appealing a parking ticket 46,850
Cars Problem with a used car 46,024
Building Problem with building work, decorating or home improvements 39,573
Cars Buying a used car 39,482
Parking You’ve got a parking ticket on private land - what can you do? 38,540
Comments
The top ten consumer page views (660,15) are 29% of all consumer pages viewed.
The high number of views of the ‘return faulty goods’ and ‘problem with building work, decorating or home improvements’ pages is because consumers’ rights to redress for
faulty goods or sub-standard services were clarified by the Consumer Rights Act which came into force on 1 October 2015.
The pages on appealing a parking ticket and parking on private land being in the top 10 most viewed pages may reflect the impact of the Supreme Court judgment in Beavis v ParkingEye.
Claiming compensation for delayed or cancelled flights is in the top ten because consumers’ rights to compensation has been clarified in a number of UK and EU judgments over the last 18 months.
The prevalence of issues and complaints reporting in the UK on the second hand car market continues to be reflected in the number of page views, with two of the top 10 pages being related to the purchase of second hand cars.
Consumer debt/money pages
In Q2 2016-17 there were 1.7 million content views of all debt and money pages, an increase of 36%. The most viewed pages were:
Type Page Title Views
Solution Work out your budget 56,996
Insurance Vehicle insurance – making a claim if you’re in an accident 45,381
Solution Bankruptcy 44,371
Solution Debt relief orders 39,160
Solution How to sort out your debts 39,000
Solution Bankruptcy - what you need to know 36,061
Court Creditor takes you to court for debt 33,054
Solution Debt relief orders - what you need to know 32,503
Solution Help with debt 31,241
Solution How to deal with your creditors 29,382
Local Citizens Advice
Consumer Issues (Inc: financial products, travel and utilities)
Consumer Q2 2016-17 % change
All consumer related issues 148,119 -1%
Part 1 Top Part 2 Issues for each section Q2 2016-17 % change Consumer
goods and services
Other goods & services 7,097 -28%
Building repairs & improvements 4,217 0%
Second hand vehicles 3,303 -13%
Fraud and scams 1,809 -14%
Electrical appliances & repairs 1,379 -11%
Vehicle repairs/servicing 1,257 -5%
Furnishings & floor coverings 1,134 -25%
Financial products
& services
Financial capability 32,145 32%
Pensions Wise 18,545 4%
Personal Pensions 3,479 -16%
Bank/Building & P/O Accounts 3,253 -1%
Credit Reference Agencies 2,755 0%
Vehicle insurance 1,283 -9%
Mortgages & secured loans 1,281 -20%
Travel Parking charges public land/on-street 4,184 -%
Driving 3,116 5%
Parking on private land 1,878 94%
Utilities
Fuel (gas, electricity, oil, coal etc.) 20,070 13%
Water & sewerage 3,934 -26%
Mobile phones 1,225 -27%
Telephone landline 860 -20%
Internet & broadband 691 -33%
Comments on Consumer Issues
The numbers at part three for most consumer issues are quite small. The biggest changes are:
● Consumer goods and services. There are decreases across all part 2 codes.
Furnishing and floor coverings are the biggest drop of 25% (to 1,134).
Across all part 2 codes Faulty/dangerous/unsafe goods are down 9% (to 3,603).
● There was an increase in Complaints and Redress across all Consumer areas of 32% to 8,656.
● There are four issues at the part three level driving Fuel increases:
○ Selling and switching up 44% to 3,524
○ Price of tariff up 14% to 3,085
○ Warm home discounts up 11% to 2,509
○ Methods of payment up 7% to 1,931
However, as noted above the increase in Fuel issues is largely due to a relatively small number of members receiving grant from Energy Best Deal projects.
● Water and sewage: Overall issues are down 26%. Watersure & social tariffs issues have decreased 35% to 2,070. These peaked at over 3,000 issues in Q2 2015-16.
● The Parking and congestion codes have changed but comparing to old categories, there has been an 8% decrease to 4,184. Blue Badge issues are unchanged at just over 3,000. Parking on private land has increased 94% to 1,878.
● The increases in Financial products and services is mainly due to an increase of 32% in financial capability (to 32,145). This is due to the expansion integrated money advice services providing fin cap alongside debt advice. There have been several changes to Fin Cap codes: the top two part three Fin Cap codes that are unchanged and increased are:
● Getting the best deals: energy 43% 2,569
● Budgeting and managing money 13% 7,161
Consumer debt issues
There has been an overall reduction in debt issues over the last two years. This is in part linked to the reduction of funding from the Legal Services Commission for specialist debt work. However, Q2 2016/17 shows a relatively small decrease of 2%, possibly due to new second tier codes being added in April 2016 for mobile phone debts and telephone and broadband debts.
Third party collection (excl Bailiffs) are up 25%, Unpaid parking penalties and congestion charge issues are up 16%. Hire purchase arrears are up 14%
Consumer Debt Issues Q2 2016-17 Change
Credit, store & charge card debts 34,617 -2%
Unsecured personal loan debts 27,599 -7%
Water supply & sewerage debts 18,371 0%
Fuel debts 16,575 -7%
Bank & building society overdrafts 12,532 -10%
Mobile phone debt 10,027 -
Telephone & broadband debts 3,900 -
Catalogue & mail order debts 11,783 0%
Rent arrears to local authorities or ALMOs 10,814 -2%
Mortgage & secured loan arrears 6,882 -16%
Rent arrears - private landlords 6,999 0%
Unpaid parking penalties and congestion charges 5,477 16%
3rd party debt collection excl. bailiffs 4,747 25%
Payday loan debts 4,259 -4%
Hire purchase arrears 2,952 14%
Guarantor loan debts 585 -
Other ( Logbook, loan shark, pawnbrokers) 352 8%
Total consumer related debt issues 178,471 -2%
Please see Advice Trends Q2 2016-17 for all debt issues.
Other consumer related Issues
Other Q2
2016-17 % Change Housing - Private sector rented property 26,456 -9%
Housing - Owner occupier property 5,787 -11%
Legal - Solicitors/barristers 7,194 -8%
Private sector rented
Top ten Part 3 Private Rented sector
issues Q1 2016-17 %
Category % Change
Repairs/Maintenance 3,667 14% -2%
Rents and other charges 3,468 13% -6%
Tenancy deposit protection 3,364 13% -7%
Possession action (not arrears) 2,010 8% -6%
Problems with letting agencies 1,698 6% -5%
Security of tenure 1,458 6% -7%
Suitability of accommodation 1,011 4% -1%
Cost of deposits / rent in advance 894 3% -16%
Harassment by landlord / illegal eviction 789 3% -8%
Illegal eviction by landlord 492 2% -14%
Owner occupier
There is no significant category for owner occupier issues which are down 11%.
Solicitors/barristers
There are two main issues:
● Costs, which are down 12% to 1,564
● Complaints & redress, which are down 12% to 1,031
Appendix one: Client profiles
Gender Consumer % Local %
Female 50% 57%
Male 50% 43%
Total 100% 100%
Responded 99% 94%
Ethnic origin Cons % Bx %
Asian or Asian British 7% 6%
Black or Black British 3% 7%
Mixed ethnic background 1% 2%
Other ethnic background 3% 2%
White 87% 83%
Total 100% 100%
Responded 97% 88%
Black and minority ethnic (BAME) 12% 17%
Age Cons % Bx %
17 to 24 5% 7%
25 to 34 15% 20%
35 to 49 23% 32%
50 to 64 28% 26%
65+ 30% 15%
Total 100% 100%
Responded 99% 90%
Profile percentages are based on responded (exclude prefer not to say). Consumer profiles are from client research sample August to September 2016. Local service profiles are for consumer related issues only and for Q2 2016-17.
Appendix 2: Client Satisfaction & outcomes
Consumer service client follow up research: August to September 2016
Summary
● 82 % of clients were satisfied with the service & found it easy or very easy to use
● 48 % of clients reported that things had got better, 42% of these had a financial benefit
● £838 is the estimated average financial benefit for those clients
Satisfaction Consumer Energy Post
Total no. of respondents 1,791 651 82
Total no. ‘Satisfied’ or ‘Very Satisfied’ 939 547 65 % ‘Satisfied’ or ‘Very Satisfied’ 85% 84% 79%
As a result of the advice that Citizens Advice gave...
Total no. of respondents 1,859
Total no. problems ‘partly’, ‘mostly’ or ‘completely resolved’’ 1,070
% ‘Things have got better’* 60%
Estimated benefit Amount
Estimated mean benefit** £1,034
Estimated lower bound £522
Estimated upper bound £1,545
*weighted statistic
**based on data from respondents answering that ‘their problem was ‘partly’, ‘mostly’ or ‘completely resolved’and providing a financial estimate of how much this was worth to them; statistics unweighted Please note this is the consumer service research only and does not include local Citizens Advice services or online users.
Appendix 3: Consumer Service Advice Issue statistics
See separate Excel files/PDF for:
3.1 Consumer issue statistics for England and Wales 3.2 Energy statistics for England and Wales
Appendix 4: Our Services
Consumer Service
We provide a consumer helpline and email service across Great Britain in partnership with Citizens Advice Scotland. This includes a specialist Energy and Post service. For this report we have used data from this service where clients live in England or Wales. We record one main issue per enquiry for this service.
Local Citizens Advice
We have over 300 members who are independent charities delivering services from over 600 branches and over 2,000 regular community locations. Advice is provided in 16 core subject areas including consumer related issues. Services are provided face to face, by telephone, by email/webchat and post. As we provide an holistic service to clients, we can record multiple issues for each enquiry.
In Q2 2016-17 we advised clients on 1.47 million issues of which 0.38 million (26%) were consumer related and are included in this report.
Online services
We provide a public advice website covering 11 core areas. The site offers information, self help tools and navigation through problems. In Q2 2016-17 there were 2.3 million consumer content pages which was15% of all 15.7 million content page views.
The Citizens Advice public site also provides details of our to find local services and access the consumer helpline.https://www.citizensadvice.org.uk/
Appendix 5: All stats
As noted above the figures in this report are based on known client postcodes living in England and Wales and therefore excluded clients living in Scotland, Northern Ireland or with an unknown post code.
The summary of the full Q2 2016-17 figures for the whole service are
Issues All E&W % in this
report
General Consumer Issues 161,710 143,181 89%
Energy 7,693 5,318 69%
Post 326 206 63%
Total 169,729 148,705 88%
The Citizens Advice service provides free, independent, confidential and impartial advice to everyone on their rights and responsibilities. It values diversity, promotes equality and challenges discrimination.
The service aims:
● To provide the advice people need for the problems they face;
● To improve the policies and practices that affect people’s lives.
Citizens Advice 200 Aldersgate London EC1A 4JJ
www.citizensadvice.org.uk www.adviceguide.org.uk
Citizens Advice is an operating name of The National Association of Citizens Advice Bureau.
Registered charity number 279057