By testing the weights of different criteria in four scenarios, in the first stage of the decision support system, a range of degradation was found in the total coastal area. Riparian characteristics and channel change along the river from headwaters to mouth (Miller, 1990; cited in (US Federal Interagency Stream Restoration Task Force, 1998a) 8 Figure 3 illustrates the concept of river continuity.
1 General introduction
Although they were strong initial efforts as either multiple approaches or approaches based on GIS data, none of the approaches mentioned above meet the criteria explained in chapter 2.4.2 and illustrated in Table 1 and Table 2 to support ecological restoration efforts at different spatial scales, or as a GIS-based decision support system. Objective two: Development of the second phase of the GIS-based decision support system to find the coastal areas with the highest improvement potential in relation to their biophysical and ecological functions (as support for proposed coastal restoration efforts ) on a field scale ( 10^ m - 10* m).
2 Riparian zone management and restoration worldwide and in New Zealand - A literature review
Riparian zones - An overview
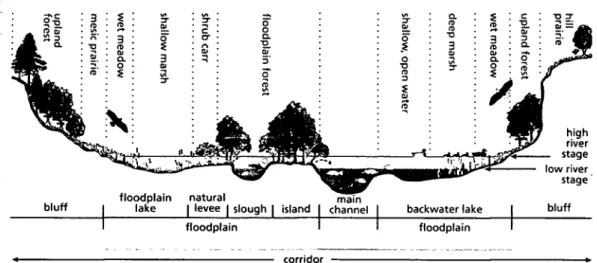
Additionally, riparian zones change their appearance along the longitudinal gradient of rivers (US Federal Interagency Stream Restoration Task Force, 1998). Riparian zone characteristics and channel change along the river from headwaters to mouth (Miller, 1990; cited in US Federal Interagency Stream Restoration Working Group, 1998).
Riparian zones - Functions
- Biophysical functions .1 Filter fimction
- Ecological functions
- Social functions (economic value, aesthetics and recreation)
Riparian zones are rich ecosystems in terms of biological diversity, unique biogeochemical processes and productivity (Boone Kaufftnan et al., 1997). Connectivity (Appendix A) is one of the most important ecological functions that riparian zones can provide for flora and fauna.

Ecological restoration of riparian zones
Ecological restoration of coastal areas must focus on geomorphic, hydrological and biotic processes and functions. Re-vegetation with site-specific native plants is just one aspect of ecological restoration of coastal areas.
River and riparian classification and management approaches worldwide and in New Zealand
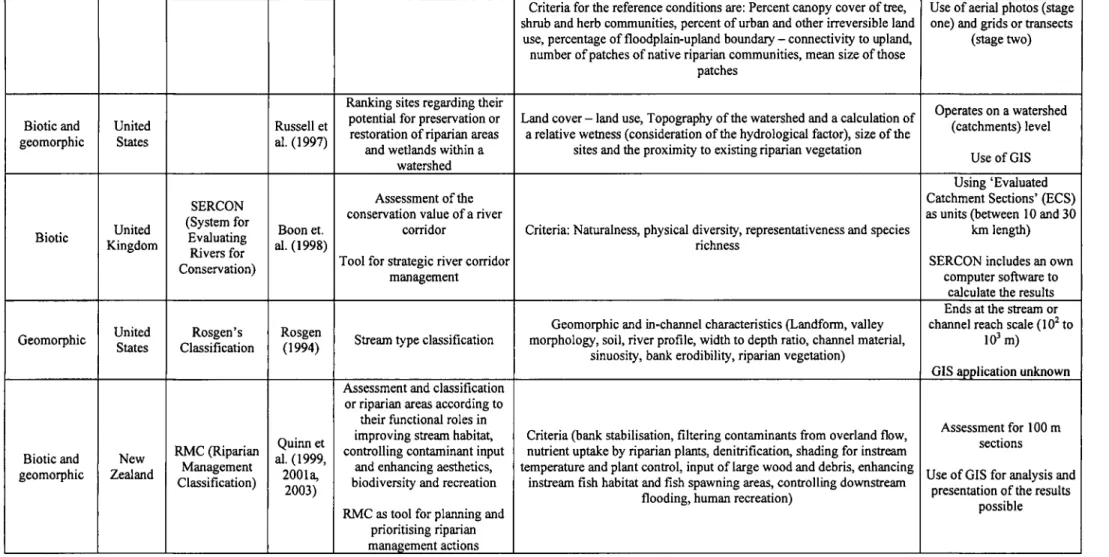
- International riparian management and classification approaches In general riparian classification and assessment systems can be divided into two
- New Zealand approaches
- Summary of approaches and linkages with GIS
However, all of these approaches to river and riparian classification, management, or restoration share a lack of one or more of the following criteria for being a GIS-based decision support model that facilitates riparian restoration efforts (Table 1). The goal of the proposed GIS decision system is to meet all three criteria by providing a multi-scale GIS decision support model.

3 Development of the GIS decision support system (DSS)
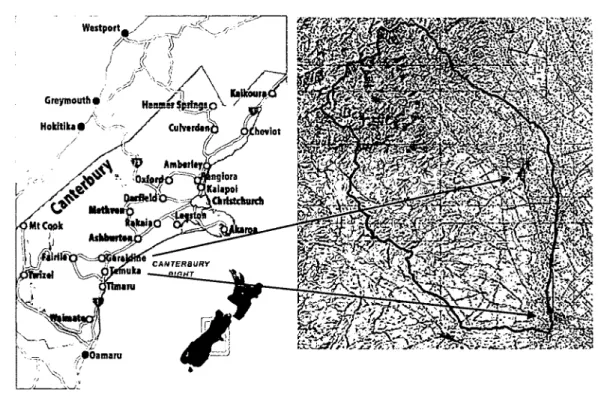
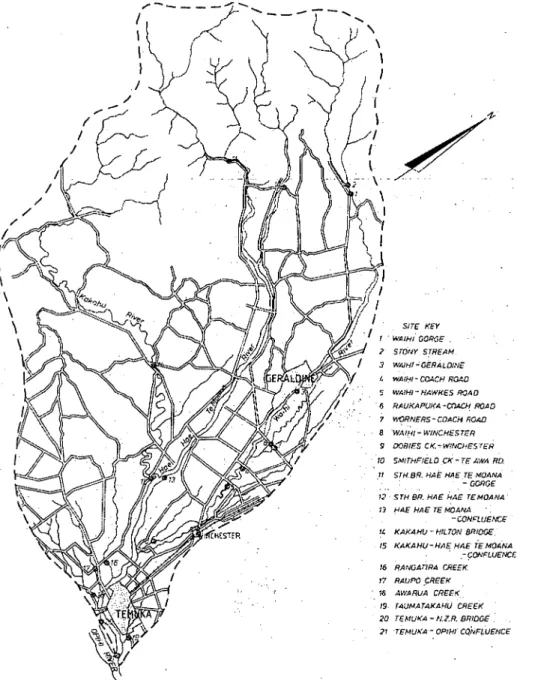
Study area description
The headwaters of the Waihi River are in the Canterbury foothills (40 km^), flowing from the Four Peaks. At the upper end of the upper bank or terrace, the characteristic plants of the Canterbury Lowlands are lowland Ribbonwood {Plagianthus regius), Kanuka (Kunzea ericoides) and Totara {Podocarpus totard). This led to a reduction in the width of the river meander from ~ 700 m to an active bed width of ~ 50 m.
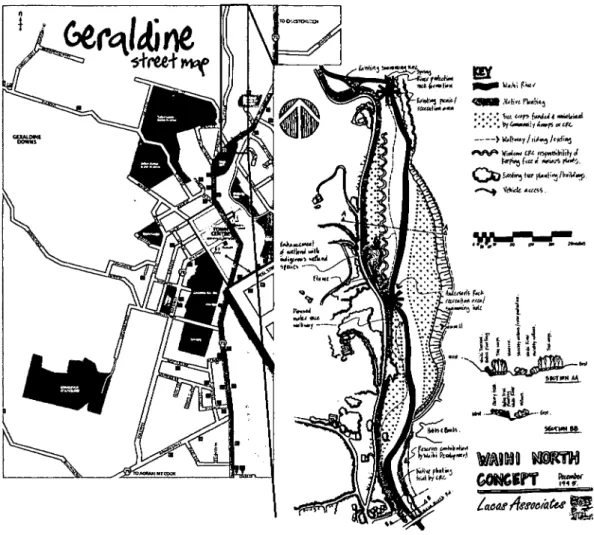
All participants of the Waihi River Working Group agreed on the restoration of the native ecosystem as a complement to the Talbot Forest adjacent to the site. The Waihi Working Group identified key potential riparian land uses along this section in terms of. The initial reasons for starting restoration work on this section of the Waihi River were the severe flood event in 1986 and the Canterbury Regional Council's flood defense work to stabilize the banks of the river.
Overall description of the GIS-based DSS
GIS decision support system - stage one
- Justification
- Model development
Based on this knowledge, phase one of the proposed GIS-based DSS provides the opportunity to search for the most suitable riparian areas for restoration at a stream reach scale by including factors operating at scales coarser than the stream reach scale, such as land cover and land use. Second, stage one allows stage two of the decision-making model to be considered in the context of a holistic ecosystem. Phase one can be used as the basis for the second phase of the model in terms of using the resulting map for.
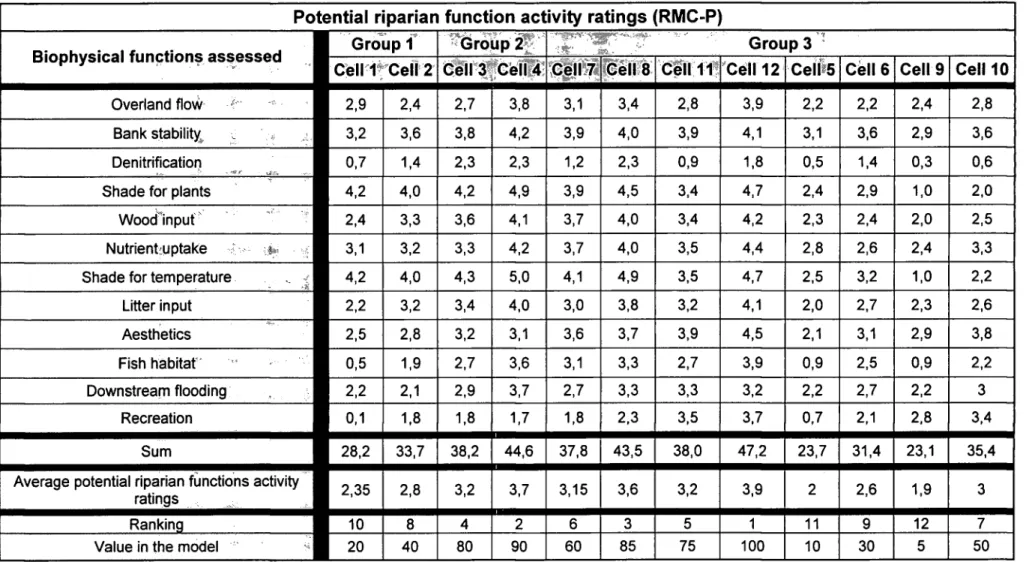
The on-site surveys were essential for collecting the data for phase two of the model. DOC data are important for incorporating the ecological function of connectivity. Table 4 illustrates the criteria used in phase one of the model and the data on which they are based. A classification of river reaches to indicate what each catchment contributes to the range of environments shown (i.e. the river reach classification within the River Environment Classification).

Combine &weiglnting of criteria impact
- GIS decision support system - stage two
- Justification
- Model development
The first stage of the GIS-based decision support system allows the selection of a river basin by the name of the main river in the basin (1). The first stage of the model calculates a multiple buffer for data on freshwater ecosystems of national importance and previously restored areas (2). The first stage of the GIS-based DSS was tested by implementing different weights of the five criteria.
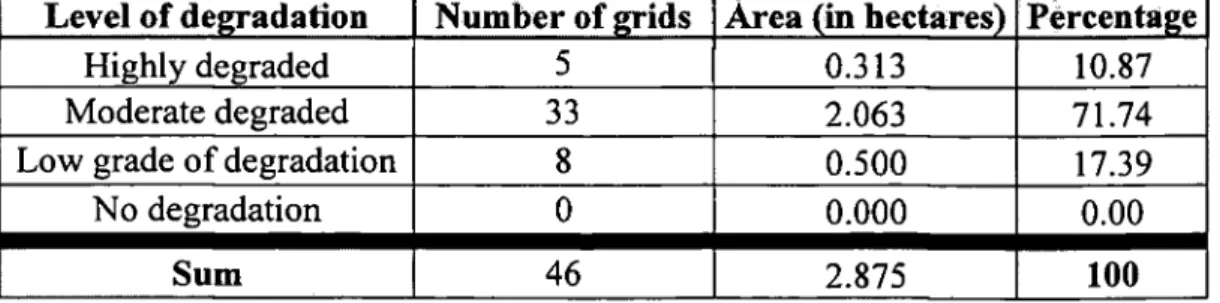
The result of running the first stage of the model was a map (5 in Figure 10) showing the beach areas classified in terms of the level of biophysical degradation (Table 3). Stage one of the GIS decision support system provides the opportunity to search for the most suitable beach areas for restoration on a wider scale. Stage two of the model is not directly linked to the results of stage one, but both can be used together.
Legend
The resulting map from phase two of the model classified the riparian areas according to their potential for ecological restoration efforts at a refined scale in 25 by 25 m grids. The areas for further assessment in phase two of the model are the areas with a rating of no degradation or low degree of degradation from phase one of the model.
4 Results
Stage one of the model
- Scenario 1
- Scenario 2
- Scenario 3
- Scenario 4
- Summary and comparison of the Scenarios
In scenario 1, the areas assessed as non-degraded were located in the lowlands and were limited to only two small sections, one in the southeastern part of the Temuka watershed and the second, geographically located right in the middle of the watershed. In terms of criteria, areas assessed as non-degraded exhibited a high average ranking of RMC potential, contained freshwater ecosystems of national importance, and had major land use types ranging from mainly sheep grazing to mixed grazing of sheep and beef. In scenario 3, the locations of areas assessed as non-degraded are distributed similarly to the distribution in scenario 2.
In terms of the criteria, the areas assessed as undegraded had a high average RMC potential ranking, and freshwater ecosystems of national importance with restoration sites. In scenario 4, the area assessed as unaffected was at the southern end of the foothills, and only in a small area in the southeastern part of the Temuka catchment. In scenarios 1 and 2, the classification of areas ranked as moderately deteriorated represented approximately half of the entire riparian area.

Scenario 2 Scenario 3 Scenario 4
- Stage two of the model
This subsection presents key findings from the application of the second stage of the model to a test survey on the Waihi River, north of Geraldine in the Temuka catchment, New Zealand. Therefore, this subsection contains the results for the second objective (the second stage of the model) and the third objective of the dissertation (the application of the model and its testing). The assessment was based on the results of scenario 1 of the first phase of the model, where all five criteria were given the same weight.
Due to the specific locations of some of the nets, an assessment scheme was used for more than one net. Due to physical limitations in the area, some net assessments have been carried out from the other side of the stream, and are mentioned on the respective assessment forms. The average time to assess a grid using the eleven onsite criteria (Table 11) was 6.5 minutes.
5 Discussion
Secondly, comparing the on-site assessment in phase two of the model yields divergent results with those found by GIS assessment alone on the Waihi River in the Temuka catchment. A comparison of the resulting map (Map 09) with the locations of freshwater ecosystems of national importance (Map 04) and the restored areas (Map 05) supported this view. It is based on using different criteria for each of the two phases.
The second stage of the model adopted a slightly modified version of Petersen's classifications (1992) to classify riparian zones. Finding the location of grids based on a printed map was sometimes difficult. An on-site assessment showed that 100% of all nets observed had a riverbank slope greater than 4.
6 Conclusion
Calibration and validation are essential in terms of testing the rules and parameters of the model, the accuracy of the results and figuring out what are the most influential criteria, either on a smaller scale or on a site scale, to choose for obtaining the most accurate results. The selection of criteria in this phase of the model is based on literature and various classification and restoration approaches. Therefore, further research in the areas of calibration, validation and selection of criteria could improve the accuracy of the model.
Such research should include fieldwork to assess the characteristics and conditions of riparian areas in the catchment and compare them with the model results. In terms of finding out what the most influential criteria are on site, further research could reveal the appropriateness of the chosen approach, using a modified version of Petersen's (1992) classification. Overall, more research on criterion selection on both scales could improve and increase the usefulness of the model.
7 List of references
- Appendix A - Glossary
- Appendix B - Flowchart of stage one of the model
- Appendix C - Flowcharts of the sub models
- Appendix D - Assessment form for the onsite assessment Please, find the onsite assessment form attached at the inside of the hardcopy
Managing waterways on farms: A guide to sustainable water and riparian management in rural New Zealand. An ecotonal community usually contains many of the organisms from each of the overlapping communities. A confluence of a channel with a stream of lower order does not increase the order of the stream below their intersection.
Please find the flowchart of the first stage of the model as a poster attached to the inside of the paper cover of the dissertation (Diplomarbeit). Please find the flowchart of the five sub-models as a poster attached to the inside of the printed cover of the dissertation (Diplomarbeit). 3 Local land use on the adjacent upland Permanent pastures mixed with forests and wetlands, few.

TOTAT,
Banks firm but loosely supported by grass and brush 15 Banks loose soil held together by a sparse layer of grass and brush 5 Banks unstable, loose soil or sand that is easily disturbed 1.
A (criterion 1)
A (criterion 2)
Kilometers
A (criterion 3)
A significance (criterion 5)
Sub model for Criterion 3 - Land use (type of farming)
Sub model for Criterion 4 - Proximity to previously restored areas
Sub model for Criterion 5 - Proximity to freshwater ecosystems of national significance