Electron diffraction studies have confirmed the (pseudo-cubic) tetragonal deformation of the fluorite-type parent structure and additionally revealed long-range order. The contribution of Cu Kβ to the diffracted signal was largely removed by applying a Ni filter in front of the detector. The phase purity of the U3O7 powder sample was checked by performing X-ray diffraction analysis at room temperature.
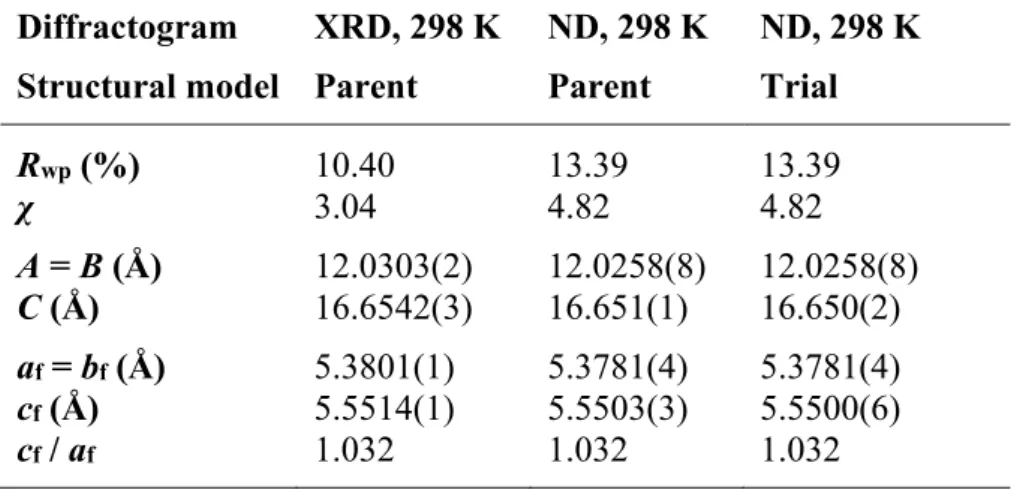
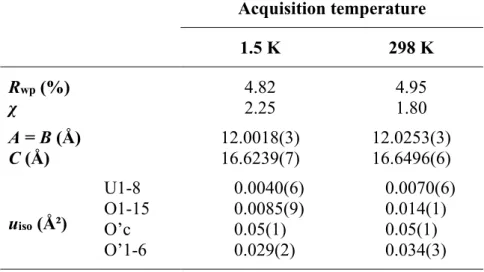
Similar to the evaluation of the XRD pattern, the ND pattern was evaluated via Rietveld refinement, using the parent structure model (results are shown in Table 1). Similarity factors and lattice parameter values obtained after Rietveld refinement of the XRD and neutron diffraction patterns at room temperature. 12 It is clear that the overlying structural model does not allow for a correct evaluation of the ND data.
Satellite reflections in the diffraction pattern refer to the occurrence of oxygen clusters that form long-range order in the crystal structure of U3O7.13,39 Therefore, a structural model that includes oxygen clusters must be used. Although the additional reflections are modeled in the 35–50° 2θ range, there are significant discrepancies in the profiles of both the satellite and the main reflection. Clearly, further refinement of the atomic arrangements and displacement parameters in the extended structural model is needed.
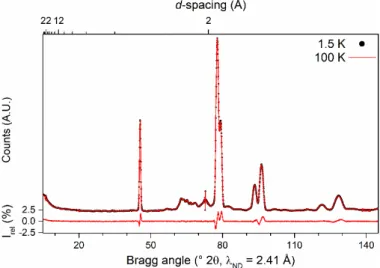
For this purpose, we will consider neutron diffraction datasets acquired both at room temperature and at 1.5 K (see Sections §3.3 and 3.4). Some scattering is visible around the main reflections due to differences in thermal expansion, but no further reflections can be distinguished in the low angle region. On the other hand, a tilted magnetic order, which does not produce strong additional scattering signals, cannot be immediately ruled out, and such an assessment will be carried out on the basis of the electronic structure calculations that are reported and discussed further.
Structure refinement at 1.5 K and 298 K
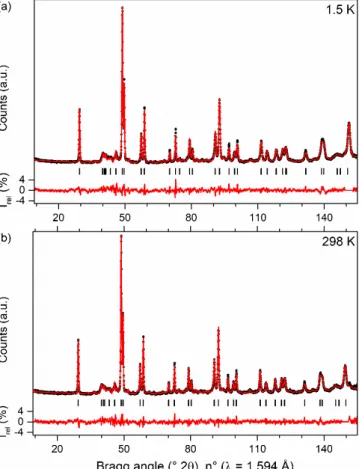
In a subsequent refinement cycle, the coordinates of atoms at general (xyz) Wyckoff positions, and then those of the remaining atoms included, were constrained to their respective site symmetry states. The scan range considered was from 9.00 to 154.95 °2θ, with a window between 148 and 151 °2θ excluded due to the previously discussed parasitic scattering signal coming from the cryostat. The calculation converged easily, demonstrating the suitability of the input structure, and excellent agreement was obtained (Rwp = 4.95 and χ = 1.80), see Figure 4 (b).
The thermal displacement parameters of the oxygen atoms that make up the cuboctahedral oxygen clusters (O'c and O'1-6) deviate from the values of the U1-8 and O1-15 atoms at both capture temperatures. We tried this model but did not achieve smooth convergence in the refinement process, most likely due to the strong correlation between the positional and anisotropic parameters of the atomic model. In the second experiment, the positional parameters were kept unchanged and only the thermal drift parameters were further improved, but this led to meaningless negative values for the axes of the anisotropic ellipsoids, indicating that we exceeded the information of the diffraction data set.
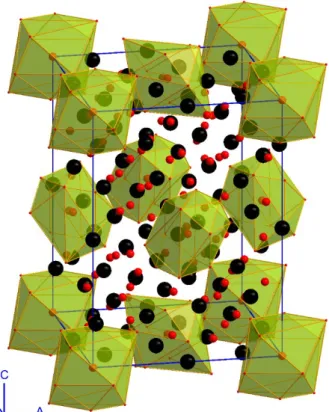
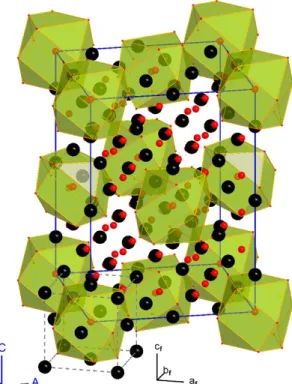
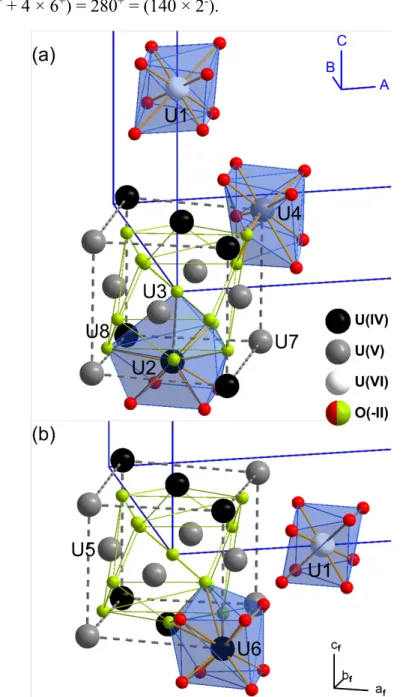
16 All structural parameters refined from 1.5 K and 298 K diffraction data are summarized in their corresponding crystallographic information files (CIF) and made available as Supporting Information. In addition, comprehensive summaries of the refined structural parameters are presented in Tables S4 and S5 in the ESI. A visualization of the expanded unit cell, refined from 1.5 K neutron diffraction data, is shown in Figure 5 .
One of the most obvious differences with the initial trial model (see Figure 1) is that the cuboctahedral oxygen clusters are no longer regular. For a regular cuboctahedron, the vertices are described by a
Electronic structure calculations
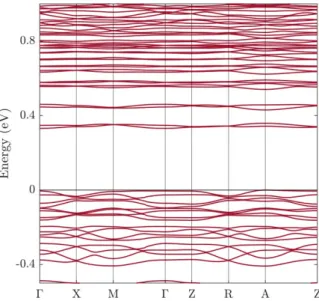
PBE+U calculated band structure of U3O7 along the highly symmetric lines in the Brillouin zone corresponding to the tetragonal structure, including spin-orbit coupling. The dominant contributions in the energy range shown come from the oxygen 2p and uranium 6d and 5f states. Interestingly, the oxygen 2p states contribute more to the top of the valence band than the uranium 5f states.
The electronic structure of U3O7 was further analyzed by considering the nature of the electronic states in the valence and conduction bands. This means that unlike UO2, which is a Mott insulator, U3O7 is better described as a charge-transfer insulator,16 or rather as a mixture of the two, with a stronger bias towards the latter. The difference with UO2 can be understood as arising from the overall change in the oxidation state of the uranium atoms, which in turn produces changes of coordination polyhedra and shorter U−O bonds.
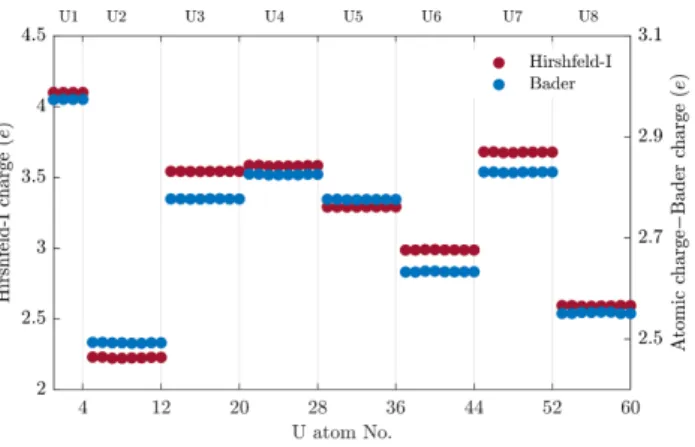
First, via the Bader analysis (Atoms in Molecules), where the atomic charge is integrated into non-overlapping atomic basins that have boundaries defined by the zero-flux state of the electron density.72 And second, via the iterative Hirshfeld (Hirshfeld-I) approach, where the charge density is mapped over a reference density and it is divided into basins that may partially overlap (the iterative Hirshfeld method is an improved version of the original Hirshfeld division).62 In principle, the Hirshfeld-I charges correlate with the ion interactions and provide a better description of an ion's nominal oxidation state.62. The independent calculation of the Bader and Hirshfeld-I charges for each atom in the cell provides evidence for the accuracy of the calculations, which depend on the sampling over a real spatial lattice and on the energy cut-off of the basis functions. In Figure 9, the magnitude of the magnetic spin moment is shown considering the contribution of either all orbitals (dark red dots) or only 5f orbitals (gold dots).
Local magnetic moment of uranium atoms: total (dark red dots) and f-orbital contribution only (gold dots). The analysis of the magnetic moments clearly divides the U1-U8 atoms into three classes, which establish a bijective correspondence with the U(IV), U(V) and U(VI) environments.
Charge localization in the nuclear structure
Considering the page multiplication factors, the last value corresponds exactly to that. The value theoretically expected to obey Pauling's electrostatic valence rule, i.e. illustration of several coordination environments of uranium in refined U3O7. 22 It is now useful to relate the local coordination chemistry in the U3O7 structure to the resulting speciation of uranium, see Figure 10. One uranium site (U1) is eightfold coordinated but highly distorted (see also Figure 10) by its fluorite original -type coordination in the test model.
Oxo-type bonding has commonly been associated with pentagonal bipyramidal (seven-fold) or octahedral (six-fold) uranium environments as found in U3O8 and in UO3 polymorphs. However, the refined structural model reported in this work contains up to 69 different bond lengths in the first coordination sphere of the different uranium sites. The short oxo-type bonds found in the U1 environment represent one out of 69 possibilities and thus contribute only marginally to the convoluted scattering profile at short U−O distances.
In addition, complementary oxygen shells could not be evaluated from the EXAFS data because the information limit was reached.38 The highest density of U−O bonds occurs in the range 2.1 to 2.5 Å (a histogram illustrating the axial distribution around each uranium site is available as Figure S3 in the ESI), which agrees well with the EXAFS evaluation. Although this condition was assumed in the experimental model, the atomic arrangements in the refined structure evolved towards a solution with a very compact U1 environment, which can only be. In this context, it is interesting to compare the refined crystal structure of U3O7 with that of Ca2YbF7 (I4/m), an ordered phase in the system CaF2−YbF3, which also exhibits a fluorite-related superstructure.76,77 Their similarity is illustrated in the ESI (Figure S4), together with a graphical presentation of the orientational relationship between both structures (Figure S5).
The colored lines present match the spectrum obtained by spectra of the isolated tetra-, penta- and. It will be of specific interest to further investigate the evolution of hexavalent uranium states during progressive oxidation in the U-O system, for example by comparing structural relationships between the phases surrounding the U3O7 phase field, i.e.
Magnetic correlations predicted from first-principles calculations
This particular choice converges to a possible magnetic structure solution where the atomic charge distribution and the norm of the magnetic moments still respect the experimental tetragonal symmetry. A comparison of uranium charges and amplitudes of the magnetic moments for the two initializations is available in the ESI (Figures S6 and S7). The loss of symmetry elements in the paramagnetic group approximately doubles the number of independent atoms.
The atomic positions of the 16 independent U atoms (and 42 O atoms) are available as magnetic CIFs in the ESI, and the structural parameters of the uranium magnetic atoms are summarized in Table S7. The unit cell consists of stacked cation layers, 4 of which are independent due to inversion symmetry. The projection of the magnetic structure along the cm axis (see Fig. 12) makes it possible to distinguish a repeating stack of 4 cationic layers with different characteristics.
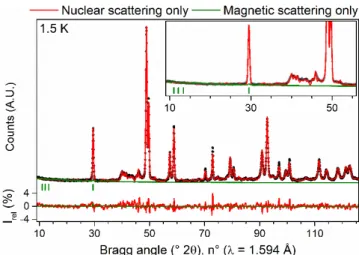
Half of the pentavalent atoms in this layer (U4a) are aligned along bm, and the remaining (U7a) along cm. The predicted magnetic intensities are very weak (the maximum magnetic contribution to the reflection is only 0.2% of the main nuclear peak). The contribution of magnetic scattering is also shown on the relative intensity scale at the bottom of the graph.
It is clear that the magnitude of the magnetic scattering is at the noise level of the diffraction data. Based on the orientation of the magnetic moments carried by the uranium atoms, a model was described in the magnetic space group P2'/c'. Tables containing the full structural parameters of the crystallographic models reported in the manuscript.
Supporting results from the electronic structure calculations, and a histogram showing the variation in bond lengths around the uranium sites.