This 'prepiak' results from the electrical breakdown of exhaust gas species with the application of energy. These disadvantages associated with spark source spectrometry facilitated the acceptance of GD for the analysis of solid samples.

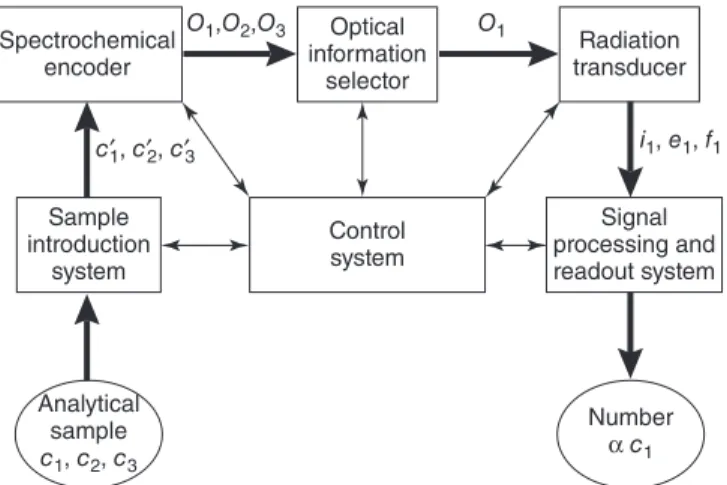
Basic Requirements Necessary to Obtain Optical Information
In many cases, the resolutions are determined by the monochromator's spectral bandpass,s, defined as the half-width of the wavelength distribution that is passed through the exit slit. This fraction is called the quantum efficiency and is the ratio of the number of photoelectrons ejected to the number of incident photons.
Atomic Emission Spectroscopy
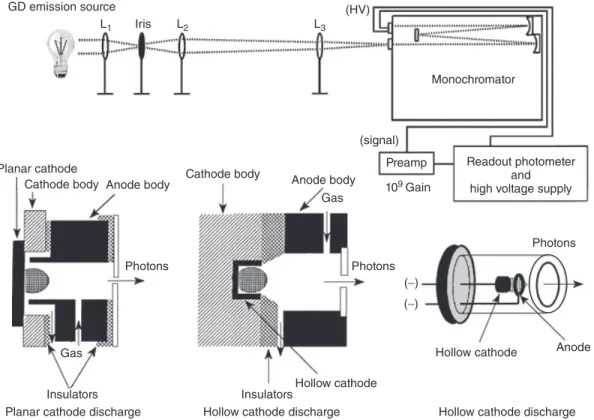
The signal intensity of an unknown concentration is then compared with the intensity of the standards and therefore provides the concentration of the relevant analyte. The planar cathode discharge is thus named because the portion of the sample exposed to the discharge is flat. With the development of the Grimm lamp in 1968(8) and its eventual commercialization, the planar cathode discharge gained widespread use for emission spectroscopy.
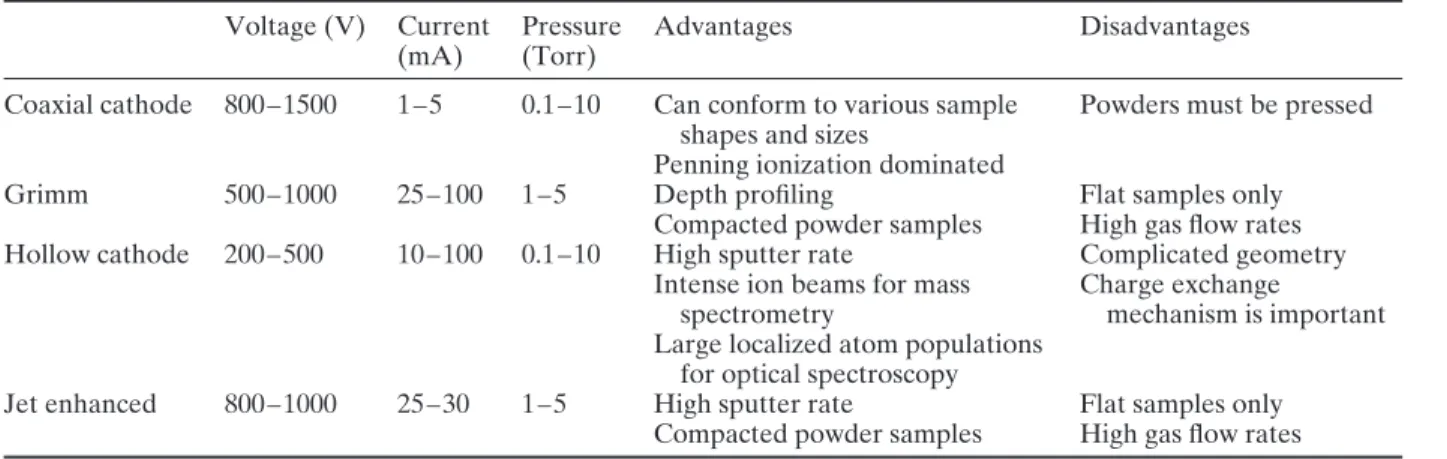
An interesting feature of the Grimm source is that it is a hindered discharge (i.e. the discharge is confined to the sample by the extension of the anode into the dark space of the cathode). Furthermore, the vacuum in the anode-cathode interior space is lower than in the discharge region itself, necessitating a dual outlet pump with a larger throughput for the interior electrode space.(128) A another interesting feature of the Grimm source is that the cathode is located outside the source itself; this provides easy sample exchange and means that the Grimm source is particularly suitable for the analysis of any flat conductive surface that can be lifted up to the source opening, such as foils or discs. Although the hollow cathode discharge looks physically similar to the planar cathode, the shape of the cathode cavity offers several properties that make it attractive for atomic spectroscopy.
Atomic Absorption Spectroscopy
This discharge takes its name from the cathode, which has been drilled to form a cylindrical cavity closed at one end. (129) The so-called hollow cathode effect can be shown as a GD with two parallel cathode plates that are close enough to each other until the two areas of cathode glow merge. (130) This coupling results in an increase in current density that can be several orders of magnitude greater than a single planar cathode at the same cathode drop potential. (131) Coupling this increase in current density with the longer residence time that the analyte experiences in the negative glow region (due to the shape of the cathode) results in a marked increase in the intensity of the emitted radiation compared to a planar cathode. Although hollow cathode discharges are widely used in atomic spectroscopy, most of these devices are the light source for AAS (see below). On the other hand, the asymmetric charge transfer excitation process responsible for some of the ion lines appears to be suppressed in the hollow cathode discharge.
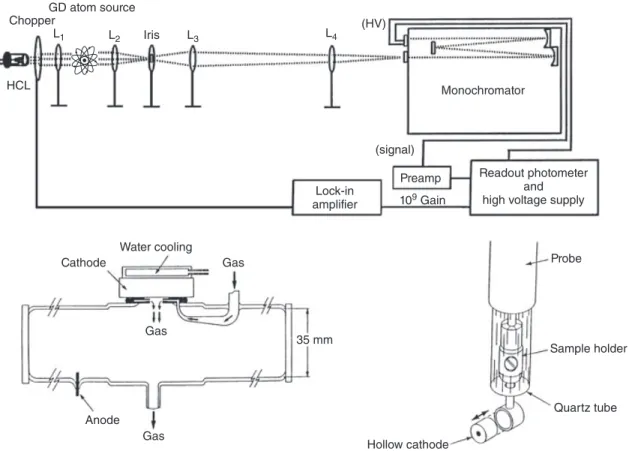
It is based on the Direct Insertion Probe (DIP) design of King. (137) The coaxial cathode in King's original design has been replaced by a stainless steel ring housing a removable hollow cathode (4.82 mm in diameter × 2.54 mm in length with a 3.18 mm hole in the middle). The DIP facilitates the tuning of the HCL emission, which is focused through the aperture (i.e., the region of highest atomic density) and collected after it passes through a window in a six-way vacuum junction. Although GD atomic absorption is not as widespread as flame or graphite furnace atomic absorption, it has found its niche in applications where analysis by other atomic absorption methods (primarily solution-based) is difficult (e.g., analysis of hard-to-dissolve materials).
Atomic Fluorescence Spectroscopy
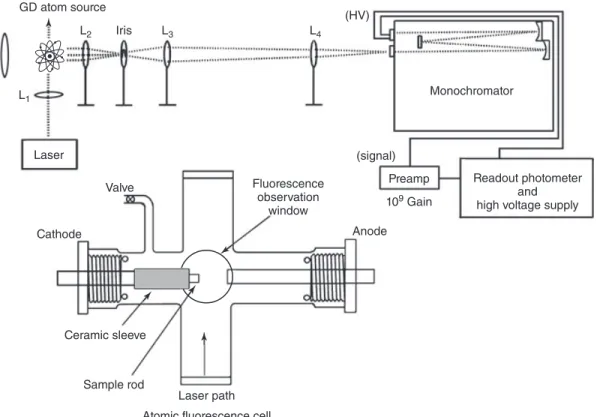
An inductively coupled plasma has also been used as an excitation source; here the excitation wavelength is controlled by the analyte aspirated into the torch (usually at high concentrations). Most atomic fluorescence measurements have been made with flame atomizers, (122) but more recently inductively coupled plasma has been used. When analyzing a solid sample, however, an atomizer such as that shown in Figure 11 is more practical.(138) This simple design consists of a Pyrex glass housing into which a 6.35 mm diameter sample rod is inserted through a ceramic sleeve and sealed to the cell with O-rings.
A filling port and an evacuation port are also provided, and the entire cell is pumped by a single rotary vacuum pump. Another application of atomic fluorescence by this group (139) is based on a GD cell constructed from high-vacuum components such as ConFlat® crosses and sapphire-window flanges, but the operating principles remain the same—fluorescence is detected at 90° to the laser. beam path with a photomultiplier tube. Finally, it should be noted that atomic fluorescence spectrometry has also been used for diagnostic studies in GD plasmas, specifically to measure 2D density profiles of scattered Ta atoms and corresponding ions, (140) as well as to measure 2D density profiles of metastable Ar atoms. (141) In both cases, a comparison with computer modeling results was made to gain better insight into the underlying mechanisms for the production of these species in DG, and reasonable agreement was reached. (140, 141).
Optogalvanic Spectroscopy
Like AES and AAS, the ideal nebulizer for fluorescence would produce a stable population of atoms with sufficient number density to make quantification of small concentrations practical. A DC power supply (Electronic Measurements, Eatontown, NJ) provides voltages up to 600 V and currents up to 200 mA. The fluorescence signal is amplified by a broadband amplifier and processed by a gated integrator and boxcar averager; the result is a fluorescence spectrum as a function of wavelength, which is indicative of the elements in a GD cathode for which a fluorescence transition is allowed.
Basic Requirements Necessary to Obtain Mass Abundance Information
These types of systems use a series of pumping areas to reduce the effect of the pressure drop required. Typically, similar capabilities are placed on the first and third lenses, while those of the center lens are adjustable. If the ion's energy is very large, it will not be sent around the center stop and will collide with the side electrode or exit plate.
When operated using high-grade resistors and amplifier components, these detection systems provide the ultimate in signal-to-noise ratio measurements. This allows simultaneous collection of selected ions during the acquisition sequence without scanning the mass distribution device, virtually removing any dependence on fluctuations in ion beam intensity arising at the source. Both electron multiplier and Daly based detection systems can operate in a way that integrates the impinging ion beam current.
Magnetic Sector Mass Analyzers
It is important to keep the count rate low enough (<106 counts s−1) to maintain the integrity of the pulse counting system and ensure that any pulse not measured due to time delay in the electronics will be statistically insignificant. Daly detection systems behave in a manner similar to electron multipliers.(153) In the Daly system, the ion beam is accelerated to 10–20 kV and directed at a highly polished aluminized steel electrode placed directly behind the collector slit. These detectors are made of very thin glass discs or plates perforated with microscopic channels oriented parallel to the impinging ion beam.
The nature of the detector material is such that, in the presence of a potential bias (up to 1200 V), an ion impinging on the entrance to one of the channels will release one or more electrons, which will then cascade through the channel, with each wall collision releasing additional electrons. Mass resolution is a measure of an instrument's ability to separate ions with small mass differences. This is achieved by narrowing the width of the entrance and exit slits, thereby reducing the width of the ion beam. (155) Mass resolution becomes more important when ions with the same nominal mass need to be separated.
Quadrupole Mass Filters
Mass resolution is another parameter that affects the ability of a system to solve an analytical problem. Mass resolution in magnetic sector instruments is defined by ion beam focusing at the focal plane. They provide adequate to excellent resolving power, especially when an electrostatic sector is coupled to a magnetic sector to provide dual (momentum and energy) focusing.
When used in sequential detection mode, sector instruments are hampered by relatively slow scan speeds that negatively affect analysis time and sample throughput. In the past, there were a number of commercial instruments available from various suppliers, based on industry design.
Ion Trap and Fourier Transform Ion Cyclotron Resonance Devices
The operation of a QIT is very similar to that of a quadrupole mass filter. The magnitude of this resonant excitation is directly proportional to the amplitude of the applied signal. Mass analysis can thus be performed by scanning the frequency of the AC excitation signal.
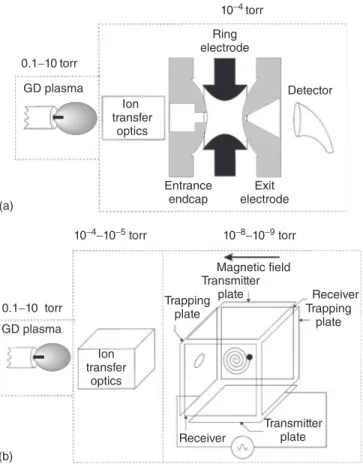
The relatively high operating pressure of QIT makes it suitable for coupling with ion sources operating at higher pressures, such as GD. This characteristic allows physical separation of the analyte signal from interferences without actually removing the interference. A homogeneous magnetic field confines the ions radially, while electrostatic potentials are applied to the cell end caps to trap the ions axially; see Figure 14 (b).
Time-of-Flight Mass Spectrometers
Gijbels, 'Two-dimensional model of a direct current glow discharge: Description of the argon metastable atoms, sputtered atoms and ions', Anal. Saito, 'Relative Sensitivity Factors in Direct Current Glow Discharge Mass Spectrometry Using Kr and Xe Gas – Estimation of the Role of Penning Ionization', Fresenius J. Gijbels, 'Relative Sensitivity Factors in Glow Discharge Mass Spectrometry: The Role of Charge Transfer Ionization' ,J.
Donko, 'Experimental investigation of the asymmetric charge exchange reaction in the Ar+-Ni system in the afterglow of a pulsed glow discharge', Spectrochim. Harrison, "Parameter evaluation for the analysis of oxide-based samples by radiofrequency glow discharge mass spectrometry," Anal. Pan, "Time-resolved studies of ionized sputtered atoms in pulsed radiofrequency driven glow discharge mass spectrometry", Anal.
Bordel, 'Spatial Emission Distribution of a Pulsed Radio-Frequency Glow Discharge: Influence of the Pulse Frequency', Spectrochim. Van Grieken, 'Quantitative analysis of zirconium oxide by direct current glow discharge mass spectrometry using a secondary cathode', J.