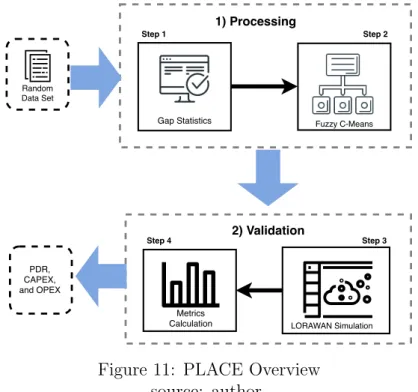
Summary of the master's thesis presented to the jury as partial fulfillment of the requirements for the master's degree in the Postgraduate Program of Electrical. Low Power Wide Area Network (LPWAN) technologies have recently gained interest from the research and industrial community. It considers the Gap statistics method to find the number of LoRa gateway which is used to calculate the gateway location using Fuzzy C-Means algorithm.
Introduction
- Overview
- Motivation and challenges
- Goals
- Text organization
On top of the LoRa physical layer, LoRa Alliance defines the higher layers and network architecture [18]. While previous studies have investigated placement problems, to the best of our knowledge, none of them have addressed the issue of the LoRa port placement, including minimum capacity requirements that are considered cost-effective.
Theoretical Reference
- LoRa Overview
- LoRa Modulation
- Spreading Factor Orthogonality
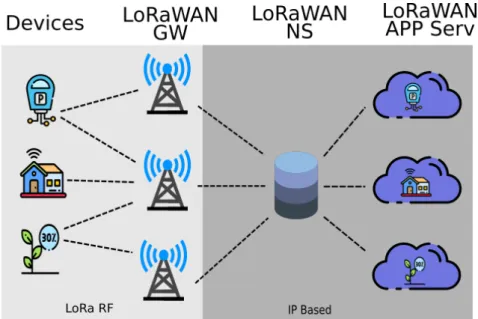
- LoRaWAN Overview
- Network Topology
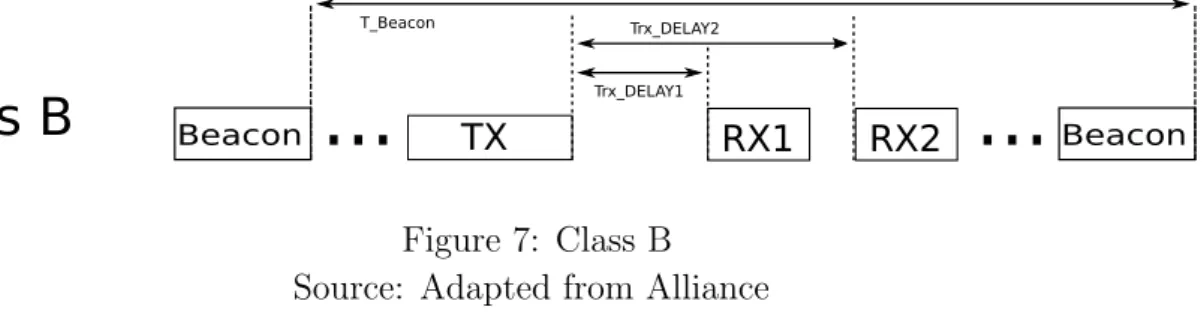
- Devices Classes
- Frequency Bands
- Clustering
- K-Means
- C-Means
- Final Remarks
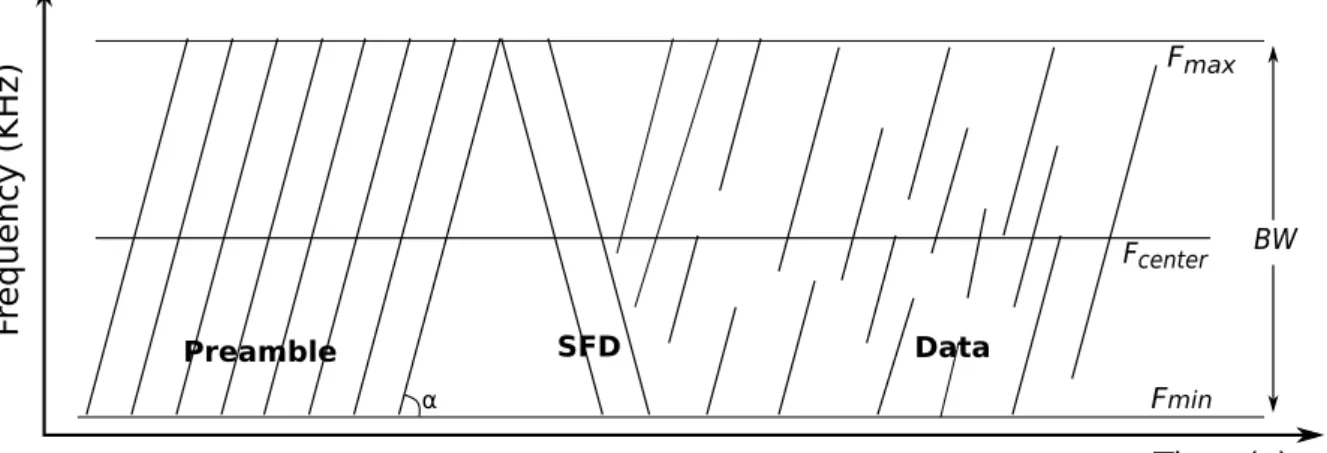
In LoRa, the spreading of the spectrum is achieved by generating a chirp signal that continuously varies in frequency [56]. This means that, assuming the modulation uses a fixed bandwidth, increasing the spreading factor by 1 will produce symbols that last twice as long. An SF change also translates into a change in the Time on Air of the transmitted information.
A compelling feature of the LoRa modulation is that different spreading factors are pseudo-orthogonal even when the same center frequency and bandwidth settings are used. While the ED and NS stacks have an application layer, gateways are only tasked with forwarding messages between the sensor (i.e. the EDs) and the NS and are consequently completely transparent to the end application of the device that is logically connected directly to the one on NS. In addition, to the topology of the network, Sornin et al.[57] also describes the communication protocol.
The algorithm alternates between assigning each point to the nearest center, and selects the cluster center as the average of the points assigned to it. The objective function, which measures the clustering fit to the data, uses the Sum of Squares of the Error (SSE), also known as dispersion. The Euclidean distance from each point to the nearest center is calculated, then the sum of the squares of the residual error is calculated.
We then define LoRaWAN, going through the topology, the protocol stack, and finally the definition of the device classes.

Related Work
LoRaWAN
Remarkably, this result was obtained in very favorable conditions, with the gate placed at a height of 71 m above the ground and the highest possible dispersion factor. Specifically, they propose a solution for two link failure scenarios, that is, the first when the received SNR is below the limits of the acceptable SF parameters and the second for co-propagation sequence caused by simultaneous transmission. However, a massive device deployment likely requires multiple LoRaWAN gateways positioned close to each other, and the proximity will increase access interference.
1] explain the field of LoRaWAN by exploring the boundaries of the technology, balancing them with applications and explaining the open research challenges. Thus, the combination of the number of end devices, the selected SFs and the number of channels will determine whether the ALOHA-based access and maximum duty cycle control suit each usage scenario. For example, we have seen that deterministic monitoring and real-time operation cannot be guaranteed with the current LoRaWAN state-of-the-art.
Maximum capacity can theoretically be obtained under perfect node synchronization and scheduling. First, they provide an overview of commonly used LPWAN solutions; NB-IoT, LTE-M, Sigfox and LoRaWAN, and.
Gateway Placement
Simulation results on several topologies and traffic flow scenarios evaluate the effectiveness of the proposed ILP formulation. They showed a significant reduction in total cost and relied heavily on the user distribution and position of the Fiber Access Point. However, the author has a fixed number of gateways, and often multiple gateways run below performance.
It may happen that you have a large number of lost packets due to the lack of available channels for reading data. Simulation results show average improvements of 15% and 20% in network throughput and energy efficiency, respectively. In the scenario assumption part, the two dimensions, coverage and capacity, are used to divide the scenarios.
The segments of the cost structure provide an overview of the costs of deploying an IoT network; the calculation method is also introduced. 50] describe our experimental LoRa setup in the city of Rennes - LoRa FABIAN, and they designed, performed and analyzed measurements for it.
Final Remarks
PLACE
Network and System model
Empirical reproductive models are based on making various measurements and observations in real reproductive environments, the equation that dictates a practical model is created in such a way that it best fits the measured data, for an empirical model to estimate reproductive losses in ' given an environment efficiently, its parameters must be derived from characteristics of the studied location, linked to the frequency of system operation and effective antenna heights used for signal transmission and reception. Below, some of the most well-known models in the literature will be addressed, with some comparative performance analysis on the model generated in this work. The Okumura-Hata model is well known and used in the planning of cellular networks, as it is one of the main references for projects in this area, this model was generated from graphs with information about the lost path obtained by Okumura in several measurements in the city of Tokyo, in the bands between 150 mhz and 1500 mhz.
This model is valid for base stations (transmitter) with effective heights between 30 m and 200 m for client (receiver) heights between 1 m and 10 m. In addition to being well used for mobile networks, studies show the effectiveness of this model for a LoRaWAN -network [19]. The propagation models are necessary to implement on the simulation to estimate the received power of the receiver.
Gateway Placement
- Gap Statistics
- LoRaWAN Simulation
- Metrics Computation
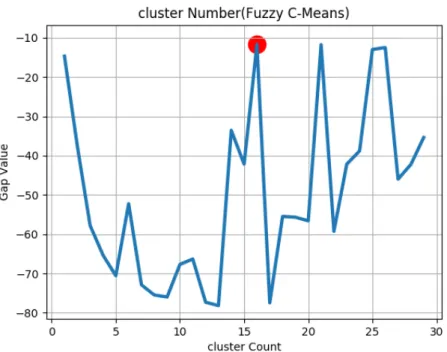
Iterate over cluster numbers (c∈[1,2,3.., C]) and calculate the Fuzzy C-Means objective function (J mc) based on Equation (4.6), which gives a measure of the compactness of our clustering . In light of this, the clustered index, which maximizes the value of this function, should give a good approximation of the cluster number to be used, as shown in Figure 12. For an accurate overview of the variation of this value, the standard deviation (sd(c)) for each group number c is calculated based on Equation (4.8).
From the standard deviation values based on Equation (4.9), we estimate the simulation error to prove the accuracy of the group number selection calculated by the Gap Statistics (Gap(c)) function. In addition, due to the LoRa simulator, the algorithm returns the exact position of the center cluster, which together with original object dataset constitutes the position scenario for simulation. If the modulus of the difference between the two Hessian matrices is less than or equal to the expected error, that is, the matrix stops changing significantly over the algorithm iterations.
In other words, it is necessary to include the basic requirements for a LoRa network to work properly, such as SF, CR, frequency or even the number of channels, which are some examples of the peculiarities of a LoRaWAN. Finally, to develop the part of the Gateway, it is necessary to take into account all the requirements of the devices and the environment and add elements of the antenna.
Chapter Conclusions
Evaluation
Methodology
We consider a LoRa Class A network, where transmissions are always initiated by IoT devices, in an asynchronous manner. In this work, downlink transmissions, i.e., messages from gateways to IoT devices, are considered. We do not consider it a significant limitation since we expect most of the traffic in an LPWAN to be uplink.
We think that all the ports transmit with maximum power Pmax, with an antenna gain of Gt. Finally, PLACE, we calculate the number of gates using gap statistics and then find the gates location using Fuzzy C-Means. Since all the places where the gates will be installed will be rented, this is about a rental cost.
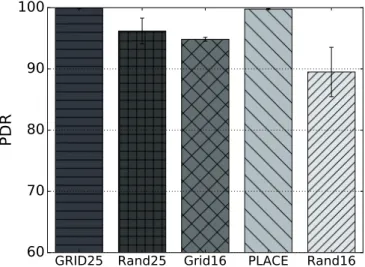
Celet is about the cost of electricity per year, and CT rans is about the cost of transmission depending on the technology chosen for Txinst. We import users and port positions from a file, then run each algorithm (Grid, Rand25, C-Means, and Rand16) 33 times to get the number of packets sent, packets received, amount of packets lost due to interferences and the number of lost packets with no more channels available. We use a 5x5 Grid for a Grid algorithm, which amounts to 25 gates.

Results
Considering Figure 15, we took a seed from the simulation, the seed is the same for Figures 12 and 13. We considered Grid25 and PLACE, since Rand25 and Rand16 have the same number of gateways, and thus CAPEX and OPEX will be the same. Analyzing the results of Figure 18, we can observe that PLACE reduces CAPEX by 36.36%, since.
We consider = 1 in Equation 5.3, but even if the variable is increased, the ratio remains the same, because there is no operation to increase or decrease the OPEX calculation. As mentioned earlier, the cost of the other algorithms will not change the cost since they have the same amount of gateway. All costs take into account only the gateways, because the costs of the devices will be the same regardless of the algorithm we choose.
These costs are associated with the technology responsible for sending the gateway information to a cloud (e.g. LTE, WiFi, etc.).
Chapter Conclusions
Conclusions
Contributions
Future works
Academical Production
In Proceedings of the 13th International Conference on Distributed Computing in Sensor Systems (DCOSS), pages 27–34, June 2017. InProceedings of the 19th International Conference on ACM International on Modeling, Analysis and Simulation of Wireless and Mobile Systems, pages 59–67 . In Proceedings of the 2nd International Multidisciplinary Conference on Computer and Energy Science (SpliTech 2017), pages 1–6.
In the proceedings of the 4th International Conference on Smart and Sustainable Technologies (SpliTech 2019), pages 1–6, June 2019. Experimenting with a wide reach network in an e-health environment: discussion and future directions. In proceedings of the 16th Annual International Conference on Wireless Communications Mobile Computing (IWCMC 2020), Limassol, Cyprus, June 2020.
In Proceedings of the IEEE 23rd International Conference on Emerging Technologies and Factory Automation (ETFA 2018), pages 671–676, Sep. Computational methods for network aware and network agnostic iot low power wide area networks (lpwan). IEEE Internet of Things Journal, 2019.