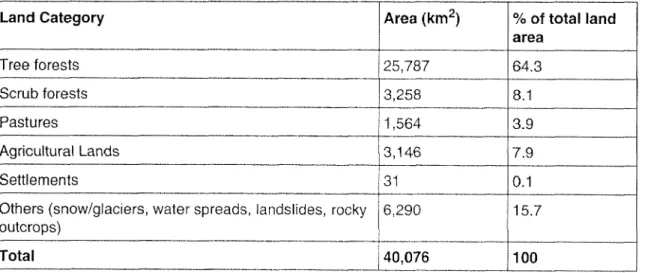
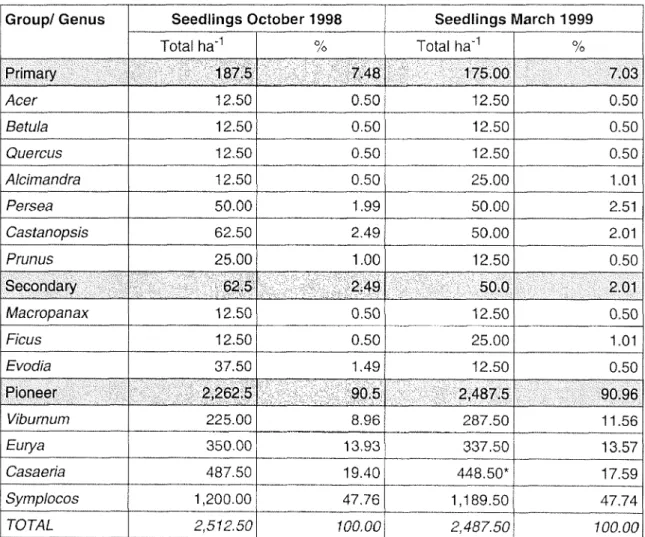
Table 3.24 Paired sample of mean density (noha-1) of total number of seedlings for October 1998 versus March 1999 with 20 plots in Asinabari forest 60 Table 3.25 Number of seedlings (noha-1) by group/sex in Asinabari forest in October 1998 and later. Figure 3.10 Number of trees and standing volume distribution in the southwest spectacle 55 Figure 3.11 Bottom vegetation in the Asinabari forest in October 1998 and in March 1999 57. About 36.5% of the forest consists of coniferous trees, 52% of hardwood forest, 11.2% from scrub and plantations are nominal (Table 1.2). About 26% of the total forests (Table 1.2). representing the main eco-floristic zones) are set aside as protected areas.
Major vegetation zones
Growing stock
Forest management planning in Bhutan
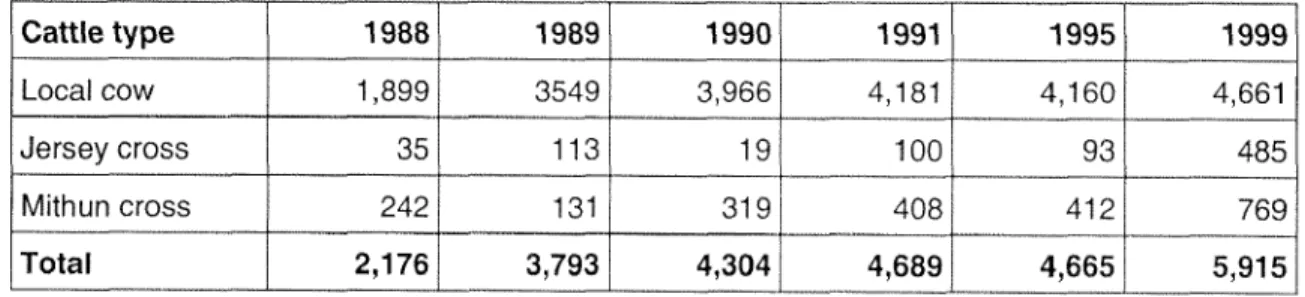
Bamboo, brush and leaf fodder can be used in Tsamdrogi when grass is in short supply (Land Act 1978). Grazing policy. It is believed that livestock numbers have steadily increased over the past few years and that the current number of cattle in the country exceeds the capacity of available pasture.
Scope of cattle grazing in forest management
Broadleaf forest management planning-status and prospects
Much to the dismay of the foresters, the cattle continue to graze in forest areas where grazing is not allowed. On the other hand, farmers and herders are angry with the foresters if they do.

What are the aspirations and perceptions of cattle herders and farmers? How are their
How can the needs and aspirations of cattle herders and farmers be integrated in forest
How can the conflicting goals of wood production and cattle grazing be reconciled through the planning process?
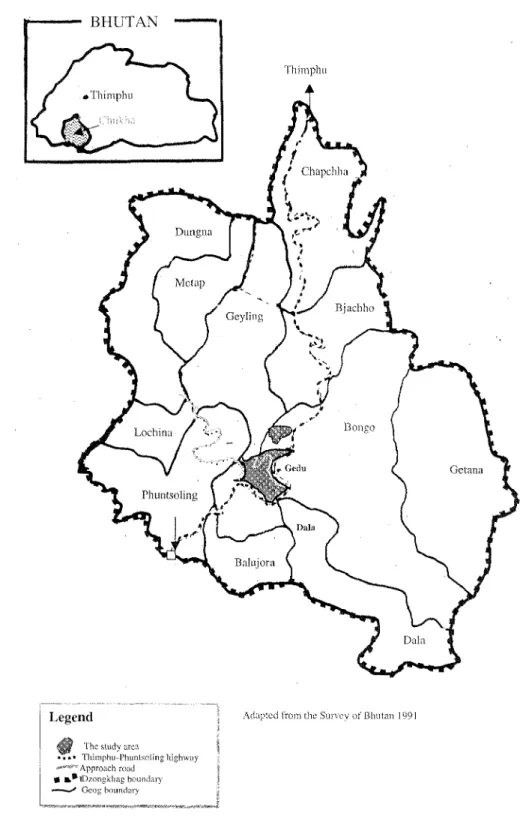
Forests cover 86.9% of the Dzongkhag, while 9.4% and 2% of it is under agriculture and pasture, respectively (Table 2.1).

Agricultural practices
Forest inventory concept
Based on their main activities, the farmers in the study area can be grouped as seasonally migrating pastoralists or sedentary farmers occupying two slopes in the study area. The migratory herdsmen occupied the southwest slope. Variations within site were believed to be very small and no attempt was made to stratify the sites. A systematic sampling design was chosen. Given the practical reason of keeping the running time between plots as short as possible, the distance on the inventory line (between plots) was intuitive.
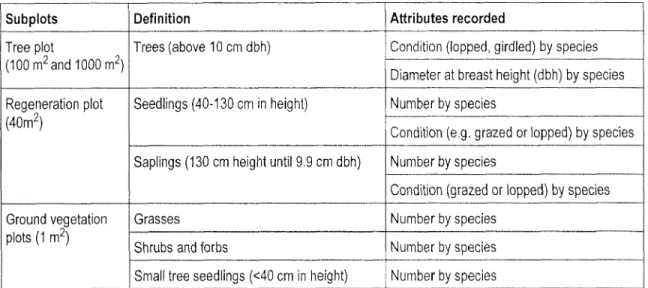
To start the site census, a reference point (road, stream, etc.) was selected in the field and then marked on a topographic map (1:50,000) to determine the correct position. Trees (over 10 cm dbh) Condition (pruned, girdled) by species Diameter at breast height (dbh) by species Plot for regeneration.
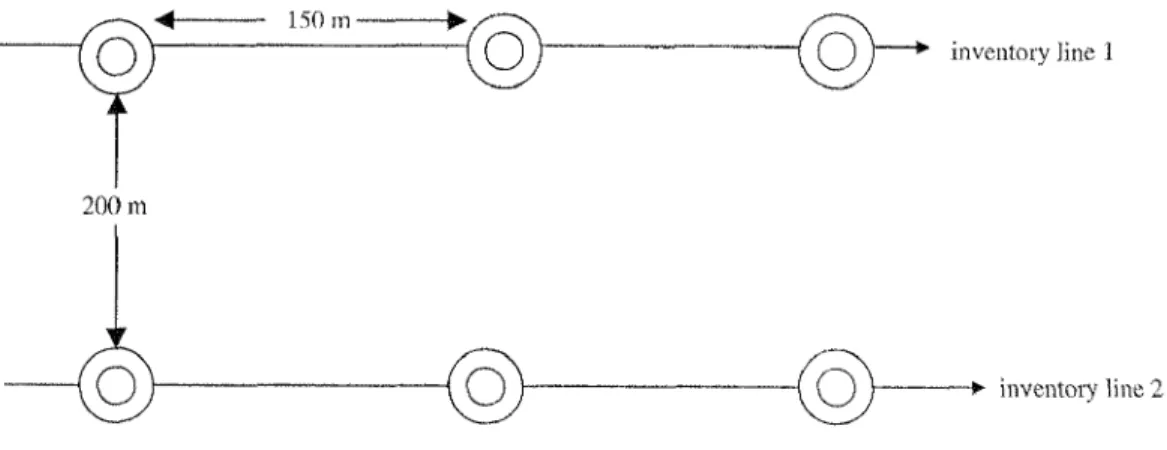
Adapted inventory design
- Assessment of ground vegetation, seedlings and saplings
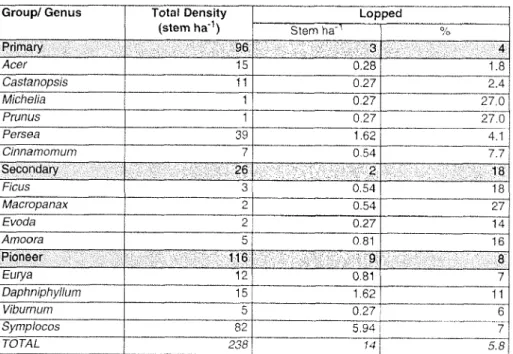
- Species composition, density and gross volume of forest stands and condition of standing trees (lopped, girdled)
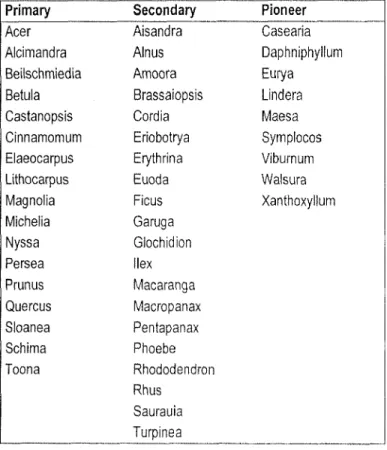
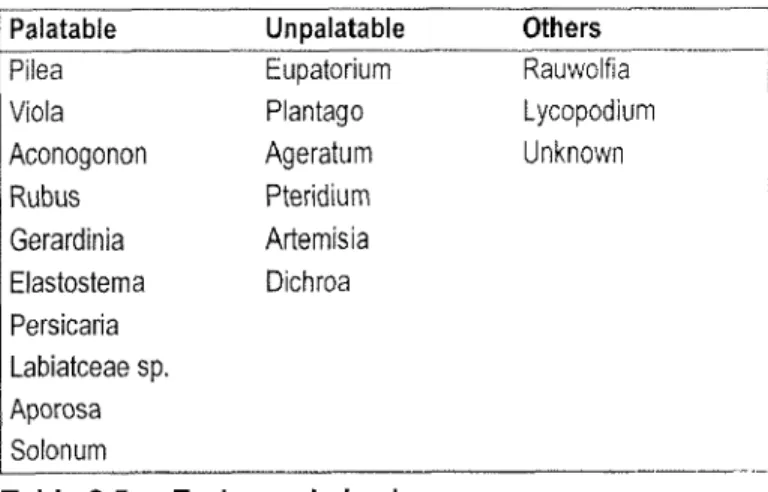
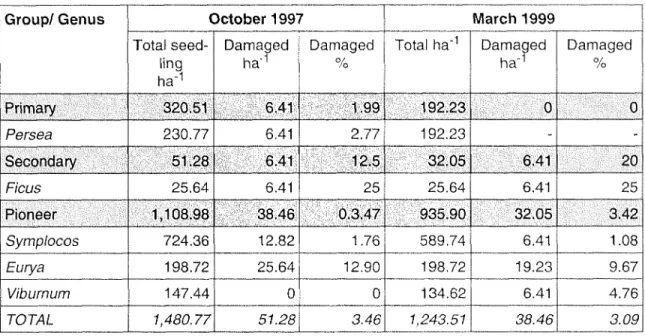
Tree species: Saplings, saplings, saplings and trees are grouped into three groups according to their ecological heritage and silvicultural characteristics (See Table 2.6 for species details; for Latin and local names, see Appendix III). No information was available on the condition of forage in Tsamdrogs in these two seasons. This information would facilitate the regulation of livestock grazing in Tsamdrogs, according to the availability of fodder. Rubia, Rubus, Solomon, Persicaria, Labiatae and Aporosa were also observed. registered in October 1997 had disappeared in March 1999.
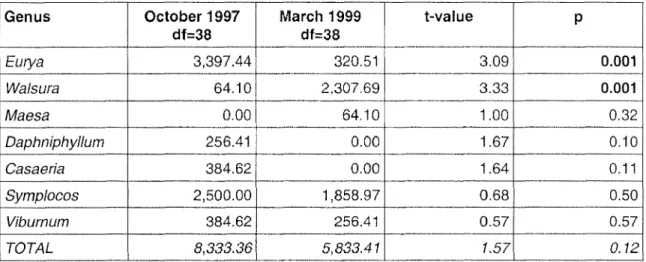
Some species such as Ficus, Daphniphyllum, Glochidion and Casaeria, which were documented in October 1997, disappeared by March 1999, while Castanopsis and Maesa, which were not recorded in October 1997, appeared by March 1999. In October 1997, was just something.
Seedlings and saplings
- Seedlings
- Saplings
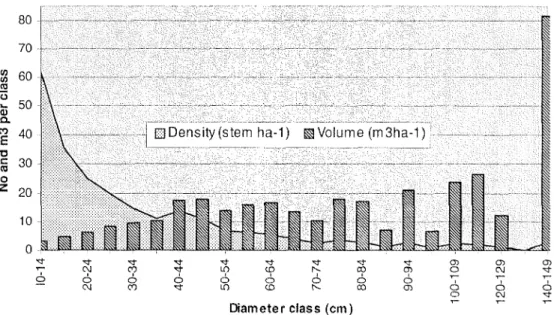
However, the average volume per species indicated that trees with a lower diameter were mainly represented by the pioneer group (0.33 m/tree), while trees with a larger diameter. The number of Viola and Pilea that normally grew under the forest canopy. when it had extended into the forests.
Seedlings and saplings
- Seedlings
- Saplings
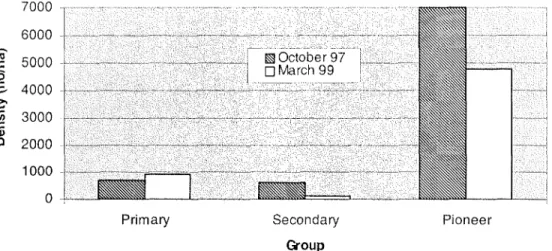
Relatively speaking, the average number of saplings per hectare was higher than that of seedlings; the average number of saplings was estimated at approximately 1753 ha"' and 1662 ha"1 in October 1997 and March 1999 respectively (Table 3.17). There were no significant numbers. With regard to the northeastern aspect, the primary group constituted the bulk of the growth material in the forest (Table 3.19). A few old large diameter trees from Castanop. Laumans (1990) estimated a stand density of 365 tree ha with a corresponding gross volume of 345 m3 ha1. The forest on the southwest slope of the study area was degraded in terms of timber production strength and the gross volume of the trees was extremely low.
Seedlings and saplings
- Seedlings
- Saplings
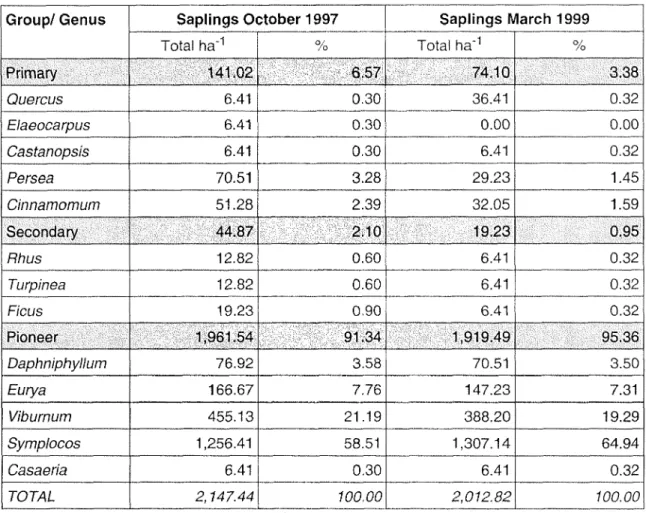
The growing stock of primary trees, except for Persea, was concentrated on larger diameter trees, while they were underrepresented in the lower diameter trees (Table 3.27). The lower canopy of the forest was dominated by the pioneer. The average number of trees in the forest amounted to 166 treesha"1 (±46treesha"1) and . the corresponding gross standing volume amounted to 277 nfW^ilOS.ln^ha"1). The volume distribution trends for all species were similar to those found on the north-east and south-west aspects. substantially contributed to the high growth.
Comparison of ground vegetation, tree seedlings and saplings on
- Seedlings and saplings
Table 3.30 Two-sample teston average density (no ha"1) of bushes/shrubs grouped by aspect for October 1997 and March 1999. In March 1999, the south-west aspects should have had a significantly higher number of damaged saplings than the north-east; the difference was in any case settled between.the 1 stand 2nd summary) indiscriminate felling of saplings by workers on the hydroelectric project construction scheme on the north-eastern aspect.

Ground vegetation, seedlings and saplings in relation to altitude,
- Availability of understorey forage plants
- Grazing impact on seedlings and saplings
- Density and species composition of seedlings
- Density and species composition of saplings
- Grazing impact on forest stands and species composition
- Species composition
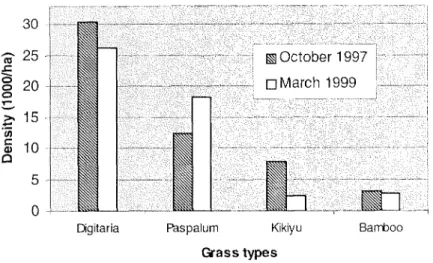
This showed that the closed forests in the study area are located at the highest altitudes and at a distance from the settlement. Grasses and less dense forest formations are preferred (in the south-west), while forests and shrubs do well in all three locations. Paspalumis being increasingly replaced by Digitaria8 species in the open grasslands of the study area. Unpalatable forbs.
Evaluation of ground vegetation on the southwest aspect shows that the number of grasses and shrubs is reduced in winter, and then even unpalatable bamboo is sought. Similar observations were made by Millar (1987) in the Gedu area where these seedlings of primary species were common in protected area pockets (between fallen tree trunks and stumps) where cattle could not reach them. On both aspects, however, the number of trees in the small diameter class (10-30 cm) is low, and this cannot be explained by logging. It can either be attributed to indiscretion.
These observations show that, in addition to logging, the current species composition and trunk diameter distribution of forest stands in the study area was also influenced by cattle grazing.
Lopping of trees affects the growth and quality of trees due to the constant
Socio-economic conditions
- Changing lifestyle
- Tsamdrogs and grazing practices
- Tsamdrog right ownership
- Differing grazing patterns
- Typology of Tsamdrog
- Traditional grazing practices
- People's perceptions of forage, cattle and forest management
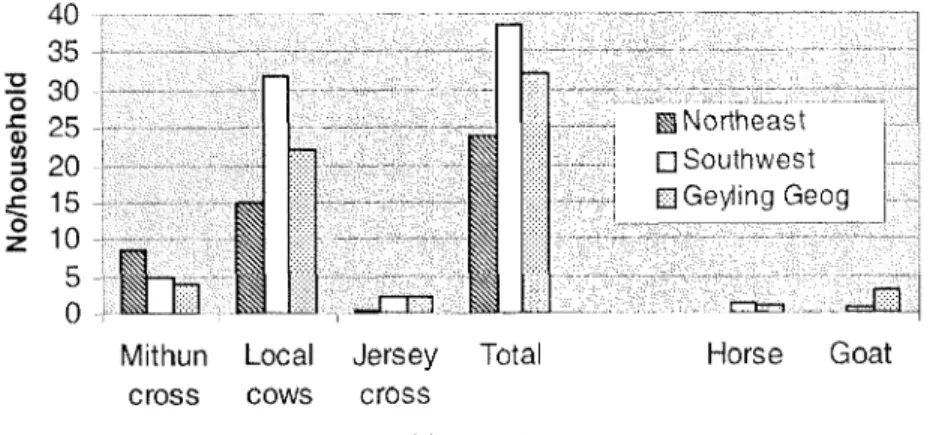
This was clearly visible on the northeast side (Figure 4.2), where the number of mithun crossings was proportionally higher than on the northeast side. In 1997, a household had an average of 13 dairy cows, which produced 466 scoops of cheese and 29 kg of butter in a month. In 1997, the average ratio between the number of dairy cows and the total number of animals in a herd (per household) was 13:39 on the southwest side, while it was 6:29 on the northeast side (Tables 4.1 and 4.2).
Every year in November, after returning to the study area, they usually start to graze the Tsamdrog located at the lower elevation and move uphill. In the first days of their stay, the cattle are left for a short time. They were surrounded in the evening and. People's opinion if the number of cattle in their herds was increasing. Shepherds from six families thought that the number of their cattle was constantly increasing. Unreality. the number of livestock is not decreasing, but the head of the family of the old domestic senses is reduced in his grass some animals that are fed in the new family.
A shepherd said that the number the cattle herd had remained stable over the years. didn't know if their cattle numbers were increasing or decreasing. Herdsmen's reluctance to declare their cattle numbers may be due to tax implications, astax is based. on the number of head of cattle, is due to their fear that they may be asked to kill theirs.
- Tsamdrogs and grazing practices
- Perceptions of forest management
- A strategy of broadleaf forest grazing management
- Principles
- Improvement of forage resources
- Regulating grazing in Tsamdrogs and forests
- Forest Planning Concept
- Objectives
- DESCRIPTION OF THE DZONGKHAG 1 Map and texts
- Planning methods
- Geog forest planning
- Ohsawa), Laboratory of Ecology, Chiba University,
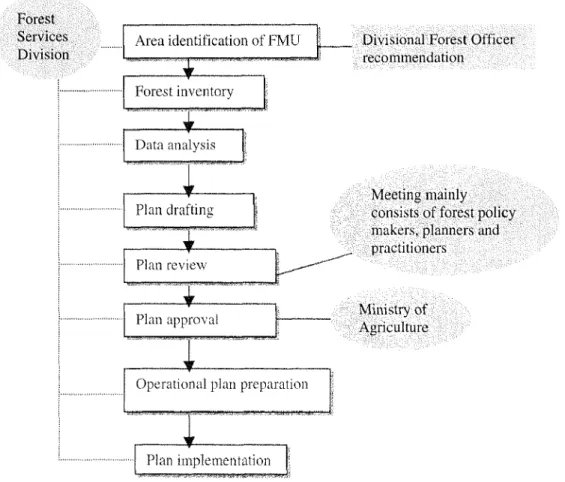
An inventory of all forests in Bhutan was undertaken in the 1970s by the Pre-Invest Survey of Forest Resources (PIS), assisted by the Indian government. The forest areas of Bhutan were assessed using satellite images by Negi (1983) and Gupta (1991) and covered the forests of all. the Dzongkhags. The Dzongkhag Forest Plan will be valid for 20 years, as long as there are no major changes in the basic elements. The management plan will guide various management activities in the forest unit for 10 years. It should be reviewed before the end of the validity period (5 years) if there would be changes in the Dzongkhag forest plan.
Therefore, in FMUs where cattle grazing would be the main forest use, grazing regulations and forage improvement programs will be added to the plan. This strategy will require Tsamdrogs.
Household survey questionnaire
List of fodder trees in the study area
Plant species recorded in the study area
Explanation of the Dzongkha terms for land holding category