What are the implications of the commodity structure of European economies for their exports when faced with Asian competition? Although European imports from and exports to Asian countries currently represent only a relatively small share of total European trade, this share is increasing. Further differentiating the export structure by levels of production (based on broad United Nations economic categories) provides some information on whether or not the economy is more assembly-line and less exploratory.
In addition, special attention is paid to the share of high-tech goods of selected countries. Exports of high-tech products increase more strongly with spillover effects to other sectors of the economy. A look at the development of trade balances completes the picture of which of the discussed European economies have a more favorable medium-term export perspective and which ones have a less favorable one.
Introduction
The development of international trade and the rise of Asian nations
The development of international trade shares
During the same period, the share of developed countries fell to about 65%, 10 percentage points (PP) lower than in 1971. Over this long period, it can be seen that Europe as well as the United States are on a downward trend, although the American share stabilized in the nineties.
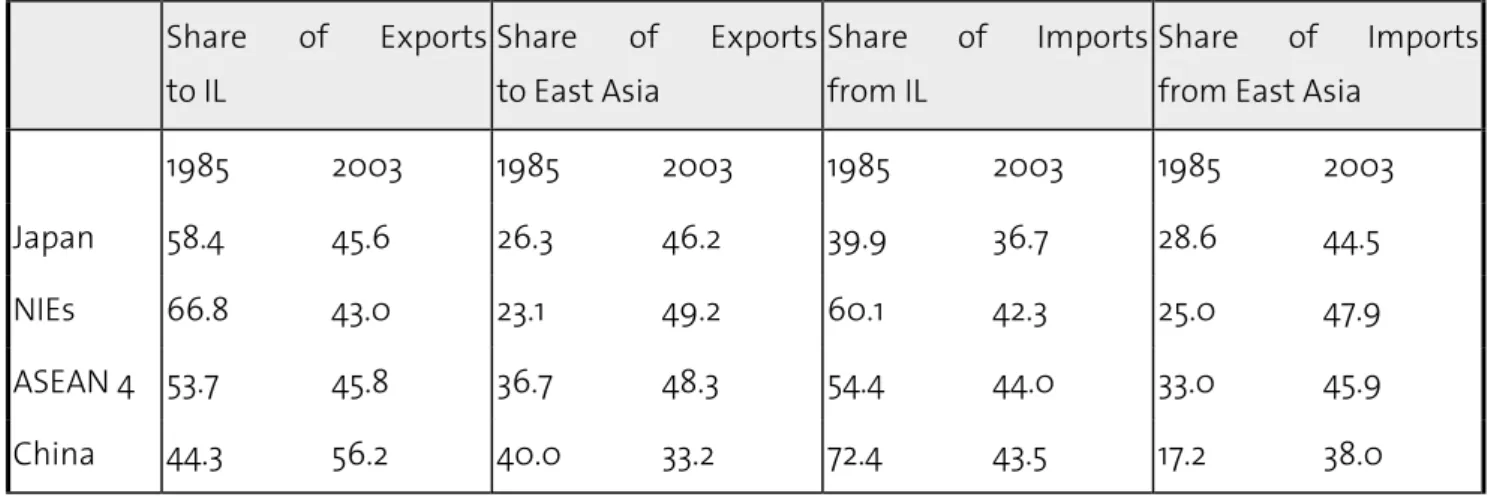
The structure of Asian trade
On the import side, this overall picture varies only slightly, with the main exceptions being that US imports tended to increase and Asia's import capacity was seriously damaged by the 1997/98 currency crisis. The possibility of dividing the production process into separate technological operations depends on the characteristics of the goods in question. Machinery and transport equipment” (Standard International Trade Classification, Rev. 3) in Asian countries are among the highest in the world.
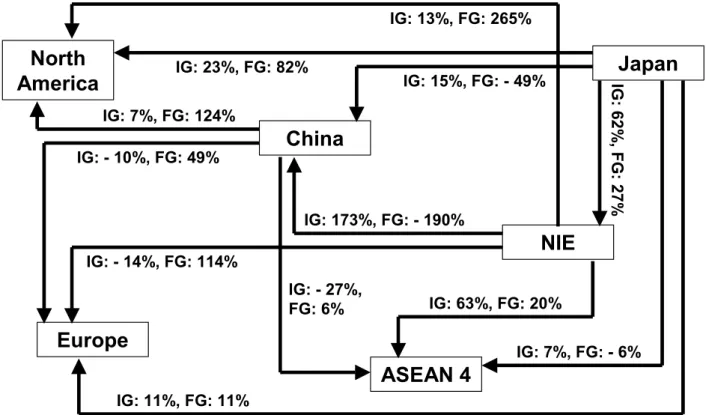
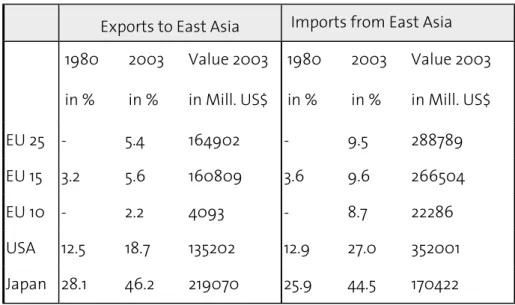
In the same period, export shares to the developed countries decreased to around 45%, again excluding China, whose share is as high as 56%. Intermediate goods are sent to China and ASEAN4 as well as from Japan to the NIEs. Despite these differences in quotas, the absolute value of EU exports to East Asia developed very similarly to that of the US.
State and development of the trade structure in selected countries
Trade structure by industries
- Export and import structure relative to the world (SITC)
- Development from 1992 to 2002 (SITC)
- Export and import structure relative to Southeast Asia (SITC)
On the other hand, the Asian economies (except China and Hong Kong), NEU and USA have a higher share in SITC7 than the European average. On the other hand, Italy's high export share in SITC8 is due to clothing, footwear and furniture. Exceptions on the export side are Ireland and Switzerland, where exports of organic chemicals and pharmaceuticals increased SITC5 market shares by 23 PP and 11 PP, the former mainly at the expense of SITC0 (-16 PP).
On the Asian continent, the rising share of SITC7 was the result of increased trade in office and automatic data processing machines, telecommunications equipment and other electrical appliances. In general, the changes in the import structures reflect the trends on the export side, i.e. All in all, it is noticeable that differences in the trade structure are lower on the export side than on the import side.
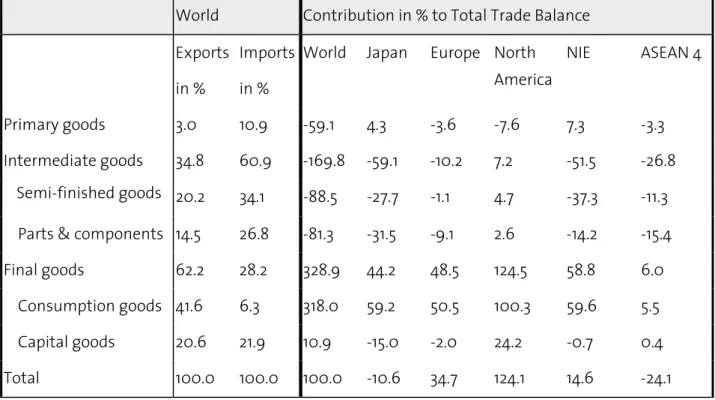
Trade structure by stage of production
- Export and import structure relative to the world (BEC)
- Development from 1992 to 2002 (BEC)
- Export and import structure relative to Southeast Asia (BEC)
Especially in the NEU, the export shares of semi-finished products decreased sharply in favor of parts and components and capital goods. In Europe, the share of imported consumer goods from the JV decreased by 15% on average. On the other hand, parts and components and capital goods from this region have become more important.
These are also the two categories where the export shares of European countries in SeA are above the world average. The same can be said for the import side, although the picture for consumer goods remains somewhat heterogeneous. In Hungary, the Czech Republic and specifically in Ireland, the share of imports of consumer goods is more pronounced in the Sea than in total trade.
The role of future-oriented goods
- The importance of high-tech products
- Limits of the high-tech categories
- Growth dynamics of high-tech goods: Evidence for their importance in foreign trade
- Competition for high-tech goods
- Specialisation in subgroups of high-tech goods
- Conclusion with respect to the importance and the dynamics of high-tech products
Electronics and telecommunications products, the largest subgroup of high-tech products, accounting for 8% of total exports, grew by 6% per year over the same period. But this also applies to Poland, which still has a very small share of high-tech exports in relation to total exports. Due to intensive specialization in computers and office machines, mainland China and Hong Kong have reached a high-tech share of total exports that is the same size as Japan's.
In our country sample, the United States exports almost a quarter of all high-tech exports. After the UK, China is already the fifth largest exporter of high-tech goods, closely followed by Hong Kong, Taiwan and Korea. A country's relative importance within high-tech exports depends – in addition to its economic size and openness, of course – on the share of high-tech exports in total trade.
While the old European Union member states in Central and Northern Europe, as well as Switzerland, have a large share of high-tech exports, these goods account for only a small share of total exports in the southern member states, Italy and Spain (and also Greece, not shown). IT is also the dominant subgroup for the UK and Hungary, both of which have a high-tech share of over 20%. Likewise, all Asian countries have achieved a high-tech share of 20% to 40% in the case of China, due to the computer industry.
The share of high-tech goods in Germany and Italy is significantly reduced due to the fact that the export of cars is not counted in this category, as already mentioned. We did this using average growth rates for 1997 to 2002 and average shares in high technology of the various subgroups. Most of the analyzed countries depend on one or two subgroups of high-tech goods for their overall contribution of high-tech to total export growth.
In many countries, the share of high technology in total exports is around 20% or more and is growing twice as fast as total exports.
Consequences of the goods structure for European countries’s exports
- Export perspectives of European economies facing Asian competition
- Which economies have relatively favourable export perspectives?
- Trade balances
- Structural changes
For example, Malaysia already has a similar share of total exports of parts and components to Japan. Thus, the export perspectives are relatively favorable for those European countries that have a relatively large share of the latter products in total exports. Given the important role of high-tech products in overall economic growth, a country is likely to be better positioned with a large share of these products in total trade.
In some countries of the Sea, the share of high-tech goods is as large as in more developed economies, mainly due to office machinery and telecommunications (SITC75 and 76). As noted in the previous chapter, Asian countries not only export labor-intensive, low-technology goods, but their share of more technology-intensive products in total trade has increased over the past decade—and thus a an increasing number of product categories for the world market are being produced in Det. First, the large share of high-tech products in the total exports of some Asian economies, especially China, may be at least partially misleading.
While labour-intensive production steps are located in low-cost economies, research-intensive steps will be concentrated in more mature economies.8 A relatively larger share of intermediate goods than final. Considering only the trade with SeA, Hungary and Ireland still have a larger share of intermediate goods. At the same time, the high-tech share of these three economies is quite large, especially in the UK.
In terms of NEU, Hungary stands out with a comparable high export share of 20% in "European goods" and a high technology share of 22% – close to the UK's 24%. However, while 16% of total Czech exports are road vehicles and a further 12% high-tech goods, Poland's export industry with a high-tech share of only 5% has the image of not being very technology intensive. Regarding the export of electrical appliances (SITC77), only the Czech Republic, Hungary and Ireland have a somewhat larger share of 10% or slightly higher.
In terms of parts and components, as well as semi-finished products, the Czech Republic, Poland and Ireland – three of the four countries with a relatively large share of intermediate goods in total imports – had a negative trade balance.
Final remarks
These favorable and less favorable export prospects are to a certain extent a mirror image of the ongoing structural adjustment depicted in chapter 3.1, with the shift in relative shares of agriculture, industry and services in national output of European and Asian economies. Finland and Ireland – to name two other examples – with their specialization in telecommunications and office machines as well as paper and pharmaceuticals respectively, also have a relatively high added value in the industrial sector. Ando, Mitsuyo and Fukunari Kimura (2003), "The Formation of International Production and Distribution Networks in East Asia", NBER Working Paper No. 10167.
Gaulier, Guillaume, Françoise Lemoine and Deniz Ünal-Kesenci (2004), “China's Integration into Asian Production Networks and Its Implications”, Paper prepared for the conference “Resolving New Global and Regional Imbalances in an Era of Asian Integration”, Tokyo – 17 -June 18, 2004. Hatzichronoglou, Thomas (1997), “Revision of the High-Technology Sector and Product Classification”, OECD Directorate for Science, Technology and Industry, STI Working Papers, 1997/2. Philippines Japan Singapore Malaysia Korea Taiwan Thailand Hong Kong China Indonesia India Hungary Germany United Kingdom Czech Republic France Finland Ireland Spain Italy Poland Mexico United States Canada Switzerland Brazil Argentina Chile.
France Germany UK Italy Spain Poland Hungary CZE Finland Ireland Switzerland China Hong Kong Taiwan Korea Japan USA 5 Chemicals and related products 6 Manufactured goods 7 Machines and transportation equipment 8 Miscellaneous manufactured articles Sum of remaining goods. Countries' shares in global trade in high-tech goods (within the country sample).
72 Specialized machinery 74 Other industrial machinery and parts 71 Machinery and equipment for the production of electricity 79 Other transport equipment.