735
© Sociologický ústav AV ČR, v. v. i., Praha 2019
Regional Patterns of Social Differentiation in Visegrád Countries*
kAMILA FIALoVá and ToMáš ŽELInSký **
Institute of Sociology of the Czech Academy of Sciences, Czech Republic and
Faculty of Economics, Technical University of Košice, Slovakia Abstract: This paper focuses on a neglected—horizontal—dimension of social stratification. It examines the patterns of social differentiation in the Viseg- rád countries (the Czech Republic, Hungary, Poland, and Slovakia) and at- tempts to assess changes in the social structure at the subnational level. Social structure changes are explained within the context of broader socio-economic development. The main analyses performed in this study are based on EU- SILC micro-data covering 2006–2016 and offer a comprehensive perspective on the patterns of social-stratification development at the regional level utilis- ing three dimensions: social class (proxied by the European Social-Economic Classification), highest attained education level, and income. The results in- dicate different trajectories in social differentiation across the four countries, although some of the patterns identified are similar. The results indicate that the working class is shrinking and the salariat is growing, and that there are declining shares of people with at most primary or secondary education and increasing numbers with tertiary education. Income inequalities remained relatively stable over the observed period across the Czech and Slovak re- gions, but fluctuated in Hungarian regions, and the initially greater income inequalities in Polish regions have tended to decline over time. The findings suggest that the least favourable patterns in the development of regional so- cial differentiation are found in the Hungarian regions.
keywords: social stratification, social class, income, education, regions, Viseg- rad countries
Sociologický časopis/Czech Sociological Review, 2019, Vol . 55, No . 6: 735–789 https://doi .org/10 .13060/00380288 .2020 .55 .6 .491
* This work was supported by Czech Science Foundation under grant no. 18-09220S
‘Social Stratification in the Czech Republic and Central Europe: 1968–2018’. The EU-SILC datasets were made available on the basis of Contract No. 265/14 between the European Commission, Eurostat, and the Institute of Sociology, Czech Academy of Sciences. The responsibility for all conclusions drawn from the data lies entirely with the authors. No potential conflict of interest was reported by the authors.
** Direct all correspondence to: Kamila Fialová, Institute of Sociology, Czech Academy of Sciences, Jilská 1, 110 00 Prague 1, Czech Republic, e-mail: kamila.fialova@soc.cas.cz.
Sociologický časopis/Czech Sociological Review, 2019, Vol. 55, No. 6
736
Introduction
The social structures and stratification of the societies of the Visegrád countries have undergone rapid changes since 1989, as the transformation from a com- munist regime to a democratic market-oriented society brought major changes to their class structures and social stratification. Their subsequent accession to numerous international organisations, in particular the European Union in 2004, affected these societies in distinct ways. A large amount of research on social strat- ification targeting these countries has been undertaken, with most studies focus- ing on the vertical dimension of the phenomenon [on the Visegrád countries, see, e.g., Bunčák and Harmadyová 1993; Machonin and Tuček 1994; Wasilewski 1995;
Townsley and Eyal 1995; Domański 1996, 2005; Róna-Tas, Bunčák and Harmady- ová 1999; Sopóci 2000; Róbert and Bukodi 2004; Katrňák and Fučík 2010; Katrňák and Fónadová 2014; Bunčák et al. 2016; Albert et al. 2018; Džambazovič and Ger- bery 2018; Tomescu-Dubrow et al. 2018]. Vertical stratification expressed via class relationships differentially affects the opportunities and outlooks of individuals, shapes their material interests, and influences their possession of economic assets.
Horizontal stratification, often operationalised by regional or, more gener- ally, spatial disparities, has mainly been studied from an economic or socio-ge- ographic perspective and is well-documented in previous research [Traistaru et al. 2003; Förster et al. 2003; Ezcurra et al. 2007; Blažek and Csank 2007; Gorzelak and Smetkowski 2010; Monastiriotis 2011; Blažek and Netrdová 2012, Smetkowski and Wójcik 2012]. Generally, the literature shows that a regional convergence has been occurring at the national level in Central and Eastern European (CEE) coun- tries, while polarisation has been observed at the regional level within countries, mainly as a result of dynamic growth of capital regions.
To some extent, the horizontal dimension of social differentiation has also attracted attention from sociological researchers—such as Podolák and Michálek [2008], Gajdoš [2005, 2008], and Gajdoš and Pašiak [2006] on Slovakia; Hampl [2007] on the Czech Republic; or Szirmai [2015] on Hungary. In this study, we seek to contribute to the existing literature by focusing on this neglected dimen- sion of social stratification in four CEE countries: the Czech Republic, Hungary, Poland, and Slovakia—the Visegrád 4 (V4). We present an analysis of the hori- zontal patterns of social stratification across and within regions and offer a com- parative perspective over the time since EU accession. The approach we apply is not entirely ‘horizontal’, as our aim is to focus on social classes and particularly their distribution across space. For clarity, we will use the term ‘social differentia- tion’, which we believe is a broader concept, while focusing on its horizontal as- pects. This approach thus addresses vertical social stratification and, at the same time, takes into account the horizontal aspects of its structure.
Joining the European Union resulted in significant changes in CEE societies accompanied by increases in regional economic disparities. In addition to boost- ing overall economic growth by enabling the free movement of capital, people, goods, and services, EU accession also brought full access to structural funds.
Articles
737
Large financial flows within the European Cohesion Policy that were intended for investment into regional development, the improvement of competitiveness, and increasing employment may also have had significant effects on regional social disparities.1 Consequently, our study indirectly sheds some light on the effects of EU membership on social differentiation within the Visegrád region.
As the starting point of our analyses, we first present the changes in social differentiation at the regional level during the period 2000–2016 using aggregate NUTS-1/NUTS-2 level data. We primarily aim to investigate changes in both the horizontal and vertical patterns in social stratification in the Visegrád countries with a focus on the macro-economic context of this development. Unlike similar studies, not only do we concentrate on differences between regions, but our fo- cus reaches higher and seeks to analyse the development of social and economic stratification within regions. Therefore, the main analyses performed in this study are based on EU-SILC micro-data covering 2006–2016 and offer a comprehensive perspective of the patterns of social stratification development in V4 countries.
We analyse social differentiation under the following three dimensions: class po- sition (proxied by the European Socio-economic Classification), highest attained level of education, and income. We examine social stratification developments for various subpopulations using the regional classification on the NUTS-2 and NUTS-1 level (based on available data) and the degree of urbanisation. Ultimate- ly, we relate our results to macro-economic development in the period.
Our aim is to analyse the development of regional social differentiation in a comparative perspective across the V4 countries, and this is one of only few attempts to do so. Our analyses are primarily descriptive. We do not study the factors of stratification in detail, nor do we address the broader contexts, as this would substantially exceed the scope of a journal article. Our primary aim is to offer a descriptive study of the patterns of social differentiation in four post- communist countries over a decade.
Our results reveal different patterns of social differentiation across the four countries, although some of the patterns are similar. In general, we find a trend towards a decreasing proportions of the working-class population across all the regions and increases in the numbers of the salariat. These changes to some ex- tent reflect changes in regional economic structures. All the regions exhibit a de- cline in the share of adults who only have primary or secondary education and an increase in those with tertiary education. The Hungarian regions exhibit the slowest growth rates in the number of adults with tertiary education. At the same time, the Hungarian regions have experienced increases in income inequalities measured using the Gini coefficient. Our results thus suggest that the least fa- vourable patterns in the development of horizontal social differentiation are in the Hungarian regions.
1 For an overview of the impact of European Cohesion Policy, see, e.g., Fratesi and Wish- lade [2017].
Sociologický časopis/Czech Sociological Review, 2019, Vol. 55, No. 6
738
A brief review of the relevant literature
Regional disparities within individual countries in the EU are often larger than the disparities between countries.2 Ascani, Crescenzi and Iammarino [2012] con- nect regional inequalities in economic development to the localised nature of de- velopment processes and innovative activities and stress the relevance of such dis- parities in the case of emerging countries. Globalisation has eroded regional dif- ferences through the international reach of its technological and socio-economic forces. Some authors even refer to the globalised world as a ‘flat world’ [Friedman 2005] and employ concepts such as the ‘end of geography’ [O’Brien 1992] and the
‘death of distance’ [Cairncross 1997]. Such views are in contrast with a large body of literature, both theoretical and empirical, in the fields of economic geography, internal business studies, and institutional and evolutionary economics. All these disciplines stress the importance of local actors and regional forces in determin- ing regional development [for an overview, see Ascani et al. 2012].
Regional differentiation tends to follow a pro-cyclical pattern, although the relationship became less straightforward after the recession of 2008–2009 [Onof- rei and Cigu 2017]. In the EU, several studies have shown that, while prosperous regions tend to experience steady growth, poor regions more often lag behind [Canova and Marcet 1995; Magrini 1999, 2004; Cheshire and Magrini 2000]. CEE countries exhibited strong regional polarisation of income and overall economic development after their EU accession [Monastiriotis 2011]. Major urban agglom- erations and regions bordering ‘older’ EU member countries have mostly benefit- ted during the process of transition and integration to the EU, while the major- ity of residual regions have declined [Petrakos 1996, 2000; Traistaru et al. 2003].
Alcidi et al. [2018] show that, since 2000, all CEE countries have registered faster growth of GDP per capita than the EU average. At the same time, the region has exhibited increasing regional differentiation within individual countries. While the capital regions (as outliers) have shown outstanding economic performance and improved their relative positions, other regions have experienced a further deterioration in their relative positions. Hampl [2007] concludes that the trans- formation process brought about greater inequalities in both regional and social differentiation in the Czech Republic and also points to greater regional inequal- ity in the distribution of economic activities compared to social distribution. At the same time, social differentiation tends to show more variability than does regional differentiation, and the relationship between the two types of differen- tiation grew weaker during the transformation process.
Previous research on vertical social stratification identified significant changes that occurred in the Visegrád region after the fall of the communist re-
2 The coefficient of variation of GDP per capita in PPS across EU member states gradually fell from 52% in 2000 to 41% in 2017. Source: Eurostat (2018) Datafile: Main GDP aggregates per capita [nama_10_pc].
Articles
739
gimes, with many trends lasting into our research period.3 In the Czech Republic, household income differentiation rose during the 1990s and stabilised thereafter [Večerník and Mysíková 2017]. Katrňák and Fónadová [2014] further describe the re-stratification of Czech society after 1989 with a fall in social fluidity, i.e. the period of the ‘return to social origins’ in the first decade of economic transfor- mation and the reverse trend of increased social fluidity, i.e. the period of the
‘departure from social origins’ in connection with the educational expansion and cohort replacement that occurred after 2000. Social stratification in Hungary was recently studied by Albert et al. [2018], who describe Hungarian society as quite hierarchical and yet fragmented within the upper and lower strata; the upper and lower strata being clearly divided in terms of the vertical and non-vertical aspects of social stratification. Income inequalities in Hungary increased substantially during the 1990s, mainly due to labour market changes [OECD 2008]. As further suggested by Szikra [2018], social inequalities increased in response to reforms to the social policy systems implemented by the government of Viktor Orbán after 2010. The social stratification of Polish society also demonstrated a clear and unambiguous tendency towards growing inequality and considerable class dif- ferences with increasing returns to education, skills, and organisational assets [Tomescu-Dubrow and Słomczynski 2018]. At the same time, the research shows that barriers to mobility have not become more rigid and social origins do not affect educational achievements significantly more [Domański 2005]. Brzeziński [2017] shows that income inequality is relatively high in Poland but has not in- creased in recent years. The existing income disparities are primarily caused by considerable wage dispersion and the segmentation of the labour market. In Slo- vakia, the slope of the social stratification structure has registered a tendency to flatten in recent decades. This trend is accompanied by increasing social class dif- ferentiation resulting from the growth of the intermediate class, while the lowest class (unskilled workers) remained stable. At the same time, a significant share of the population achieved some degree of social advancement [Bunčák et al. 2016].
The importance of studying social stratification in the Visegrad region is supported by numerous recent studies published by Czech [Lux, Sunega and Katrňák 2013; Katrňák and Fónadová 2014; Drahokoupil 2015; Špaček 2016], Hun- garian [Albert et al. 2018; Kmetty et al. 2018], Polish [Zarycki 2015; Domański 2017; Titarenko 2019], and Slovak [Bunčák, Hrabovská and Sopóci 2018a, 2018b, 2019; Džambazovič, Gerbery and Sopóci 2018; Sopóci et al. 2019] scholars. While these studies focus primarily on single countries, we contribute to the existing literature by describing the trend in social differentiation across all four Visegrád countries.
3 The different starting positions of countries after the transition have also been reflected in different trajectories of perceptions of individual’s economic situations; see, e.g., a recent study by Mysíková et al. [2019] comparing Czech Republic and Slovakia.
Sociologický časopis/Czech Sociological Review, 2019, Vol. 55, No. 6
740
The methodological background
Social stratification refers to the socio-economic structure of a society and relates to social inequalities resulting from the way society is organised. Social stratifica- tion systems are mostly characterised in terms of discrete socio-economic strata or classes, whose members are endowed with similar resources [Grusky 2001:
14443]. There are many types of assets, resources, and other factors underlying stratification systems. As a result, a wide variety of measures has been used to describe the stratification of a society. Among many individual economic, social, cultural, or other factors, income is the most commonly used variable to describe social stratification [Grusky and Takata 1992]. Nevertheless, income, despite its importance, cannot be regarded as the only (or best) indicator to capture the true nature of social stratification. For instance, one should take into account the dif- ferences between the welfarist and non-welfarist approaches to the operationali- sation of individual well-being [Želinský 2014]; suggesting that, for instance, a high income level does not necessarily imply consumption patterns typical of a
‘higher’ class consumer. In addition, income represents a flow variable, whereas social status is, to a great extent, captured by accumulated wealth, which is a stock variable. We are aware of these drawbacks attached to the income indicator;
nonetheless, the limited availability of wealth data does not allow us to incorpo- rate wealth data into our calculations.
Further, the stratification of a society is a multidimensional phenomenon [Kerbo 2017], and we believe that, in order to capture it, additional indicators should be taken into account. As previous research suggests [see, e.g., Hatt 1950;
Warren and Hauser 1997], educational attainment and social classes based on oc- cupations are also relevant and are frequently used indicators for such purposes.
Education is considered an important factor in determining the socio- economic position of individuals (for an overview on the role of education as a social stratifier see, e.g., Husén [1987]). Education exerts a strong effect on a wide range of attitudes [Kalmijn and Kraaykamp 2007] and directly affects the employment prospects and income of individuals. Nevertheless, we are aware of the shortcomings related to assessing educational outcomes solely on the basis of educational attainment. Such an approach, for instance, ignores the dimension of the quality of the education and the related phenomenon of ‘credential inflation’
(see, e.g., the discussions in Van de Werfhorst and Andersen [2005] and Jewell, McPherson and Tieslau [2013]) among members of a society, and at the same time it ignores differences between countries. Moreover, the current data suggest that the policies aimed at promoting education adopted by the majority of CEE countries after the transition resulted in the proportion of 25-34-year-old adults with at least secondary educational rising to more than 90%. Further, taking de- mographic developments and the fact that a remarkably high proportion of sec- ondary school graduates continue their studies at a university into account, a not insignificant proportion of university graduates accept jobs for which they are over-educated [Ortiz Gervasi and McGuinness 2018; Muñoz de Bustillo Llorente
Articles
741
et al. 2018] or are unable to find a job at all. Consequently, how well educational attainment serves as a proxy for social stratification in the region in the future is questionable, particularly in the case of ‘Generation Z’ onwards.
The use of synthesising approaches comprising a wider range of factors also has a long tradition in social stratification research. Many of the assets underlying social stratification systems are allocated through jobs and occupational position.
The occupational structure may therefore be considered the main foundation of the stratification system in a society [Blau and Duncan 1967]. We believe that, for the purpose of assessing social differentiation, a classification of society using this approach is essential, as social classes also reflect income and educational attainment. For that reason, we base our main analyses on this approach. None- theless, numerous occupation-based social classifications have been proposed for sociological research, each of which has advantages and disadvantages [see, e.g., Lambert and Bihagen 2014]. We use a socio-economic classification, in which employment relations and occupational position in the labour market are consid- ered the main drivers of social inequalities.
Our approach builds on the European Socio-economic Classification (ESeC) [Harrison and Rose 2006], a categorical class schema that is harmonised to enable comparative analyses across European societies and is designed to reflect quali- tative differences in employment relationships (the ESeC is described in detail in Annex 1). Basically, ESeC defines ten social classes that are not consistently in a hierarchical order, but in this schema classes 1 and 2 (the salariat class) nev- ertheless have advantages over classes 3, 6, 7, 8, and 9. The advantages relate to the assumption that members of the salariat class have greater long-term income security, are less likely to be made redundant, experience less short-term fluctua- tion of income since they are not dependent on overtime pay, and generally have better prospects of seeing their income rise over the course of their working lives [Rose and Harrison 2007; see also Goldthorpe and McKnight 2006]. The ten-class model may be reduced to a nine-, six-, five-, or three-class version [for details, see Rose and Harrison 2007]. Each stage of such reductions maintains the basic divi- sion between forms of employment regulation. In this study, we mainly rely on a three-class model which combines classes 1 and 2 into a single ‘salariat’ class, classes 3, 4, 5, and 6 into a single class termed ‘intermediate’, and classes 7, 8, and 9 into a single class called ‘workers’. As other scholars have suggested, collaps- ing the ten-class model into a three-class model results in not operationalising the ‘never worked and long-term unemployed’ in class 10 [Rose, Harrison and Pevalin 2010], and as Džambazovič and Gerbery [2018] have argued further, the tenth class of the ‘excluded’ does not necessarily have to be included in the ESeC model. Nevertheless, for the sake of completeness, we also briefly present the main patterns in the development of the ‘excluded’ tenth class. In our analyses, social stratification is based on the ESeC classification using an algorithm created by Herter and Wirth [2018].
Sociologický časopis/Czech Sociological Review, 2019, Vol. 55, No. 6
742
ESeC is commonly used in social stratification research4 and we believe that, together with the variables relating to income and education level, these three dimensions offer a comprehensive perspective on the patterns of the develop- ment of socio-economic differentiation among the post-communist societies of the Visegrád region. We believe that for the purposes of this descriptive study, this approach offers a perspective on the development of the social structure of society. On the other hand, our simple approach neglects numerous dimensions of social stratification, and in addition to basic socio-economic variables, the so- cial structure can also be expressed in terms of characteristics such as gender or ethnicity, which are also ignored in the present study. We are aware of these drawbacks; however, our aim is to present the development of social structure and social differentiation in the V4 countries after they joined the European Un- ion. Ultimately, in order to ensure comparability with previous and potential fu- ture studies of a similar nature, we focus on the standard variables used most often by other scholars.
We build our study on the three major concepts described above. We op- erationalise social classes in terms of socio-economic classification (ESeC); the income stratification of society is captured by a simple measure of income in- equality—the Gini coefficient; and educational differentiation is assessed by clas- sifying the populations into three groups reflecting the highest attained level of education: primary education (ISCED 0–2); secondary education (ISCED 3–4);
and tertiary education (ISCED 5–8). The main analyses performed in this study are based on EU-SILC 2006–2016 (Cross UDB Version September 2018).
Adopting the Eurostat classification of urbanisation levels, we distinguish between three types of areas: cities (densely populated areas: at least 50% of the V4 population lives in urban centres); towns and suburbs (intermediate density areas: less than 50% of the population lives in rural grid cells and less than 50%
lives in urban centres); rural areas (thinly populated areas: more than 50% of the population lives in rural grid cells).
For the subnational level, we are limited to using regional units at the levels for which Eurostat data are available. As NUTS-1 levels in the Czech Republic and Slovakia are equivalent to the NUTS-0 (national) level, the subnational level of these two countries is represented by NUTS-2, while Poland and Hungary also use the NUTS-1 level in the division of their countries. Poland and Hungary do not provide EU-SILC data at a subnational level lower than NUTS-1. Conse-
4 Use of the ESeC scheme has recently become quite common in social research [e.g.
Brooks and Svallfors 2010; Bihagen 2008]. It has been shown to have a criterion validity even in the specific case of the Czech Republic and a significant association with many major outcomes [Katrňák 2012]. Katrňák [2012] concluded that for the Czech Republic, the ESeC scheme offers a suitable conceptualisation of current social classes. Similar results were obtained by Bunčák, Hrabovská and Sopóci [2018b], who assessed the criterion valid- ity of the EGP, ESeC, and ESeG class schemes for Slovak society.
Articles
743
quently, the lowest available subnational level in all four countries corresponds to NUTS levels that differ from the national level. We are aware of the concerns con- nected with these limitations, but at the same time we believe that, considering the data that are available, our approach is the best option. The details on NUTS classifications and the sizes of regions analysed are described in Annex 2.
According to the EU-SILC framework regulation, EU-SILC data are repre- sentative at the national level. Our aim is to assess social differentiation develop- ments for various subpopulations, and we are aware that point estimates can to some extent be influenced by changes in samples and can be sensitive to a small number of influential observations due to the relatively small subsample sizes.
For that reason, we smooth the data with moving averages (of length 3), which, however, results in a loss of the first (2006) and last (2016) values. We believe that this approach provides a better representation of reality, as it reduces unexplain- able fluctuations in the data.
Macro-economic development and regional differentiation
This section presents the socio-economic background necessary for the subse- quent analyses of social differentiation by describing the macro-economic devel- opments in the V4 countries and their regional economic differentiation drawn from aggregate data.
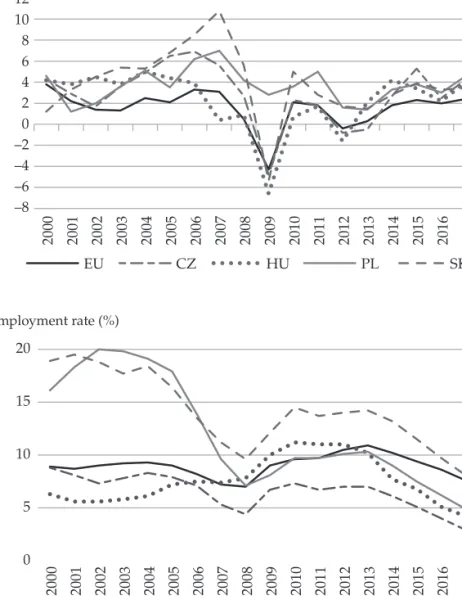
The Visegrád region has exhibited solid economic growth since the early 2000s, which accelerated after EU accession in 2004 (see Figure 1, panel a; for more details, see, e.g., Klimko [2015], Szotowski [2015], and OECD [2014a–d, 2016, 2017, 2018a–b]). With the exception of 2008–2012 (the financial crisis and the years that followed), the V4 countries generally outperformed average EU economic growth. Before 2008, the strongest economic growth was reported in Slovakia (SK), where it reached an average annual rate of real GDP growth of 5.7% in 2000–2007. It was followed by the Czech Republic (CZ; 4.6%), Poland (PL; 4.2%), and Hungary (HU; 3.8%). The economic crisis resulted in falling output in all V4 countries but Poland, which resisted mainly due to its larger economy and ro- bust domestic demand, stable financial system, and depreciation of the national currency. In Slovakia, the downturn was deep but short, with economic perfor- mance returning swiftly to its prior strength. The Czech Republic registered an economic recession in 2009 and again in 2012–2013, partly as a result of fiscal austerity measures. Hungary witnessed a serious economic slowdown as early as 2007 and did not return to solid economic growth levels until 2013. Early on, its unfavourable economic development was influenced by fiscal austerity measures introduced in 2006 in an aim to reduce the budget deficit. The financial crisis of 2008–2009 hit Hungary hardest among the V4 countries, and adverse economic developments forced it to agree to an IMF loan in 2008. Overall, in 2009–2017, Hungary recorded the weakest economic growth among the V4 countries, while
Sociologický časopis/Czech Sociological Review, 2019, Vol. 55, No. 6
744
Figure 1. Economic growth and unemployment in Visegrád countries, 2000–2017 a) Real GDP growth, % year on year
Source: Eurostat (2018). Datafile: GDP and main components [nama_10_gdp] and Unemployment by sex and age–annual average [une_rt_a].
-2017 Figure 1. Economic growth and unemployment in Visegrad countries, 2000-2017
a) Real GDP growth, % y/y b) Unemployment rate, %
Figure 1. Economic growth and unemployment in Visegrad countries, 2000 -2017
a) Real GDP growth, % y/y b) Unemployment rate, %
–8 –6 –4 –2 0 2 4 6 8 10 12
2000 2001 2002 2003 2004 2005 2006 2007 2008 2009 2010 2011 2012 2013 2014 2015 2016 2017
EU CZ HU PL SK
0 5 10 15 20
2000 2001 2002 2003 2004 2005 2006 2007 2008 2009 2010 2011 2012 2013 2014 2015 2016 2017
EU CZ HU PL SK
b) Unemployment rate (%)
-2017 Figure 1. Economic growth and unemployment in Visegrad countries, 2000-2017
a) Real GDP growth, % y/y b) Unemployment rate, %
Figure 1. Economic growth and unemployment in Visegrad countries, 2000 -2017
a) Real GDP growth, % y/y b) Unemployment rate, %
–8 –6 –4 –2 0 2 4 6 8 10 12
2000 2001 2002 2003 2004 2005 2006 2007 2008 2009 2010 2011 2012 2013 2014 2015 2016 2017
EU CZ HU PL SK
0 5 10 15 20
2000 2001 2002 2003 2004 2005 2006 2007 2008 2009 2010 2011 2012 2013 2014 2015 2016 2017
EU CZ HU PL SK
Articles
745
Poland enjoyed the most stable and strongest economic performance, with an average annual real GDP growth rate of 3.2% (followed by SK with 2.1%, CZ with 1.4%, and HU with 1.1%).
Since the regional labour market situation significantly impacts the eco- nomic well-being of regional residents, including their incomes and employment prospects, we also try to shed some light on developments in unemployment in the V4 countries and their regions. Trends in unemployment largely reflect the trends in economic output (Figure 1, Panel b). Unemployment rates were very high in Poland and Slovakia in the early 2000s (though below 20%). While Po- land was able to reduce its unemployment rate from 20% to 5% between 2002 and 2017, Slovakia remained a high-level unemployment country even in the period when it experienced solid economic growth after 2014. Despite several structural issues, the labour market in the Czech Republic shows relatively stable develop- ment, with unemployment at very low levels compared to other V4 countries and the EU average. Hungary recorded very low unemployment at the beginning of the period, but adverse economic circumstances resulted in substantial rises in un- employment after 2008 followed by a decline to below the EU average after 2013.
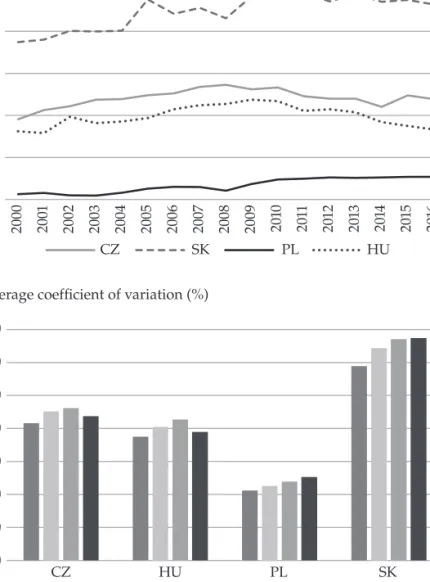
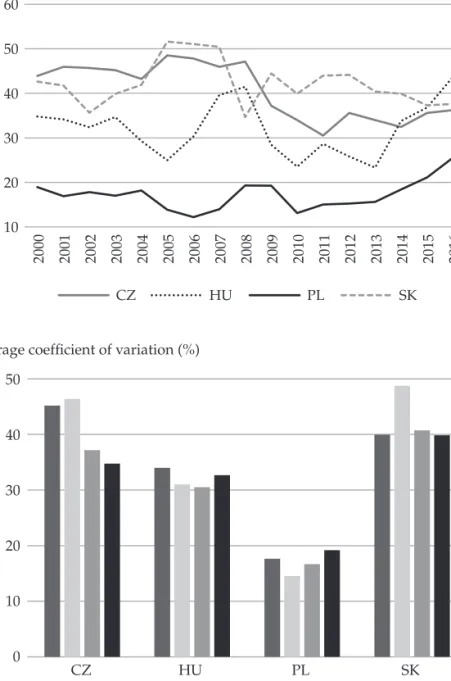
The macro-economic trends described above influenced the development of regional differences across the period. To describe the regional economic dif- ferentiation at the aggregate level we use the GDP per capita indicator.5 The level of internal regional disparities vary somewhat from one Visegrád country to the next (see Figure 2). Slovakia has the highest regional differentiation in econom- ic development as measured by GDP per capita, with the variation coefficient approaching 70% and a clear upward dynamic over the period. It is clear that regional differences in Slovakia rose substantially after 2004. The subsequent pe- riod of economic growth did not temper this, and regional disparities remained at a high level. A similar pattern of steadily increasing disparity across regions occurred in Poland, where, however, the degree of regional economic differentia- tion remained very low, with a variation coefficient in regional GDP per capita of well below 30%. Hungary and the Czech Republic show moderate levels of re- gional differentiation (a variation coefficient around 40%) with visible growth in regional economic disparities after EU accession and during the economic down- turn. Disparities declined somewhat after 2010, despite the economic recession in the Czech Republic and Hungary in 2012–2013; the decline in Hungary was much more pronounced. The correlation between the national real GDP growth rate and the coefficient of variation in regional GDP per capita in 2000–2016 was statis- tically significant, negative and rather strong only in Hungary, where it reached ρ = –0.69. Thus, regional economic disparities in Hungary tended to increase dur-
5 GDP per capita is often used in literature as a proxy for overall living standard and level of economic development [see e.g. Monastiriotis 2011; Smetkowski and Wójcik 2012; Ono- frei and Cigu 2017].
Sociologický časopis/Czech Sociological Review, 2019, Vol. 55, No. 6
746
Figure 2. Regional variation in GDP p.c. (nuTS-2) in Visegrád countries, 2000–2016 Panel A. Yearly coefficient of variation (%)
Source: Authors’ computations. Eurostat (2018). Datafile: Gross domestic product (GDP) at current market prices by NUTS 2 regions [nama_10r_2gdp].
Fig . 2 : Regional variation in GDP p .c . (NUTS -2) in Visegrad countries, 2000 -2016 Panel A. Yearly coefficient of variation (%) Panel B. Average coefficient of variation (%)
70 60 50 40 30 20
CZ SK PL HU
2000 2001 2002 2003 2004 2005 2006 2007 2008 2009 2010 2011 2012 2013 2014 2015 2016
70 60 50 40 30 20 10
0 CZ HU PL SK
2000–2003 2004–2007 2008–2011 2012–2016
Panel B. Average coefficient of variation (%)
Fig . 2 : Regional variation in GDP p .c . (NUTS -2) in Visegrad countries, 2000 -2016 Panel A. Yearly coefficient of variation (%) Panel B. Average coefficient of variation (%)
70 60 50 40 30 20
CZ SK PL HU
2000 2001 2002 2003 2004 2005 2006 2007 2008 2009 2010 2011 2012 2013 2014 2015 2016
70 60 50 40 30 20 10
0 CZ HU PL SK
2000–2003 2004–2007 2008–2011 2012–2016
Articles
747
ing economic downturns and decrease when the economy improved. In other V4 countries, the relationship was also negative, but at a weak magnitude, and was statistically insignificant.
Regional differentiation in unemployment rates showed much more fluctu- ation, with large differences between the V4 countries in the period prior to 2008 (see Figure A1 in the Appendix). The Czech Republic and Slovakia had the great- est regional labour market disparities and Poland had the smallest disparities across regions. In the subsequent period, the Czech Republic and Slovakia expe- rienced substantial declines in regional differentiation while Poland’s increased.
Regional unemployment rate differences in Hungary hovered around 30%
with no clear trend. The relationship between regional unemployment dispari- ties and economic growth was statistically significant only in the Czech Repub- lic, where the correlation reached ρ = 0.53, indicating that regional differences tended to grow during economic booms and vice versa. We can speculate that some Czech regions tend to profit from the economic growth relatively more than others, which may be a result of structural problems that the Czech labour market faces [see also OECD 2014a and 2018a].
Vertical stratification and socio-economic development
After presenting an overview of the macro-economic development of V4 coun- tries based on aggregated data, this section describes the trends in regional differ- ences in the structure of the economic sector, household income, the educational structures, and degrees of urbanisation between 2007 and 2015 using EU-SILC micro-data. We also shed some light on basic trends in vertical social stratification from the perspective of major indicators at the national level.
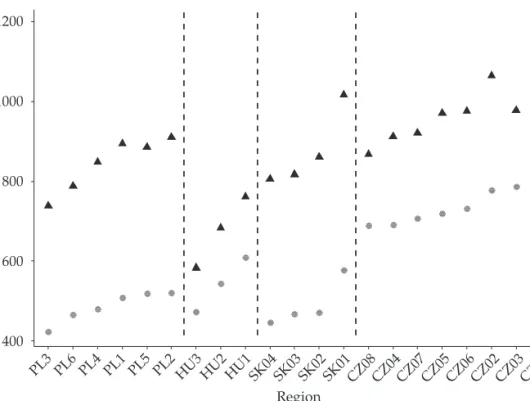
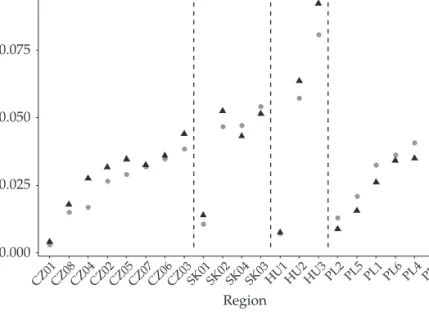
Variations in regional median equivalised household income (PPS EUR) in Visegrád regions decreased considerably between 2007 and 2015 (Figure 3). While the absolute range of the indicator rose from [424; 926] to [583; 1191] EUR per month across all regions, the coefficient of variation decreased from 0.24 to 0.15.
In the same time period, Slovakia and Poland experienced considerably greater nominal increases in household income (between 70% and 82%) than the Czech Republic and Hungary (between 23% and 37%). The relative range increased slightly in the Czech Republic (34% in 2007 and 37% in 2015) and Hungary (29%
and 31%), remained stable in Poland (at 23%), and slightly decreased in Slovakia (30% and 26%).
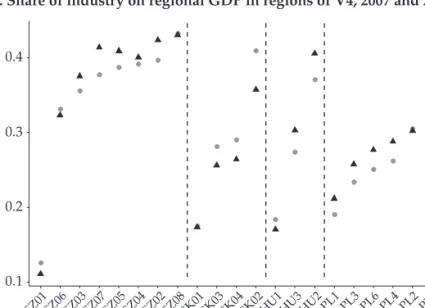
Concerning the economic structure (Figures A2 and A3 in the Appendix), between 2007 and 2015, the share of agriculture in gross value added (GVA) slightly increased in the regions of the Czech Republic and Hungary, while it de- creased across the Polish regions. The greatest variation is reported in Hungary, where the HU3 (Great Plain and North) region has the highest share of agricul- ture, which increased by 14% between 2007 and 2015. The share of industry in
Sociologický časopis/Czech Sociological Review, 2019, Vol. 55, No. 6
748
regional GDP ranged between 23% and 43% in 2007 and 26% and 43% in 2015 (however, when taking into account the capital regions, the lower bound of the share drops to 13% and 11%, respectively). While in most regions, the share of GDP generated by industry increased between 2007 and 2015, it decreased in the Slovak regions, where the biggest decrease is reported in Western Slovakia (fall- ing from 41% to 36%).
To a certain extent, the changes in the economic structure of employment may also have been influenced by the inflow of foreign direct investment (FDI) to the V4 countries. The total inflow of FDI in 2000–2016 was highest in Poland (187 billion USD), followed by the Czech Republic (99 billion USD), while it was lower in Hungary (56 billion USD) and Slovakia (43 billion USD).6 The annual
6 However, when we express the absolute values of FDI inflows in relative terms, the relative values range from almost 5000 USD per capita in Poland to above 9500 USD per capita in the Czech Republic.
Figure 3. Median equivalised household income (PPS EuR)
Source: EU-SILC 2006–2016; authors’ computations.
Fig. 3 : Median e quivalised household income (PPS EUR)
400 600 800 1000 1200
PL3 PL6 PL4 PL1 PL5 PL2 HU3 HU2 HU1 SK04SK03SK02SK01CZ08CZ04CZ07CZ05CZ06CZ02CZ03CZ01 Region
EUR/month
Year: 2007 2015
Articles
749
trends of FDI inflow are depicted in Figure A4 in the Appendix. The trends were somewhat uneven in Hungary and Slovakia, but they were generally decreasing throughout the observed period. In contrast, FDI inflow generally increased in Poland.
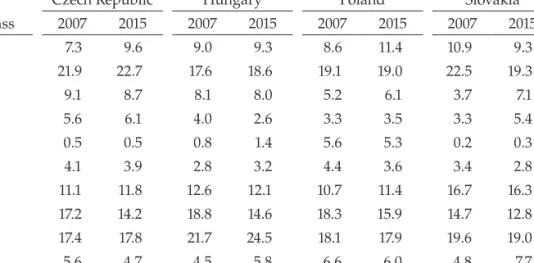
Changes in the social stratification of the Czech Republic, Hungary, Poland, and Slovakia between 2007 and 2015 using the ten-class European Socio-econom- ic Classification (ESeC) are reported in Table A1 in the Appendix. As the data suggest, the salariat (classes 1 and 2) and workers (classes 7, 8, and 9) account for more than 75% of all social classes across the four countries. Henceforward, we use the three-class version of the ESeC (salariat, intermediate, and workers).
Figure 4. The ESeC in the V4 between 2007 and 2015
25.0 27.0 29.0 31.0 33.0 35.0
2010 2011 2012 2013 2014 2015 a) Salariat
43.0 45.0 47.0 49.0 51.0 53.0 55.0
b) Workers
10.0 12.0 14.0 16.0 18.0 20.0
c) Intermediary
0.400 0.500 0.600 0.700 0.800
d) Salariat/Workers ratio 2007 2008 2009
2010 2011 2012 2013 2014 2015 2007 2008 2009
2010 2011 2012 2013 2014 2015 2007 2008 2009
2010 2011 2012 2013 2014 2015 2007 2008 2009
CZ HU PL SK
c) Intermediate d) Salariat/Workers ratio
Source: EU-SILC 2006–2016; authors’ computations.
a) Salariat b) Workers
25.0 27.0 29.0 31.0 33.0 35.0
2010 2011 2012 2013 2014 2015 a) Salariat
43.0 45.0 47.0 49.0 51.0 53.0 55.0
b) Workers
10.0 12.0 14.0 16.0 18.0 20.0
c) Intermediary
0.400 0.500 0.600 0.700 0.800
d) Salariat/Workers ratio 2007 2008 2009
2010 2011 2012 2013 2014 2015 2007 2008 2009
2010 2011 2012 2013 2014 2015 2007 2008 2009
2010 2011 2012 2013 2014 2015 2007 2008 2009
CZ HU PL SK
Sociologický časopis/Czech Sociological Review, 2019, Vol. 55, No. 6
750
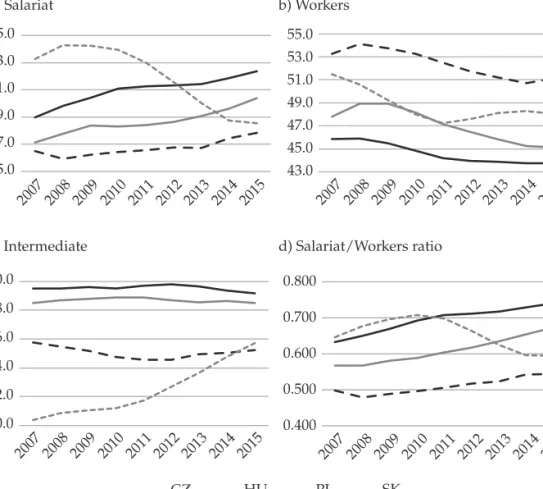
While the Czech Republic, Hungary, and Poland experienced a slight in- crease in the proportion of the salariat in their societies (from 29% in 2007 to 32%
in 2015 in the Czech Republic, from 27% to 28% in Hungary, and from 28% to 30%
in Poland), the salariat in Slovakia slightly decreased between 2007 (33%) and 2015 (29%). As Figure 4b indicates, the trends in working-class size look like a mirror reflection of the trends in the salariat. Nevertheless, all four countries experienced declines in the proportion of workers in their societies between 2007 and 2015. This was associated with the overall decline in employment in agriculture and industry as described in the previous section. These results thus demonstrate how changes in the economic structures were translated into changes in social stratification.
Figure 5. Education levels in the population between 2007 and 2015
Primary (ISCED 0–2) Secondary (ISCED 3–4)
Fig. 5: Development of population related to highest education level
Source: EU-SILC, Author’s computations
Fig. 5: Development of population related to highest education level
Source: EU-SILC, Author’s computations 6.0
8.0 10.0 12.0 14.0 16.0 18.0 20.0 22.0
Primary (ISCED 0-2)
59.061.0 63.065.0 67.069.0 71.073.0 75.077.0
Secondary (ISCED 3-4)
12.0 14.0 16.0 18.0 20.0 22.0 24.0 26.0 28.0
Tertiary (ISCED 5-8)
0.8 1.3 1.8 2.3 2.8 3.3
Tertiary/primary ratio 2010 2011 2012 2013 2014 2015
2007 2008 2009
2010 2011 2012 2013 2014 2015 2007 2008 2009
2010 2011 2012 2013 2014 2015 2007 2008 2009
2010 2011 2012 2013 2014 2015 2007 2008 2009
CZ HU PL SK
Tertiary (ISCED 5) Tertiary/primary ratio
Source: EU-SILC 2006-2016; authors’ computations.
Fig. 5: Development of population related to highest education level
Source: EU-SILC, Author’s computations
Fig. 5: Development of population related to highest education level
Source: EU-SILC, Author’s computations 6.0
8.0 10.0 12.014.0 16.0 18.0 20.0 22.0
Primary (ISCED 0-2)
59.061.0 63.065.0 67.069.0 71.073.0 75.077.0
Secondary (ISCED 3-4)
12.0 14.0 16.0 18.0 20.0 22.0 24.0 26.0 28.0
Tertiary (ISCED 5-8)
0.8 1.3 1.8 2.3 2.8 3.3
Tertiary/primary ratio 2010 2011 2012 2013 2014 2015
2007 2008 2009
2010 2011 2012 2013 2014 2015 2007 2008 2009
2010 2011 2012 2013 2014 2015 2007 2008 2009
2010 2011 2012 2013 2014 2015 2007 2008 2009
CZ HU PL SK
Fig. 5: Development of population related to highest education level
Source: EU-SILC, Author’s computations
Fig. 5: Development of population related to highest education level
Source: EU-SILC, Author’s computations 6.0
8.0 10.0 12.0 14.016.0 18.0 20.0 22.0
Primary (ISCED 0-2)
59.061.0 63.065.0 67.069.0 71.073.0 75.077.0
Secondary (ISCED 3-4)
12.0 14.0 16.0 18.0 20.0 22.0 24.0 26.0 28.0
Tertiary (ISCED 5-8)
0.8 1.3 1.8 2.3 2.8 3.3
Tertiary/primary ratio 2010 2011 2012 2013 2014 2015
2007 2008 2009
2010 2011 2012 2013 2014 2015 2007 2008 2009
2010 2011 2012 2013 2014 2015 2007 2008 2009
2010 2011 2012 2013 2014 2015 2007 2008 2009
CZ HU PL SK
Fig. 5: Development of population related to highest education level
Source: EU-SILC, Author’s computations
Fig. 5: Development of population related to highest education level
Source: EU-SILC, Author’s computations 6.0
8.0 10.0 12.0 14.0 16.0 18.0 20.0 22.0
Primary (ISCED 0-2)
59.061.0 63.065.0 67.069.0 71.073.0 75.077.0
Secondary (ISCED 3-4)
12.0 14.0 16.0 18.0 20.0 22.0 24.0 26.0 28.0
Tertiary (ISCED 5-8)
0.8 1.3 1.8 2.3 2.8 3.3
Tertiary/primary ratio 2010 2011 2012 2013 2014 2015
2007 2008 2009
2010 2011 2012 2013 2014 2015 2007 2008 2009
2010 2011 2012 2013 2014 2015 2007 2008 2009
2010 2011 2012 2013 2014 2015 2007 2008 2009
CZ HU PL SK
25.0 27.0 29.0 31.0 33.0 35.0
2010 2011 2012 2013 2014 2015 a) Salariat
43.0 45.0 47.0 49.0 51.0 53.0 55.0
b) Workers
10.0 12.0 14.0 16.0 18.0 20.0
c) Intermediary
0.400 0.500 0.600 0.700 0.800
d) Salariat/Workers ratio 2007 2008 2009
2010 2011 2012 2013 2014 2015 2007 2008 2009
2010 2011 2012 2013 2014 2015 2007 2008 2009
2010 2011 2012 2013 2014 2015 2007 2008 2009
CZ HU PL SK
Articles
751
Combining the two classes allows us to construct a simple indicator—sala- riat/worker ratio—with which we can then track the relative importance of these classes over time (Figure 4d). The results suggest that, while the Czech Republic and Poland experienced a remarkable increase in the ratio between 2007 and 2015 (from 0.63 and 0.57 to 0.74 and 0.67, respectively), in Hungary we observe only a slight increase, from 0.50 to 0.54 Slovakia is different. A relatively slow increase in the ratio between 2007 and 2010 (from 0.65 to 0.71) was followed by a sharp decrease up to 2015 (to 0.59). The intermediary class (Figure 4c) was relatively sta- ble in the Czech Republic (around 19.5%), Poland (around 18.7%), and Hungary (around 15%), while in Slovakia it experienced a remarkable increase (from 10.4%
in 2007 to 15.7% in 2015).
Regarding the changes in educational structure, the four panels in Figure 5 suggest positive changes in the highest educational attainment levels in all V4 countries. The share of people aged 25–64 with only primary or secondary edu- cation declined, with a commensurate increase in the proportion of those with tertiary education. The highest proportion of people with only primary educa- tion and the fewest with tertiary education are observed in Hungary. Figure 5 suggests very similar patterns over time in Slovakia and the Czech Republic, al- though Slovakia experienced a slow-down in the decreasing share of people with only primary education and an increasing share of people with tertiary educa- tion after 2012. This resulted in a departure from the upward trajectory Slovakia had been experiencing in its tertiary/primary education ratio (bottom right panel of Figure 5).
Regarding the degree of urbanisation in the V4 regions (Figures A7 and A8 in the Appendix), the share of people living in cities generally decreased across the V4 regions; changes in rural areas do not suggest a consistent pattern.
These changes can be associated with the processes of suburbanisation (see, e.g., Čermák [2005] and Stanilov and Sýkora [2014]).
Our analysis of the general developments and regional variations in the major socio-economic indicators provides some initial insight into the level of socio-spatial disparities in V4 countries. However, this aggregate approach does not provide sufficient insight into the trends in stratification and regional ine- qualities within countries, which may be substantial given the size of the regions.
Therefore, the next section presents a detailed analysis of social differentiation at the regional level.
Social differentiation: the subnational perspective
In this section we provide an analysis of social differentiation broken down into two different dimensions: the subnational (regional) level and the degree of ur- banisation. At the regional level, we also graphically present the regional distribu- tion of the specific variable in 2007 and 2015 and changes between 2007 and 2015.
Sociologický časopis/Czech Sociological Review, 2019, Vol. 55, No. 6
752
Changes in the social structure according to the Socio-economic Classification
The general patterns of curves depicted in Figure A9 in the Appendix suggest differing trajectories in the shares of the salariat and more similar trends in shares of workers across regions with different degrees of urbanisation. However, the magnitudes differ remarkably. The Czech Republic and Poland experienced sig- nificant increases in the shares of the salariat in cities (from 39% and 38% to 44%
and 45%, respectively) and towns and suburbs (from 26% and 22% to 31%, respec- tively), though both countries experienced only slight changes in rural areas. On the other hand, the development of the salariat in Slovakia in cities and towns/
suburbs shows a slight increase between 2007 and 2009, followed by a continual decrease until 2015, to a level below that in 2007. Hungary experienced a slightly U-shaped pattern of development in its towns and suburbs, increases in the share of the salariat in cities, and a relatively stable share in rural areas.
The share of workers in cities and towns/suburbs in the Czech Republic, Poland, and Slovakia exhibits a decreasing pattern. While workers in the city re- gions in Hungary decreased over time, their shares in towns and suburbs re- mained relatively stable at around 51%. There is a relatively large difference be- tween the share of workers in rural areas in Hungary and rural areas in the other countries. While the share of workers in rural areas in Hungary was around 62%, the share in the Czech Republic, Poland, and Slovakia was around 54%, although no clear trends are visible.
The trends for the ‘never worked and unemployed’ class (see Figure A9 in the Appendix) can, to some extent, be seen as similar to those in towns/suburbs and rural areas in the V4 countries (although the proportions across countries differ). The trends in the unemployed class in cities differed significantly across regions, but all four countries converged to a proportion of approximately 4–5%
in 2015. The changes in unemployment reflect the consequences of the post-crisis period and the changes on the labour markets in the V4 countries.
The level of regional differences in the shares of the salariat, intermediate class, and workers are captured by the coefficient of variation. As Figure A11 in the Appendix suggests, the differences across regions remained stable for the salariat and workers, but the data suggest a remarkable decline in the coefficient of variation for the intermediate class.
As the regional distribution in Figure 6 suggests, the highest share of the salariat class is observed in the capital city regions across all four countries. The Hungarian regions (excluding the capital region) have, in relative terms, the smallest share of salariat class of all V4 countries. While most regions experi- enced an increase in the share of the salariat class between 2015 and 2007, its proportion in Slovak society decreased in all regions. These developments across the regions may to some extent be attributed to the structural changes that the V4 economies underwent in the period after acceding to the EU and may also be re- lated to the effects of the economic crisis. Three of the Czech regions experienced
Articles
753 Figure 6. Spatial distribution of the percentage of the salariat in V4 countries
[21.2; 23.0]
[23.1; 24.5]
[24.6; 26.8]
[26.9; 29.8]
[29.9; 32.7]
[32.8; 49.7]
Source: EU-SILC 2006–2016; authors’ computations.
a) 2007 b) 2015
[22.1; 25.5]
[25.6; 26.5]
[26.6; 29.3]
[29.4; 30.6]
[30.7; 35.2]
[35.3; 54.2]
[−18.3; −5.6]
[−5.5; 4.7]
[4.8; 7.1]
[7.2; 14.3]
[14.4; 16.5]
[16.6; 20.9]
c) Change 2015 vs 2007
Sociologický časopis/Czech Sociological Review, 2019, Vol. 55, No. 6
754
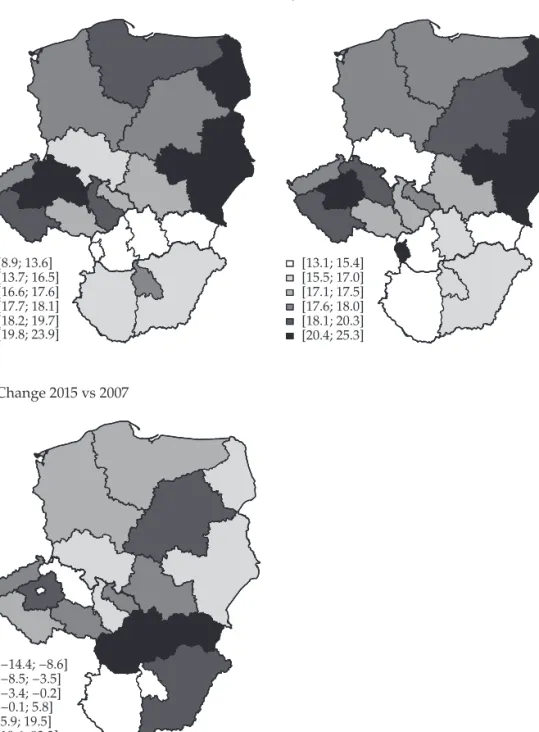
Figure 7. Spatial distribution of the percentage of the intermediate class in V4 countries
[8.9; 13.6]
[13.7; 16.5]
[16.6; 17.6]
[17.7; 18.1]
[18.2; 19.7]
[19.8; 23.9]
Source: EU-SILC 2006–2016; authors’ computations.
a) 2007 b) 2015
[−14.4; −8.6]
[−8.5; −3.5]
[−3.4; −0.2]
[−0.1; 5.8]
[5.9; 19.5]
[19.6; 93.3]
c) Change 2015 vs 2007
[13.1; 15.4]
[15.5; 17.0]
[17.1; 17.5]
[17.6; 18.0]
[18.1; 20.3]
[20.4; 25.3]
Articles
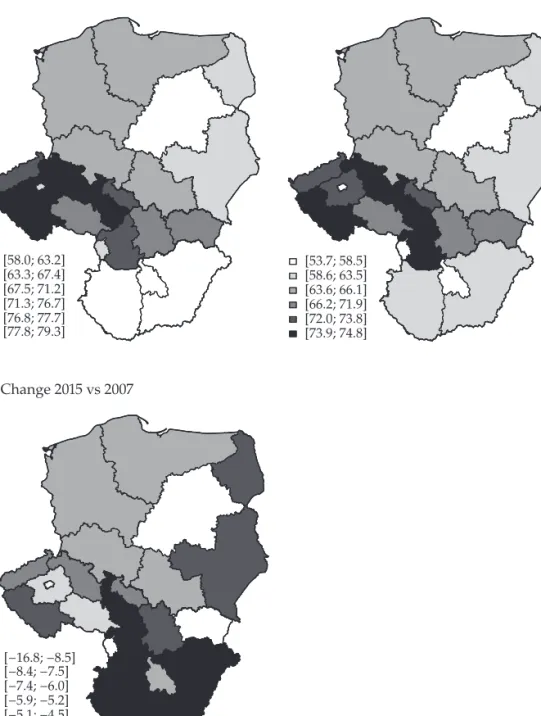
755 Figure 8. Spatial distribution of the percentage of working class in V4 countries
[24.0; 43.9]
[44.0; 48.1]
[48.2; 48.8]
[48.9; 50.6]
[50.7; 51.7]
[51.8; 58.7]
Source: EU-SILC 2006–2016; authors’ calculations.
a) 2007 b) 2015
[−12.0; −8.6]
[−8.5; −6.4]
[−6.3; −5.8]
[−5.7; −4.0]
[−3.9; −1.3]
[−1.2; 0.0]
c) Change 2015 vs 2007
[22.5; 41.4]
[41.5; 44.3]
[44.4; 48.2]
[48.3; 48.4]
[48.5; 50.5]
[50.6; 55.4]
Sociologický časopis/Czech Sociological Review, 2019, Vol. 55, No. 6
756
an increase in the proportion of the salariat class of more than 15% between 2007 and 2015. These patterns may also be related to the educational structure of the Czech population, which has the smallest share of people with only primary edu- cation, the largest share of people with secondary education, and rapid growth in the share of those with tertiary education.
The overall range of the proportion of the intermediate class shrank from [8.9; 23.9] to [13.1; 25.3] between 2007 and 2015, with the Slovak regions experi- encing the greatest relative changes (Figure 7). The proportion of intermediate class in the Bratislava region (which includes the capital city) doubled from 11%
to almost 21%. This can be linked to the changes in the employment structure in Slovakia and to the large volumes of foreign investment aimed at the services sector in the capital region.
As opposed to the salariat class, the smallest proportion of the working class (Figure 8) is found in the capital regions. The general declining pattern of the working class is also reported at regional levels, with all regions experiencing a decrease.
Regarding the changes in the ‘never worked and unemployed’ class, all Czech and Polish regions experienced a decrease between 2007 and 2015. How- ever, all Slovak regions experienced an increase, which was also the case for Hungary, with the exception of the Great Plain and North regions, where slight decreases are observed (see Figure A10 in the Appendix). These trends reflect developments in regional unemployment, which can be attributed to the changes in the post-crisis period.
Changes in the educational structure in V4 countries
The patterns in the educational attainment of populations broken down by the degree of urbanisation (Figure A12 in Appendix) are consistent with the patterns at the national level across all countries. The shares of people with only primary education are decreasing in all areas, although the decline is slowest in towns and suburbs. When it comes to secondary education, the trends are more ambiguous.
While the proportion decreases in rural areas in all countries, it remains relative- ly constant in towns and suburbs. It also decreases in cities, except in Hungary, where it remains relatively constant (around 60%) and at the lowest level among V4 countries. The share of people with tertiary education rose in all countries and area types, with Polish and Czech cities experiencing faster growth rates. As the results at the national level suggest, Hungary experienced the least favourable situation—it has relatively large shares of people with only primary education found in all types of areas and has the slowest growth rates in the shares of those with tertiary education.
Regarding the regional distribution of populations by highest education at- tained, the results (Figure A13 in the Appendix) suggest that regional differences
Articles
757 Figure 9. Spatial distribution of people with max. primary education in V4 countries
[4.3; 9.1]
[9.2; 10.1]
[10.2; 11.2]
[11.3; 13.1]
[13.2; 15.6]
[15.7; 25.2]
Source: EU-SILC 2006–2016; authors’ computations.
a) 2007 b) 2015
[−41.6; −36.8]
[−36.7; −34.1]
[−34.0; −26.2]
[−26.1; −24.7]
[−24.6; −21.0) [−20.9; −5.2]
c) Change 2015 vs 2007
[2.8; 5.8]
[5.9; 6.9]
[7.0; 8.4]
[8.5; 9.9]
[10.0; 11.3]
[11.4; 21.2]