Sustainable Miracles: Protection and
Competition in the Brazilian Oil Industry
∗
Benjamin Bridgman
†Victor Gomes
‡Arilton Teixeira
§June 8, 2005
Abstract
It is often suggested that competition improves productivity, however, the
un-derlying support for this idea is surprisingly thin. This paper presents a case study
examining the effects of a change in the competitive environment on productivity
at the Petrobras, Brazil’s state-owned oil company. Petrobras had a legal monopoly
on production, refining, transportation and importation of oil in Brazil until it was
removed in 1995. Even though Petrobras continues to have ade facto monopoly, the
end of legal monopoly labor productivity growth rate more than doubled. A growth
accounting of the industry shows that between 1977 and 1993 output growth rate
(and productivity growth rate) is explained by the accumulation of capital, while
Total Factor Productivity (TFP) decreased. Between 1994 and 2000 labor
pro-ductivity growth rate is completely explained by the growth rate of T F P. The
results suggest that the threat of competition alone is sufficient to improve
produc-tivity. They also provide evidence that restricting competition help cause Brazil’s
depression of the 1980s.
∗Preliminary. We would like to thanks James Schmitz Jr. for comments and Patr´ıcia Moura da
Silva for research assistance. The views expressed in this paper are solely those of the authors and not necessarily those of the U.S. Bureau of Economic Analysis or the U.S. Department of Commerce.
1
Introduction
It is often suggested that competition improves productivity. It is an idea at least as old
as Adam Smith and is cited as support for a number of policy interventions including
antitrust enforcement, deregulation of markets and privatization. Some economists have
argued that restrictions on competition are an important source of differences in national
income. (Parente and Prescott [18], Herrendorf and Teixeira [10])
Given its long pedigree, the underlying support for this idea is surprisingly thin. The
theoretical literature is ambiguous. While some models predict increasing productivity
in response to competition (For example, Holmes and Schmitz [9]), others predict the
opposite. (For example, Martin [15] and Horn, Lang and Lundgren [9])
The empirical literature is also ambiguous. A number of authors have examined
the data from public sector reforms such as privatization, deregulation of markets, and
foreign competition. While many studies find improvements in productivity, some find
the opposite. (See Megginson and Netter [16] for a survey.)
One challenge in testing this relationship is the measurement of competition. Common
measures such as market share suffer from confounding influences. A firm may have a
large market share because it is a very productive firm and can sell its output at a low
price or because it has monopoly power. More direct measures such as markups require
data on costs that are typically not available.
Another challenge is that reforms that increase competition are typically part of a
comprehensive package, making it difficult to identify how competition affects
productiv-ity. For instance, a firm may be privatized at the same time as its markets are liberalized
and trade barriers are reduced. Therefore, it is difficult to disentangle the effects of
ownership change from those of market changes.
This paper presents a case study examining the effects of a change in the competitive
environment on productivity at the Petrobras, Brazil’s state-owned oil company.
Petro-bras had a legal monopoly on production, refining, transportation and importation of oil
in Brazil until it was removed in 1995.
of competitiveness. This strategy has used to examine a number of instances when the
competitive environment changed, including reduced trade barriers, deregulation,
priva-tization (Schmitz and Teixeira [19]), and changes in technology (Galdon and Schmitz [8]).
We have selected a case that avoids disentangling the effects of multiple policy changes.
The Petrobras reform was simply the removal of a legal monopoly and was not
accom-panied by any other changes. Ownership was not changed, nor are there plans to do
so. Therefore, any changes in productivity cannot be attributed to other (direct) policy
changes.
We find a large increase in labor productivity growth after 1994. Between 1977 and
1993 labor productivity grew at an annual average of 4.3 percent. Between 1994 and 2000
it grew at an annual average of 11.8 percent. Not only did growth more than double,
the sources of the growth changed. Labor productivity growth prior to 1995 was due to
capital accumulation (with T F P decreasing) while almost all growth after 1994 was due
to T F P growth (as capital stock fell).
These gains all the more impressive given how little competition Petrobras actually
faced after losing its legal monopoly. It still maintains a dominant position. For
exam-ple, Petrobras still has over 97% of Brazil’s refining capacity. Its advantages as a large
incumbent made it difficult for competitors to enter the market. Unlike previous studies
where firms face a declining market as a result of competition, the threat of competition
was sufficient to generate significant productivity gains.
The experience of Petrobras gives some insight into several areas of economics.
First, economists should be cautious when using market shares as a indicator of
com-petitiveness. The prospect of competition resulted in changes in Petrobras’s productivity.
However, market concentration indicators changed very little. As a proxy for competition,
they would have missed a shift in the competitive environment.
Second, privatization may not be required to improve the performance of public
en-terprizes. There are no plans to privatize the company and it is unlikely to occur in the
future given the political sensitivity of such a move. When privatization is not politically
for improving performance. The results lend support to the view that the competitive
environment is an important determinant of productivity, regardless of ownership. (See
Bartel and Harrison [1] for a discussion of the environment vs. ownership issue.)
Third, the results provide support for the idea that closing off competition in the 1970s
contributed to Brazil’s poor economic performance in the 1980s. Brazilian T F P began
to fall after the government expanded state-owned enterprizes (including Petrobras) and
raised trade barriers during the 1970s as a strategy to keep the economy growing despite
the recession that hit the main capitalist economies and the slowdown in the productivity
growth rate.1
2
The Oil Industry in Brazil
Since oil was discovered in Bahia in 1938 until the 1990s, the Brazilian oil industry has
been characterized by increasing government intervention2.
From 1938 to 1954, the government sought to develop the oil sector through private
companies while serving as a regulator through the National Petroleum Council
(hence-forth CNP, from its Portuguese name). But the private sector did not show much interest
since the reserves belonged to the CNP and there was no legislation to guaranteing
in-vestors the benefits of exploration. In addition, the cost of extracting oil in Brazil was
high compared to that of the Middle East.3
In 1954, the government created the state-owned monopoly Petrobras to explore,
ex-tract and refine petroleum. (Existing private refining companies were allowed to continue
operating but could not expand.) This policy was part of a larger import substitution
policy to develop the industrial sector (Kingstone [13]).
The monopoly power of Petrobras was extended to the import and export of oil in
the 1963. Between the creation of Petrobras and 1970s, domestic prices were essentially
equal to the international prices plus a Federal tax. In an attempt to shield the domestic
1
See Bugarin, et al. [2, 3].
2
See Campos [4].
3
economy from the oil shocks, domestic prices became disconnected from international
prices in 1977 and based on a measure of domestic production cost.
In 1988, the process of increasing government intervention reached its apex when
Petrobras’s monopoly rights were guaranteed in the new Brazilian constitution.
By the beginning of the 1990s, the process of privatization and deregulation in the
Brazilian economy reached the oil sector. A constitutional amendment (Constitutional
Amendment Number 9) approved by the Brazilian Congress in 1995 ended the monopoly
rights of Petrobras over production, refining, importing and exporting. Though many
other sectors were privatized, the Brazilian government did not propose privatizing
Petro-bras. The end of monopoly was the biggest concession that the government could manage
to get from the Brazilian Congress4.
With the change in the Brazilian constitution, a new regulatory framework was set up
for the oil sector. In September 1997, a new law was approved by the Congress allowing
any firm to produce, transport, refine import and export petrol in Brazil. In 1998, two
government decrees set up a regulatory structure in the sector and the National Energy
Policy Council (CNPP) to advise on the norms and rules for the sector. It created the
National Petroleum Agency (ANP henceforth) to regulate the sector. Finally, it set up
auctions to sell the rights to extract oil in Brazil. In 1998, Petrobras were given the rights
to the fields it has already started exploiting, keeping 7% of potential areas. This was
called Round 0. In 1999, auctions began to sell exploitation rights for the remaining areas
(Kingstone [13]).
3
Productivity at Petrobras
In this section we will analyze Petrobras’s productivity performance in response to the
loss of its legal monopoly.
Even though the change in the monopoly status of Petrobras happened in 1995,
dis-cussion of the policy change began earlier. When dating the beginning of a reform, the
4
date of the legal change many not be the most relevant date. Managers in the reformed
industry may have anticipated the reform and introduced changes prior to the reform
becoming official. (This is sometimes called the “announcement effect.”)
In a study of the impact of privatization in the Brazilian iron ore sector Schmitz and
Teixeira [19] argue that 1989 should be set as the beginning of the reform. It was in
1989 that a new Brazilian president was elected promising to privatize and deregulate the
economy to increase competition (Kingstone [13] and Velasco [12]).
We date the beginning of the reform in the oil industry as 1994. The policy to remove
the monopoly originated with President Fernando Henrique Cardoso, who took office in
January 1994. In January 1995, he sent an amendment to the Congress (Amendment #9)
to eliminate Petrobras’s monopoly and Congress approved it in September 1995. Since
discussion began before the amendment was sent to the Congress, we argue that 1994 is
the year that the reform of Petrobras began.
In what follows, we will argue that the end of Petrobras’s monopoly rights and the
threat of new competitors had a impact on its productivity performance. First, we will
look at a measure of technological progress, total factor productivity (T F P), of Petrobras.
T F P is computed using a Cobb-Douglas production function given by
Yt=AtK θ tM
α tN
(1−θ−α)
t (1)
whereKtis the aggregate capital stock,Mtis the amount of material,Ntis the number of
employees,θis the capital share,αis the labor share andAtis the total factor productivity
(henceforth T F P).
Using the balance sheets of Petrobras and data available at the ANP we computed
total amount of oil produced, the capital stock, the number of employees for each year
and the labor share in the period 1976 and 2000. The average labor share in the period
equal to 0.2 was used as the calibrated value of α. We did not have data for material
number of wells. Behind this assumption is the idea that the amount of material used is
defined by technology and therefore can not be easily substituted. Using data available
for the United States we computed the share of capital equal to 0.455 Therefore the share
of material was set equal to 0.35.6. The results are showed in Figure 1
Figure 1: Total Factor Productivity of Petrobras, 1976-2000
1975 1980 1985 1990 1995 2000
60 70 80 90 100 110 120 130 140
Years
1976 = 100
Beginning of Privatization
Beginning the Discussion to End Monopoly
The second half of the 1970s are characterized by a deep and abruptly fall in T F P
of Petrobras. The TFP index falls from 100 in 1976 to 63 in 1980. This fall in T F P of
Petrobras was in line with the fall in the aggregate Brazilian T F P (Bugarin, et al. [3]).
From 1980 until 1993 T F P shows no sustained gains. This period corresponds to the
time Petrobras was a legal monopolist. In fact, its monopoly power was increased in this
period. In 1988 Petrobras’s monopoly rights became a constitutional guarantee rather
than an ordinary law. On the other hand, from 1994 until 2000T F P grows very fast. In
five years T F P almost doubled, increased 82%. This is the period when a constitutional
amendment abolished the monopoly rights of Petrobras, opening the sector to private
5
We use the KLEM data set for Oil and Gas Extraction (Industry Group 4) described in Jorgenson and Stiroh [11]. The labor share for Petrobras was nearly identical to that of the United States.
6
companies.
The results shown in Figure 1 could be driven by the assumption about materials. To
check this possibility, we assumed that θ, the capital share in Equation 1, was equal to
0.8 and that material share was equal to zero. In this case we do not need to use any
proxy for material. The results of T F P computed with and without materials in the
production function are shown in Figure 2
Figure 2: Total Factor Productivity of Petrobras, 1976-2000
1975 1980 1985 1990 1995 2000
50 60 70 80 90 100 110 120 130 140
Years
1976 = 100
TFP With Material TFP Without Material
Excluding materials changes the magnitude of TFP’s movements, but does not affect
its pattern. In what follows, we will keep materials in the production function since we
know from the U.S. data that material are a input in the oil sector.
The next step is to study the sources of growth of production and labor productivity
(henceforth productivity). First we perform a growth accounting of growth rate of output.
[log (Yt+s)−log (Yt)]/s= [logAt+s−logAt]/s+θ[log (Kt+s)−log (Kt)]/s+ (2)
α[log (Mt+s)−log (Mt)]/s+ (1−θ) [log (Nt+s)−log (Nt)]/s
The left hand side of Equation 3 gives us the contribution of technological progress,
accumulation of capital, material and number of workers employed to output growth.
As we said before, using a capital share of 0.45 and labor share equal to 0.2 the growth
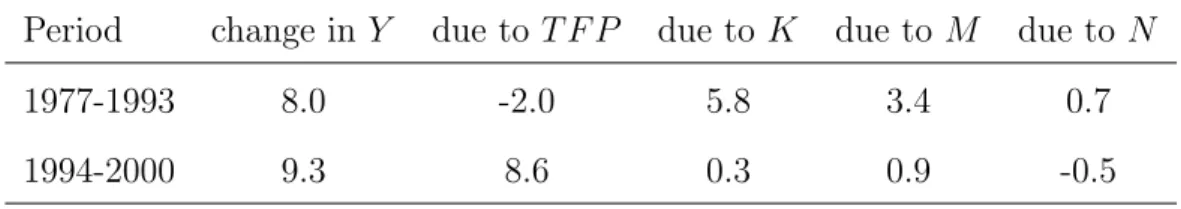
accounting in the two subperiods is given in Table 1.
Table 1 - Growth Accounting of Petrobras’s Output(%)
Period change in Y due to T F P due toK due toM due to N
1977-1993 8.0 -2.0 5.8 3.4 0.7
1994-2000 9.3 8.6 0.3 0.9 -0.5
The growth rate of output increased in the period without monopoly. But the major
difference comes from the sources of growth in the two subperiods. In other words,
the engine of growth changed. In the first period, output grew almost entirely due to
increasing capital and materials. There is no technological progress. In fact technology
regressed (see also Figure 1). This result is similar to the the findings of Bugarin, et al. [3]
for the aggregate Brazilian economy. They found that to keep the economy growing after
the oil shocks of the 1970s the government encouraged capital accumulation, despite the
lack of technological progress. To pursue the objective of keeping the growth rate of
the Brazilian economy the government subsidized private companies and had SOEs, like
Petrobras, increase investment. (We elaborate on this point below.).
In the second subperiod, the major source of growth was T F P. The growth rate of
T F P increased a dramatically and it explains 93% of the growth rate of output.
We also perform a growth accounting of productivity (labor productivity). We divide
log
Yt+s Nt+s
−log Yt Nt
/s= [logAt+s−logAt]/s+ (3)
θ
log
Kt+s Nt+s
−log Kt Nt /sα log Mt+s Nt+s
−log Mt Nt /s
Using the same capital share and the share of material as specified above (θ equal to
0.45 and α equal to 0.35) we get the following results.
Table 2 - Growth Accounting of Petrobras’s Labor Productivity (%)
Period change in Y /N due to T F P due to K/N due toM/N
1977-1993 4.3 -2.0 4.1 2.2
1994-2000 11.8 8.6 1.4 1.8
Table 2 gives us a better idea of the engine of growth. First, we see that growth rate
of productivity more than doubled after the end of monopoly. In the first subperiod,
productivity grew almost completely due to an increases in K/N and M/N while T F P
fell. In the second, T F P became the major source of growth.
Even though the increase of T F P started in 1994 (Figure 1) some other possibilities
are open to explain this increase. One possibility is that technology advanced faster
after 1994. To eliminate this possibility, we compare the Brazilian industry to that of the
United States. Since we do not have enough data to computeT F P in the U.S. oil industry,
we examine labor productivity. We compute the labor productivity of Petrobras relative
to the U.S. labor productivity. If technology advanced faster after 1994 the relative
productivity should not change since we would expect the United States industry to
implement the new technology and experience the similar growth in the labor productivity.
Figure 3 plots two series. One is the labor productivity of Petrobras (Labor
Produc-tivity). The other is the labor productivity of Petrobras relative to the United States
(Relative Labor Productivity). Both indices set to 100 in 1980. We analyze three
Figure 3: Brazilian Labor Productivity Relative to the United States (1980=100), 1976-2000
19750 1980 1985 1990 1995 2000 100
200 300 400 500 600 700
Years
1980 = 100
Relative Labor Productivity Labor Productivity
until 1985 relative productivity increased going from 100 to 200. Third, from 1985
un-til 1993 relative productivity is constant. Finally, after 1994 when relative productivity
grows quickly. Relative productivity more than doubled, going from 200 in 1995 to 500
in 1999.
To help us analyze these four subperiods, we recalculate Table 2 breaking it in smaller
subperiods. The results are in Table 3.
Table 3 - Growth Accounting of Petrobras’s Relative Labor Productivity
(%)
Period change in Y /N due to T F P due to K/N due toM/N
1977-1980 -6.4 -11.6 5.7 -0.5
1981-1985 16.4 7.1 6.2 3.1
1986-1993 2.0 -2.8 2.0 2.9
In the first subperiod, relative productivity is constant. Labor productivity for both
Petrobras and the United States decline. Recall from Table 3 that Petrobras’s
produc-tivity did not fall as much as T F P because capital and materials growth compensated.
In the second subperiod, 1980-1993, relative productivity as well as T F P increased.
The growth in the relative productivity is due to increasing productivity at Petrobras
(the U.S. labor productivity is constant during this subperiod). There are two sources of
growth. Both TFP and theK/N ratio increased. Even thoughT F P was growing rapidly,
more than 75% of the growth of labor productivity is due to the rising K/Land M/N.
In the third subperiod, from 1986 until 1993, the United States’s and Petrobras’s
productivity are growing at the same rate. Note that Petrobras’s productivity is growing
only due to rising K/N and M/N. TFP shows a negative growth rate. One possibility
to explain this negative growth rate is the increase in barriers to entry in the oil sector.
The new constitutional guarantee in 1988 reduced the amount of competition Petrobras’s
managers anticipated, since changing the constitution is more difficult than changing a
law.
Finally, in the last subperiod from 1994 until 2000, relative productivity grows due to
growth in the productivity of Petrobras (U.S. productivity is constant). As noted above,
the main change with respect to the growth observed in the period 1980-1985 is the engine
of growth. Between 1980 and 1985 the main source of growth is capital accumulation and
material used per worker. After 1994, TFP is the main source of growth.
4
Competition and Productivity
In this section, we examine the implications of the results for relationship between
com-petition and productivity. We argue that the results show that thethreat of competition,
even absent actual competition, can increase productivity. We discuss the implications
of this finding for studying competition and designing reforms.
The reform we study is notable for how minimal it was compared to its effects. Even
particularly in the refining and import sector7 (Palacios [17] and Lewis [14]).
There was very little entry into the oil extraction market. Table 4 shows the number
of fields that Petrobras and other companies bought in each round that took place since
1998. The last column shows that share of all fields purchased over the period. Petrobras
has at least an interest in nearly three quarters of new concessions. Even though the
number of areas bought by other companies has increased, they have had little success
discovering oil. According to Kingstone [13], this has been used as an indicator that
Petrobras kept all the most promising areas in Round 0.
Table 4 - Purchase of Rights of Exploitation 1998/2004
Measuring Entry – Number of Fields
1998 1999 2000 2001 2002 2003 2004 Share 98-04 (%)
Petrobras 96 1 0 7 3 85 57 54.5
Petrobras with others 0 6 11 7 5 0 50 17.3
Others 19 5 10 19 13 16 47 28.2
Total 115 12 21 33 21 101 154 100
Source: ANP
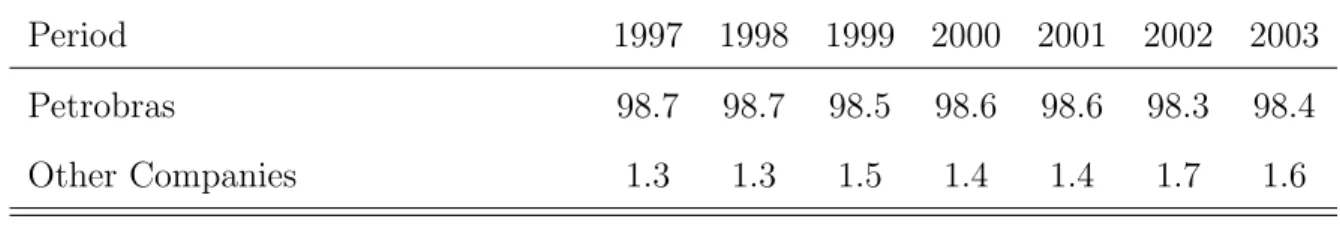
Petrobras also has nearly all the refining market. Table 5 shows the percentage of
Petrobras in the total refining capacity between 1997 and 2003. Petrobras has 98% of the
Brazilian installed capacity to refine oil during the entire period. The end of the monopoly
did not affect Petrobras’s share in the industry (even though refining is a specific sector
of the industry, these figures do not change if we look at other sectors of the industry
(production, export, import, distribution)8. See Lewis [14] and Ellsworth and Gibbs [7]).
7
There is still barriers to entry and the sector is quite risky due to government intervention. For example, currently the Brazilian government is blocking a price increase in the domestic market in response to the high prices of oil in the international market.
8
Table 5 - Share of the Installed Refining Capacity 1997/2003 (%)
Period 1997 1998 1999 2000 2001 2002 2003
Petrobras 98.7 98.7 98.5 98.6 98.6 98.3 98.4
Other Companies 1.3 1.3 1.5 1.4 1.4 1.7 1.6
Source: Anuario Estatistico (ANP).
An implication of the analysis is that economists should be cautious when using
mar-ket shares as a indicator of competitiveness. The prospect of competition resulted in
changes in Petrobras’s productivity. However, market concentration indicators changed
very little. As a proxy for competition, they would have missed a shift in the competitive
environment.
One of the most popular indices of concentration of firms in an industry is the
Herfindhal-Hirschman Index (HHI). It is given by the sum of the square of the market
share of all companies in a given industry. It lies between zero and one, higher numbers
indicating more concentration in the industry. Using the data in Table 5 we computed
the HHI.
Even though we do not have data covering the period before 1997, when Petrobras
was a monopolist, it could not be far from the numbers shown in Table 6 since the upper
bound for HHI is one.9
Table 6 - Herfindhal-Hirschman Index (HHI) in the Refining Sector 1997/2003
Period 1997 1998 1999 2000 2001 2002 2003
HHI 0.97 0.97 0.97 0.97 0.97 0.97 0.97
The HHI was unchanged and showed a extremely concentrated market over the reform
period. Using the HHI, one would conclude that the reform was a failure since Petrobras
9
did not cede any of its market share. However, it was successful in increasing productivity.
Studies using market share data will miss threats of competition, which can have real
effects.
Another implication is that privatization is not be required to improve the performance
of public enterprises. There are no plans to privatize Petrobras and it is unlikely to occur
in the future. Petrobras is one of a set of politically sensitive state enterprises, called
the “Crown Jewels.” It is also a significant source of revenues for both state and Federal
governments. The removal of the monopoly guarantee alone generated significant political
conflict. (Kingstone [13])
The results lend support to the view that the competitive environment is an important
determinant of productivity, regardless of ownership. In fact, many instances when only
ownership was changed have not resulted in an improvement in performance. (Bartel and
Harrison [1]) When privatization is not politically viable, increasing competition in the
markets of state-owned firms can provide an avenue for improving performance.
5
Petrobras and the Brazilian Economy
In this section, we compare the sources of Petrobras’s productivity growth with those
of the Brazilian economy. The experience of Petrobras is very similar to that of Brazil,
suggesting that understanding Petrobras may provide insights into the aggregate economy.
To compare the results of Petrobras with the Brazilian economy, we report the growth
accounting for the aggregate economy presented in Bugarin, et al. [3]. They use a capital
share of 0.4 and real GDP per working age person as the measure of output. Labor input
is hours worked. The results are reported in Table 7.
Table 7 - Growth Accounting of the Brazilian GDP per Working Age
Period change inY /N due to T F P due to K/Y due toH/N
1975-1980 2.27 -1.15 2.97 0.44
1981-1988 1.06 -1.63 1.22 1.47
1989-1992 -3.86 -5.41 3.08 -1.53
1993-1998 2.02 3.92 -0.41 -1.49
Source: Bugarin, et al. [3]
The performance of Petrobras closely follows that of the aggregate economy. During
the second half of the 1970s, the 1980s until the beginning 1990s, the Brazilian economy
grew only due to capital accumulation (K/Y on Table 7) which is also true of Petrobras.
Note that capital accumulation continued despite falling TFP, which suggests that
the returns to capital were falling. During the period 1968-1974 the economy had grown
rapidly, largely due to surging TFP growth. This period is often referred to as the
“Brazilian Economic Miracle”. After 1974, TFP began to fall. The Brazilian government
tried to maintain the economy’s growth rate by boosting the accumulation of capital
(Bugarin, et al. [2, 3]).
To encourage capital accumulation, the Brazilian government acted on three fronts.
First, it subsidized private investment by guaranteeing the rate of return. Second, it had
SOEs maintain high investment rates even though T F P and the rate of return of capital
were falling. Third, it increased protection from foreign firms by increasing barriers to
international trade.
The Brazilian economy started recovering earlier than Petrobras. The main reason is
that the reforms (privatization and trade liberalization) started earlier in other sectors
(trade liberalization started in 1990 ending in 1994 and privatization started in 1990).
The removal of Petrobras’s monopoly did not begin until 1994.
Bugarin, et al. [2, 3] argue that Brazil’s falling TFP in the 1970s was due to the
closing off of competition through trade restrictions and expanding SOEs. The findings
give support to this argument. While the study of a single industry, even a large one like
that this is a fruitful avenue of inquiry.
6
Conclusion
It is often suggested that protection reduces efficiency. It is also argued that public
enterprises are less efficient than private enterprises. The study of the end of monopoly
of Petrobras that give us some insights into this topics.
First, some caution is necessary when using market shares as a indicator of
compet-itiveness. As we saw just the threat of competition resulted in changes in Petrobras’s
productivity. However, market concentration indicators changed very little. As a proxy
for competition, they would have missed a shift in the competitive environment.
Second, when privatization is not politically possible, increasing competition in the
markets of state-owned firms can provide an alternative for improving performance. The
evidence supports the view that the competitive environment is an important determinant
of productivity, regardless of ownership.
Third, the results provide support for the idea that closing off competition in the 1970s
contributed to Brazil’s poor economic performance in the 1980s. Brazilian T F P began
to fall after the government expanded state-owned enterprises (including Petrobras) and
raised trade barriers during the 1970s as a strategy to keep the economy growing despite
the recession that hit the main capitalist economies and the slowdown in the productivity
growth rate.
References
[1] Ann P. Bartel and Ann E. Harrison. Ownership versus environment: disentanbling
the sources of public sector inefficiency. The Review of Economics and Statistics,
forthcoming.
[2] Mirta Bugarin, Roberto Ellery, Victor Gomes, and Arilton Teixeira. The brazilian
[3] Mirta Bugarin, Roberto Ellery, Victor Gomes, and Arilton Teixeira. From a miracle
to a disaster: the brazilian economy in the last 3 decades. mimeo, Fundacao Capixaba
de Pesquisa, 2004.
[4] Roberto Campos. A lanterna na popa. TopBooks, 1994.
[5] Ministerio das Minas e Energia. Setor energetico: destaques em 1999 e oportunidades
de negocios. mimeo, Ministerio das Minas e Energia, 2000.
[6] Paulo F. de Castro, Victor Gomes, and Marc A. Muendler. Brazil’s
Establishment-Worker Data Base – RAIS (Rela¸c˜ao Anual de Informa¸c˜oes Sociais). mimeo, UCSD,
2005.
[7] Chris Ellsworth and Eric Gibbs. Brazil’s natural gas industry: missed opportunities
on the road to liberalizaing markets. mimeo, The James A. Baker III Institute for
Public Policy of Rice University, 2004.
[8] Jose E. Galdon-Sanchez and James Schmitz. Competitive pressure and labor
produc-tivity: World iron-ore markets in the 1980’s. American Economic Review, 92:1222–
1235, September 2002.
[9] Harald Lang Henrik Horn and Stefan Lundgren. Competition, long run contracts
and internal inefficiencies in firms.European Economic Review, 38:213–233, February
1994.
[10] Berthold Herrendorf and Arilton Teixeira. Monopoly rights can reduce income big
time. mimeo, Arizona State University, 2004.
[11] Dale W. Jorgenson and Kevin J. Stiroh. Raising the speed limit: U.s. economic
growth in the information age. Brookings Papers on Economic Activity, 1:125–211,
February 2000.
[12] Licinio Velasco Jr. A economia politica das politicas publicas: fatores que
favorece-ram as privatizacoes no periodo 1985-94. Discussion Paper 54, Banco Nacional de
[13] Peter Kingstone. The long (and uncertain) march to energy privatization in brazil.
mimeo, The James A. Baker III Institute for Public Policy of Rice University, 2004.
[14] Steven W. Lewis. Deregulating and privatizing brazil’s oil and gas sector. mimeo,
The James A. Baker III Institute for Public Policy of Rice University, 2004.
[15] Stephan Martin. Endogenous firm efficiency in a cournot principal-agent model.
Journal of Economic Theory, 59:445–450, April 1993.
[16] William L Megginson and Jeffrey M Netter. From state to market: a survey of
empirical studies on privatization. Journal of Economic Literature, XXXIX:321–
389, June 2001.
[17] Luisa Palacios. The petroleum sector in latin america: reforming the crown jewels.
Technical Report 88, Les Etudes du CERI, 2002.
[18] Stephan L. Parente and Edward C. Prescott. Barriers to Riches. MIT Press, 2000.
[19] James Schmitz and Arilton Teixeira. Privatization’s impact on private productivity:
the case of brazilian iron ore. Staff Report 337, Federal Reserve Bank of Minneapolis,
Research Department, 2004.
[20] Tatyana Serour. Impactos da desregulamentacao sobre o desempenho do setor
Data
The main source for Brazilian data is the Oil Report (‘Relat´orio do Petr´oleo’) from
Ministry of Mines and Energy.
Oil production – thousands barrels per day:
1. Brazil: Oil Report, several years.
2. United States: Energy Information Administration, Annual Energy Review,
2001, p. 129.
3. World production, includes crude oil, shale oil, oil sands and NGLs (natural gas
liquids - the liquid content of natural gas where this is recovered separately):
BP Statistical Review of World Energy, June 2002.
Employment – oil and gas extraction, and oil and gas extraction services:
1. Brazil: Oil Report and RAIS. For details on RAIS see [6].
2. United States: Production and Service Jobs and Wells Drilled. U.S.
Depart-ment of Labor, Bureau of Labor Statistics, National EmployDepart-ment, Hours, and
Earnings (www.bls.gov). Oil and gas production (eeu10131001), and oil and
gas services (eeu10138001).
Price – Dubai, oil spot crude price. US dollars per barrel. 1972-1985: Arabian Light;
1986-2001: Dubai. Sources: Brazilian Oil Report and BP Statistical Review of