M
ASTER OF MONETARY AND FINANCIAL ECONOMICS
MASTERS FINAL WORK
DISSERTATION
ASSESSING PENSION EXPENSES DETERMINANTS
–
THE
CASE OF PORTUGAL
André Fernando Rodrigues Rocha da Silva
M
ASTER OF MONETARY AND FINANCIAL ECONOMICS
MASTERS FINAL WORK
DISSERTATION
ASSESSING PENSION EXPENSES DETERMINANTS
–
THE
CASE OF PORTUGAL
André Fernando Rodrigues Rocha da Silva
Supervisor: Maria Teresa Medeiros Garcia
i
Glossary
FEFSS –“Fundo de Estabilização Financeira da Segurança Social” in Portuguese; GDP – Gross Domestic Product;
LHS – Left-Hand Side;
OLG – Overlapping Generations Model; PAYG – Pay-As-You-Go Pension Scheme; RHS – Right-Hand Side;
TFP – Total Factor Productivity;
TSU –Contribution rate (“Taxa Social Única” in Portuguese); VAR – Vector Autoregressive Model;
VEC – Vector Error Correction;
ii
Abstract
The lack of studies about the impact of demographic and economic variables
such as ageing, productivity and unemployment, on Portuguese Social Security
expenditures, arises expected concerns on its financial sustainability. From a theoretical
perspective, low fertility increases old-age dependence index and decreases economic
growth, reinforced by unemployment which shrinks the contributory base and
productivity (increasing the burden of pension expenditures on the overall economy).
However, it is crucial to develop an applied work in this field in Portugal to assess these
conclusions.
Using Portuguese time-series data from 1975 to 2014, it was found statistical
evidence of cointegration between unemployed people aged between 15 and 64 years
old, apparent productivity of labour and old-age dependence index (explanatory
variables) and pension expenditure as a share of GDP (dependent variable), but the sign
of long-run coefficient for the demographic component differs when the dummy
components are excluded, raising doubts about the impact of ageing on pension
expenditures. The remaining explanatory variables present a positive sign, positively
influencing the pension expenditure as a share of GDP. At last, it was developed a VECM
model with impulse-response functions and variance decomposition, and the results
showed that, in Portugal, ageing has an almost insignificant impact in the long-run,
comparing with unemployment and productivity.
JEL Classification: C32, C51, C52, H55
Keywords: Social Security, Unemployment, Productivity, Ageing, VECM,
iii
Acknowledgements
This dissertation tries to bring an alternative point of view in relation to a topic
which has become a great concern for public finances in Portugal and a big question
mark for contributors and pensioners: the future of the Social Security System in an
increasing ageing society.
I would like to thank Professor Teresa Garcia, who helped me surpass the
problems concerning the data and the theoretical framework of this work, being
extremely helpful to me.
I am also grateful to Professor Carla Martinho for helping me to review and
improve this work, concerning its presentation and grammatical structure.
This work is fully dedicated to my parents and my girlfriend. Without their
support (not only financial, but also for believing in my ability to provide a useful
contribution to society), I would feel completely lost and unmotivated.
iv
Table of Contents
1. Introduction………...1
2. The Portuguese Social Security System………..3
3. Literature Review………..…………9
3.1. Projections……….9
3.2. Policy Approach………..15
4. Data and Methodology………..20
4.1. Data Description……….20
4.2. Adopted Methodology ………..24
5. Results………26
5.1. Cointegration Equation……….……….26
5.2. VECM Model Coefficients…….………29
5.3. Impulse –Response Functions……….……….30
5.4. Variance Decomposition………..32
6. Conclusions and Future Research……….……….………….33
References………35
v
List of Tables
Table I –Ageing Report Sensitivity Tests………13
Table II – Brief Description of the Explanatory Variables……….…..………..………21
Table III – Descriptive Statistics of the Variables………..……….………22
Table IV – Unit Root Augmented Dickey-Fuller and Phillips-Perron Tests’ Results………..……….23
Table V – Unit Root Augmented Dickey-Fuller and Phillips-Perron Tests’ Results with First Differences………24
Table VI – Variance for the Pensions_to_GDP Residuals………..……..……….32
Table VII – VAR Lag Order Selection Criteria Procedure……….…………..…………43
Table VIII – Johansen Cointegration Test Summary……….…..……….43
Table IX –Johansen Cointegration Test Without Dummy Variables…………..…..…44
Table X –Johansen Cointegration Test With Dummy Variables………….……..……..45
Table XI –VECM Model………..……….………46
Table XII – Descriptive Statistics –Residuals………..………….……….48
Table XIII – White Heteroskedasticity Test (No Cross Terms)…………..………48
Tale XIV – Covariance between Variables and Residuals………..…48
Table XV –Residual Normality Test……….……….………..49
Table XVI – Residual Serial Correlation LM Test……….………..……….49
Table XVII – VECM Model with P-Values……….……….49
vi
List of Figures
Figure 1 – Evolution of the General Social Security System Pension Expenditures (All the Subsystems) and Contributions to General Social Security
(1975-2014)………...………..6
Figure 2 –Total Pensioners in Social Security System………..……….6
Figure 3 – General Government Expenditure by Function (1995-2014)………8
Figure 4 – Response to Cholesky One Standard Deviation Innovation……….31
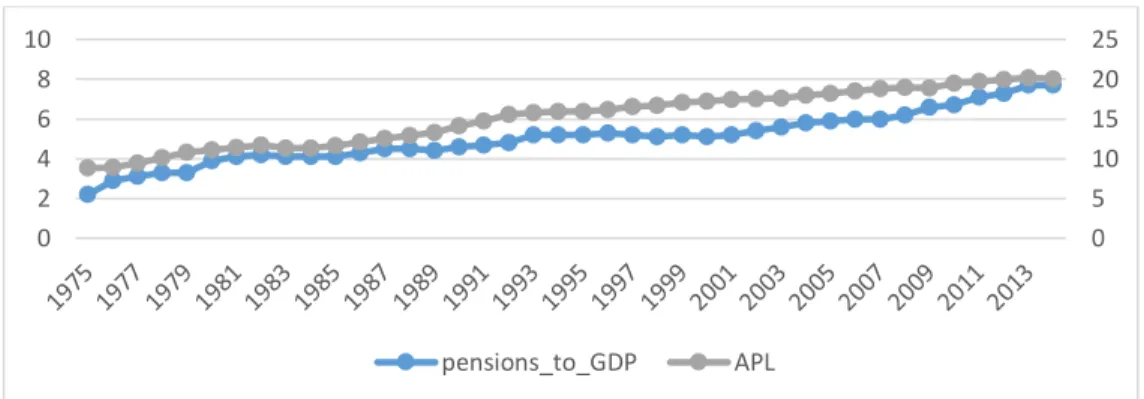
Figure 5 – Pension Spending By General Social Security System on Elderly, Disability and Survival Support as a Share of GDP and Old-Age Dependence Index (1975-2014)……….…………...42
Figure 6 – Pension Spending By General Social Security System on Elderly, Disability and Survival Support as a Share of GDP and Apparent Productivity of Labour (1975-2014)………..………..……….42
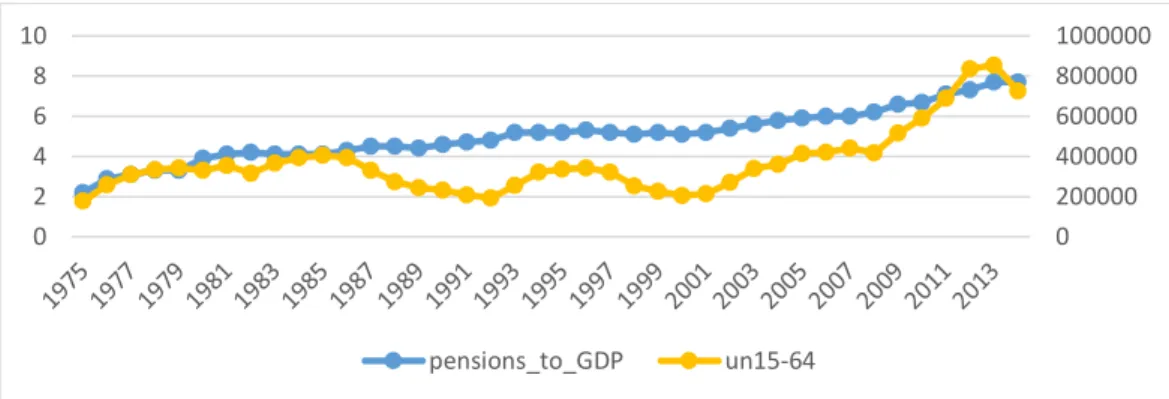
Figure 7 – Pension Spending By General Social Security System on Elderly, Disability and Survival Support as a Share of GDP and Unemployed Persons Aged Between 15 and 64 Years Old (1975-2014)………..……….43
1
1. Introduction
Nowadays, there is an increasing interest in the analysis of the impact of ageing
on public finances, particularly in terms of fiscal costs and consequently government
deficits in Portugal, raising questions about the financial sustainability of the social
security system. As Carone et al. (2005) pointed out, recent demographic forecasts
about the evolution of Portuguese population induce several impacts on real economy,
encompassing the quality of labour inputs (influenced by the age structure and the
human capital accumulated by the workforce), the capital/labour ratio,
labour-augmenting technical progress and labour input as direct effects. Moreover, the
reinforcement of indirect effects, such as the rise in labour taxes to finance age-related
spending (which may cause unemployment and distortions of economic decisions,
affecting the labour supply) can step up an even more shrinkage on economic growth.
But the literature arguments diverge: for instance, such change on the
population age structure and the progress on life expectancy are associated to profound
changes (and, some of them, positive) suffered by the social structures, such as the
creation of social security, the increase of education, the increase of productivity or the
decrease of hours worked. A young age structure can be beneficial in a rural society,
mostly dependent on the quantity of labour force, but can be disadvantageous in an
advanced industrial society mostly dependent on capital and labour force knowledge,
allowing the connection between ageing and economic growth (Rosa, 1996).
Regarding the mainstream literature about pensions, the last changes on
population and social structures are leaving several European Social Security Systems in
2
pressure due to the rise of expenditures on age-related programs (pensions and health),
causing unsustainable public debts, cuts in other type of important spending and large
tax increases. Such events could reduce economic growth and, without a proportional
reduction in interest rates, hamper reductions on debt-to-GDP ratio (Clements et al.,
2015).
In Portugal, there are few studies about what influences the behaviour and
evolution of Portuguese pensions expenditure and which link is established between
pensions expenditure as dependent variable and other relevant explanatory variables,
with the inclusion of the most recent developments on relevant variables, covering
today´s Portuguese environment and data1. Then, it is crucial to determine the causes
of that kind of relationship, how to handle the present situation and its implications in
the following generations, and the right policies to adopt. Only such analysis allows to
confirm or deny the existing conclusions, or even discover alternative ones.
As such, this work aims to understand which variables have a relevant influence
on social security pensions expenditure,providing some evidence about the impact of
ageing on public finances and comparing the main arguments about this topic.
Thereafter, the determination of the variables and its influence on pension expenditure
will be measured and predicted using econometric techniques in order to bring an
additional contribution and an alternative methodology in relation to previous studies.
Chapter 2 explains the evolution of the Portuguese Social Security System.
Chapter 3 presents some of the literature covering some projections and policy
1 Some exceptions are Andraz & Pereira (2012), Garcia & Lopes (2009), Garcia (2014), Martins (2014),
3
approaches about pensions, ageing and macroeconomic variables.Chapter 4 focuses on
the data and methodology used. Chapter 5 explains the results. Chapter 6 concludes,
showing the main limitations and comments on future researches related to this theme.
2. The Portuguese Social Security System
The First Social Security Act was published in 1984 (Decree-Law no. 28/84. 14th
August), establishing a contributory regime (guaranteeing the protection to workers and
their families in the case of disability, unemployment, death or family expenses) and a
non-contributory regime (protecting individuals with lack of subsistent resources, not
covered by the contributory regime). It is “an earnings-related public pension scheme with a means-tested safety net” (OECD, 2015, p. 325), where the contributory regime is financed by Social Security budget (mainly by contributions from workers and
employers), while the non-contributory regime and social action are financed mainly by
State budget transfers (Segurança Social, 2015).
Important legislation was implemented in the following years:
- Decree-Law no. 140-D/86, 14th July - Contribution rates (TSU) are set to be paid
by employees and employers in 11% and 24%2, respectively, of remuneration for
work performed, being the percentage of 0,50% to finance the professional
sickness benefit;
- Decree-Law no. 259/89, 14th August – The Social Security Reserve Fund (FEFSS)
was created in order to guarantee the financial stabilization of the social security
system;
4
- Decree-Law no. 514/90, 6th July – The attribution to retirees and pensioners of a
14th month, making them equivalent (in number of payments) in relation to the
majority of the active workers.
- Decree-Law no. 329/93, 25th September – The reform of the juridical regime of
old-age and disability pensions, which includes the standardization of the official
retirement age of 65 years.3
The Second Social Security Act was published in 2000 (Law no. 17/2000, 8th August),
but was revoked by the Third Social Security Act in 2002 (Law no. 32/2002, 20th
December) dividing the system into three subsystems: Social Security Public System,
Social Support System and Complementary System4. It is equally important to refer the
approval of Council of Ministers Resolution no. 110/2005, which intends to start the
convergence of the Civil Servants Fund to the General Social Security System5.
The Fourth Social Security Act (Law no 4/2007, 16th January) approved the general
basis of the General Social Security System currently implemented, creating three
subsystems: Citizenship Social Protection, Social Welfare System and Complementary
System6. Moreover, the Decree-Law no. 187/2007 introduced a sustainability factor7,
having into account the evolution of an increasing life expectancy, penalizing anticipated
3However, it includes a “transitional period of six years for the gradual introduction of the measure that
takes into account the higher life expectancy of women and the frequent existence of shorter careers” (Segurança
Social, 2015).
4 Sistema Público de Segurança Social, Sistema de Acção Social and Sistema Complementar, respectively
(Segurança Social, 2015).
5 General Social Security System encompasses the workers from private sector.
6 Sistema de Proteção Social de Cidadania, Sistema Previdencial and Sistema Complementar, respectively
(Segurança Social, 2015).
7 Ratio between life expectancy at 65 years in 2006 (changed to 2000 by Decree-Law no. 167-E/2013) and
5
retirements8. (Segurança Social, 2015). This reform, whose effects will mainly be felt in
the medium and long term, intends to promote the sustainability of the public finances,
reducing the value of future pensions expenditure relative to what had been expected
prior to the reform and a subsequent decrease of replacement rates (Braz & Cunha,
2012). It was aggravated in 2013 by the Decree-Law no. 167-E/2013.
It is possible to verify that the changes suffered by the General Social Security System
were caused mainly by social and political motivations from subsequent Governments.
The 63rd Article of the Portuguese Constitution (the right to Social Security) assumes that
the Social Security System is embodied by successive Social Security Acts which adjust
the System to the national social and economic evolution (Segurança Social, 2015).
In sum, Portugal presents a PAYG9 pension scheme10, when young workers agree to
pay (out of their labour income) the pension of the retired people in return for the
promise that the next generation does the same for them, and a Bismarckian system,
trying to provide reasonable living standards after retirement, without additional
arrangements (Blake, 2006)11. It is also a defined-benefit system (European Commission,
2015), offering pensioners more measurable post-employment income benefits
(Ramaswamy, 2012). The pension is indexed to prices and GDP and valorised in relation
to prices (European Commission, 2015)12.
8 The Solidarity Extraordinary Contribution was also introduced in 2011 by Law no. 55-A/2010, 31st
December, levied on all sorts of pension income, foreseeing their extinction in 2017.
9 The first studies about social security were developed by Samuelson in 1958 and Aaron in 1966, arguing
that PAYG systems can increase welfare if the sum of population growth rate with the rate of growth of productivity (real wages) is higher than the real interest rate (World Bank, 2006; Martins, 2014).
10 Supplemented by a funded component: the FEFSS.
11 Individual-voluntary private pension schemes in the private sector only exist to a minor extent in Portugal
(European Parliament, 2011).
12“Valorisation rules define how pension contributions paid during the working life are indexed before
retirement”, while “indexation of pensions in payment measures how the pension preserves its value over time” In
6
A synthesis of the evolution of public pension expenditure is illustrated in the
following figures:
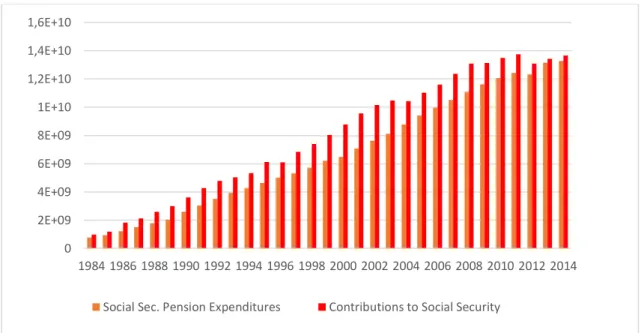
Source: PORDATA (2015). Values in Euros (at current prices).
FIGURE 1 – EVOLUTION OF THE GENERAL SOCIAL SECURITY PENSION EXPENDITURES (ALL THE SUBSYSTEMS) AND CONTRIBUTIONS TO GENERAL SOCIAL SECURITY
(1984-2014)
Source: PORDATA (2015). Values in individuals.
FIGURE 2 – TOTAL PENSIONERS IN SOCIAL SECURITY SYSTEM (1984-2014) 0
2E+09 4E+09 6E+09 8E+09 1E+10 1,2E+10 1,4E+10 1,6E+10
1984 1986 1988 1990 1992 1994 1996 1998 2000 2002 2004 2006 2008 2010 2012 2014
Social Sec. Pension Expenditures Contributions to Social Security
0 500000 1000000 1500000 2000000 2500000 3000000 3500000 4000000
7
According to Figure 1, it seems that the issue about the sustainability of Social
Security management is overestimated: the contributions to General Social Security
System have been higher than the expenditures with old-age, disability and survivor
pensions since 1984, reaching a value of 13663 million euros in 2014, against a value of
13277 million euros in expenditures in the same year, and both of them have presented
an increasing trend. Moreover, the pensioners shown in Figure 2 has registered the
same evolution, surpassing the value of 3.5 million in 201013, revealing the Social
Security System maturation process and the accomplishment of its purpose.
However, it can bring an additional pressure on the Government expenditures.
Between 1995 and 2013, total public pension expenditure rose 6.5 p.p. (from 9.2% of
GDP to 15.7%), representing one of the main factors accounting for the strong growth
in primary spending (excluding other obvious factors such as unemployment or reduced
economic growth), particularly after 2000 (Braz & Cunha, 2012; PORDATA, 2015).
Furthermore, expenditures with social protection represent the biggest portion of total
public expenditure (36.1% in 2015), surpassing the values for EU-28 Member States (on
average)14 regularly since 2011 (PORDATA, 2015). As such, it is required an attentive
analysis in order to clarify these events and their impacts on public accounts.
13 It can also be explained by the successive incorporation of civil servants from Civil Servants Fund to the
8 Source: EUROSTAT (2016). Values in percentage of total.
FIGURE 3 – GENERAL GOVERNMENT EXPENDITURE15 BY FUNCTION16 (1995-2014)
Assessing Figure 3, the evidence shows that the expenditure with Social
Protection has been the General Government most relevant expenditure (which is
expected in Euro Area on average), and its percentage of total has verified an increasing
trend, evolving from 27.1% in 1995 to 35.7% in 2014, following the evolution of the
pension expenditures analysed previously, being the biggest type of expenditure during
the referred time period. The increasing trend of social benefits (together with public
consumption) helps to explain the growth of public expenditures, increasing from 42.6%
of GDP in 1995 to 48.3% in 2015, illustrating the big weight of the Government on the
overall economy (PORDATA, 2015; Santos et al., 2010).
15 It includes Central Government, Local Government and Social Security System.
16 “Other expenditures” includes expenditure on environmental protection, housing and community
amenities and recreation, culture and religion. “Defence” includes defence, public order and safety. “Public Debt Transactions” could be included in “General Public Services”, but it is separated in order to facilitate the analysis. “Economic Affairs” are mainly related to activity sectors support.
0 20 40 60 80 100
Other General Public Services Defence
Economic Affairs Health
Education Social Protection
9
If public revenues are insufficient to cover expenditures, the deficit will be
financed by the issuance of public debt (both for private agents as for the Central Bank),
creating an additional burden over public finances. However, an expansionist fiscal
policy and resulting deficit could generate a lower capital accumulation and subsequent
crowding-out17 of private investment. Regarding private consumption, the future
Government payment commitment in the future will demand more taxes. If consumers
are not myopic (smoothing its consumption over time), the expectation of more taxes
in the future will reduce private consumption now (Santos et al., 2010).
Public debt transactions (the debt service) have registered values (10% in 2014)
close to health and education expenditures (12.1% and 12% in 2014, respectively), with
the repercussions highlighted previously, resulting on a difficult trade-off: lower interest
rates and low taxes are needed to increase investment and economic growth, but it ends
up worsening deficits in the short term, raising interest rates. Consequently, it is likely
that the Government will have to cut the biggest expenditures, namely social transfers,
health and education in order to balance public finances (Moniz et al., 2014)18.
These facts arise an important analysis methodology of public expenditures: not
only the size of expenditures are important but also its priorities and the following
repercussions on the economy.
3. Literature Review
3.1. Projections
17 The crowding-out effect is an increase of interest rates caused by an increase of public consumption
financed by the issuance of public debt, reducing private investment (Santos et al., 2010).
18 Piketty (2014) also highlighted this impact, reinforced the fact that a high economic growth followed by
10
According to the Bank of Portugal (2015), the financial unsustainability of Social
Security System and its impact on public accounts are issues that have been motivated
mostly by demographic changes, with social, economic and political implications. The
dynamics of the resident population growth in Portugal since the beginning of the XXI
Century is characterized by a reduction of both the natural balance and the net
migration which have become negative, explained by the increasing burden of the
central age groups. This can happen due to the fact that the increase of old people has
been lower than the decrease of young people, resulting on higher unemployment rates
(Castro et al., 2015).
The progressive deterioration of ageing both the base and the top of the pyramid
of ages, resulting from a decrease on the proportion of young people (under 15 years)
and an increasing on the proportion of the elderly population (65 and over),
respectively, illustrates the population dynamics in Portugal, reinforced by a low fertility
(it has decreased from 3.20 children per women on average in 1960 to 1.23 in 2014 ,
illustrating a level of lowest-low fertility) that does not ensure the level of generational
replacement (2.1 children per woman) and the recovery is not expected in the next forty
years (Carrilho & Craveiro, 2014). Consequently, the potential sustainability index19 is
expected to evolve from 330 in 2014 to 149 in 2060 (INE, 2014).
The relevance of economic environment evolution over time on PAYG systems
has also stressed by several authors. According to Piketty (2014), the PAYG pensions
systems, applied during the half of XX Century, were developed having into account high
19 Number of people aged between 15 and 64 years in percentage of the number of people aged 65 or more
11
demographic growth and economic growth rates near 5% in Europe. Nowadays, the
situation is different: the economic growth rate is 1.5% in rich countries, reducing at the
same proportion the PAYG accrual rates.
These developments will motivate capital outflows to developing countries with
younger population20 (Domeij & Flodén, 2006). Ludwig et al. (2012) referred a beginning
of a period of declining interest rates, increasing gross wages and decreasing
replacement rates, possibly aggravating the financial burden of pay-as-you-go public
pension systems. The impact on savings has been broadly discussed too, stressed by
Feldstein (1974) who reinforced the life-cycle hypothesis: providing income during
retirement, social security reduces savings during the working years, as well as capital
accumulation due to the increased taxes/levies on workers to finance pensions, which
reduces the total amount of physical capital that can be accumulated21.
PAYG pension systems bring challenges to governments: in periods of economic
crisis, followed by high unemployment, lower tax revenues and pension contributions
received may require governments to temporarily fund pension payments by issuing
public debt. While the ability of governments to honour their commitments on public
pensions is usually taken for granted andthe size of pension liabilities is not reported on
sovereign balance sheets, the ability of guaranteeing its compliance is questioned,
especially in long periods of economic shrinkage (Ramaswamy, 2012).
20 Obviously, the international capital are also dependent on other factors such as business cycle
fluctuations, long-term growth trends and volatile fiscal policy (Domeij & Flodén, 2006).
21 This idea was contested by Leimer and Lesnoy in 1982 (they found a programming error influenced
Feldstein’s outcome) and Barro in 1974, who argues that savings were not reduced but were shifted to bequests
12
Given these scenarios, it is important to have into consideration the trade-off
between sustainability of public finances and its adequacy. Due to the population ageing
and the public expenses increase, it could be inevitable to reduce benefits to
accommodate for the problem. This is, however, very difficult with regard to adequacy,
arising complaints that future pensioners will not receive enough income (European
Parliament, 2011). However, these objectives can be complementary, to the extent that
financial sustainability of a pension system is a necessary condition to ensure adequacy
in a long time horizon (Chybalski & Marcinkiewicz, 2014).
Cipriani (2013) tested anOLG model with PAYG pensions with exogenous fertility
and other with endogenous fertility, and he concluded that“if the pension tax rate and
the child-rearing cost are sufficiently high, a fall in fertility leads to an increase in
pensions, but an increase in longevity always affects negatively the public pensions [in
the first model]” (Cipriani, 2013, p. 254) and “if life expectancy increases, there is a fall
in fertility, which reinforces the ageing of population, and there is a consequent fall in
PAYG pensions [in the second model]”(Cipriani, 2013, p. 255). In other words, ageing and lower fertility can reduce the value of the pension paid to an old individual in
addiction to an increase in the number of pensioners.
The sensitivity of Social Security expenditures in relation to these kind of
phenomena is also highlighted in several studies. Andraz & Pereira (2012) referred that
the component of the social security budget sensitive to the business cycle (that is, the
evolution of GDP) is about 30% of the total spending, including mostly unemployment
benefits and different types of social action spending, which illustrates its strong
13
VAR model and data for the period 1970-200722 and they concluded that the possible
increases on Social Security total spending23 bring negative effects on both labour
markets and financial markets, caused by higher unit labour costs, higher
unemployment rates and lower saving rates, resulting on a negative impact on GDP
(marginal product of 2.40, 1.70, -0.28 and -2.90, respectively24).
The European Commission Ageing Report (2015) also stressed several
demographic impacts (and economic ones) on Portuguese public pension expenditures
to GDP:
TABLE I - AGEING REPORT SENSITIVITY TESTS (2013-2060)
Scenarios Impact on
Pensions/GDP
The Biggest Impact in European Union?
An increase of life expectancy at birth. + 1 p.p.25 Yes 20% less net migration. + 0.25 p.p. No A higher employment rate of older workers (for
age group 55-74) of 10 p.p., introduced up until 2025.
- 0.7 p.p. No
A higher employment rate (for age group 20-64) of 2 p.p..
- 0.3 p.p. No
A permanent increase of 0.25 p.p. in the labour productivity growth rate.
- 1 p.p. No
A permanent decrease of 0.25 p.p. in the labour productivity growth rate.
+ 1 p.p. Yes
A lower Total Factor Productivity growth - convergence to 0.8% in 2060 compared to 1% in the baseline scenario.
+ 1.2 p.p. Yes
An automatic link between early and statutory retirement ages and life expectancy, starting from the base year.
- 0.35 p.p. No
Source: European Commission (2015).
22 This analysis does not encompass the reforms applied in 2007.
23 It encompasses retirement pensions for both private and public sector employees, their dependents and
their survivors, as well as unfunded social benefits and social assistance programs.
24 With an increase of 1 percentage point (p.p). on the ratio of social security spending to GDP, the unit
labour costs increase 2.40 p.p., the unemployment rate increases 1.70 p.p., the saving rate decreases -0.28 p.p. and the GDP decreases 2.90 p.p..
14
In spite of the existence of a sustainability factor in Portuguese public pension
system which provides an automatic pension spending stabilization, the impact of an
increase of life expectancy at birth is extremely high, but the impacts caused by changes
in employment (less pensioners, less pensions and less inactive population, causing a
positive effect on GDP growth) and productivity are more significant in these sensitivity
tests, intensified by the fact that Portuguese pensions are not fully indexed to wages
after retirement, and consequently higher labour productivity growth leads to a faster
GDP and labour income growth than pension growth. Through the analysis of this
impact, the overall effect projected is a decrease of gross public pension expenditure in
Portugal of 0.7 p.p. in period 2013-2060 (European Commission, 2012; 2015; Portugal
Stability Program, 2015). The OECD Pensions at a Glance (2015) reinforces these
projections, highlighting the importance of demographic factors such as the old-age
dependency ratio, projecting an increase of 38.1 p.p. for Portugal between 2015 and
2050. Nevertheless, cuts in benefits for future retirees, through lower indexation and
valorisation or benefit formulae with increases in the minimum age allowed to claim
pension benefits, will reduce growth in public pension expenditure. Hence, these
measures can act as stabilizers of effects of ageing.
The Bank of Portugal (2015) has also addressed the demographic transition in
Portugal and its connections with economic growth, using a growth accounting
approach and a Cobb-Douglas production function logarithm with isolated demographic
evolution impact. The projections highlighted an extremely negative impact of pure
demographic evolution (measured by the ratio between 15-64 population and total
15
of human capital (with an average number of schooling years reaching 11 in 2060 caused
by a catching-up effect in relation to other developed countries) largely offsets the
negative contribution of pure demographics during this period. In cumulative terms,
their contribution amounts to 16.9 p.p. in 2050 and 18.2 p.p. in 2060. With regard to the
employment rate, its contribution is particularly strong during the first ten years,
reflecting a reduction of 14.8% of unemployment rate in 2015 to 8.9% in 2025. Later,
this contribution becomes relatively small, such as the activity rate over the entire
period. Consequently, it is possible to conclude that the adverse impact on growth
resulting from demographic trends will coexist with a favourable impact of the higher
qualification of the workforce (Bank of Portugal, 2015).
According to these sensitivity tests, population dynamics and productivity of
labour assumes a huge relevance on public pension expenditures. Using the Solow
production function
,
Castro et al. (2015) concluded that all the countries deal with apossible slowdown of technical progress, converted into the quality of life.
Consequently, and dealing with a stagnation of the Portuguese population, it is expected
a positive rate of growth of technical progress (in a broad sense) of 1.5% (European
Commission, 2015; Castro et al., 2015) and a GDP per capita growth until 1.4-1.5% over
the whole period 2013-2060 in European Union, with a possibility of countries like
Portugal being affected by country specificities, such as cyclical developments, periods
of (protracted) economic adjustment and catching-up effects (European Commission,
2015).
16
The change of demographic pattern has arisen an inversion of the relationship
between demography and economics: from ancient times to nowadays, the issue is to
know how economic growth allows the increase of population and, more recently, the
living standards; in the future, policy makers will need to know whether the
demographic evolution allows the continuation of economic growth (Castro et al.,
2015).
Halmosi (2014) highlights that all European Union Member States, facing ageing
and the 2008 economic crisis, applied quick and drastic measures which did not favour
systemic pension reforms; in fact, some studies referred that ageing can contribute to a
possible future financial crisis. In the Portuguese case, which came to the crisis with
reformed systems that were supposed to deal with increases in spending (sustainability
factors and longevity indexation), should set up further reforms (Grech, 2015), needing
additional measures pointed by several authors such as the reduction of current
benefits26. Assessing the impact of pension cuts in Portugal, Spain and Italy, opinions
differ: Matsaganis et al (2014) present evidence that pension cuts had a varied
distributional impact, being some of these changes progressive. By contrast, Natali &
Stamanti (2014) refer that expenditure control measures jeopardize the future
adequacy, causing problems of inequality, risk individualization and increasing
vulnerability to external shocks.
Assuming macroeconomic impacts on a PAYG Portuguese Social Security system,
Garcia & Lopes (2009) argued that some measures such as a changing of indexing rules,
26 These measures are susceptible to cause social conflicts due to the low average pension values, justifying
17
a better actuarial match between pensions and contributions and measures to increase
the effective age of retirement could have a bigger impact on reducing the expected
increase in pension expenditure, and applying a pension reform in isolation can only
have a less effective impact on reducing it. Using a macroeconomic model of the
Portuguese economy, the tests suggest that the elimination of early retirement schemes
combined with an increase in effective contribution rate could be a good alternative,
promoting the financial sustainability of the Social Security System and economic
growth strengthened by a reserve fund (such as Social Security Reserve Fund, which
presents an average annual nominal rate of return of 5.17% during the period
1989-2014 with relatively low administrative costs compared with other public pension
reserve funds), bringing more advantages in relation to a fully pre-funded system (Garcia
& Lopes, 2009; Garcia, 2014; IGFCSS, 2014), with too much high transition costs such as
the payment by current tax payers of both existing pensioners and again to fund their
own pensions (European Parliament, 2011).
These transition costs and the challenges associated to the maintenance of a
PAYG pensions system have motivated an important question: could a pensions system
be left to voluntary decisions and private insurance, with no need for government
involvement? Barr & Diamond (2006) argued that such possibilities are insufficient:
firstly, economic agents have to deal with imperfect information, missing markets, risk,
uncertainty and progressive taxation, which should be attenuated by public
intervention. Secondly, public policy cares about poverty relief and redistribution
18
Nevertheless, highlighting the advantages of a possible transition of the system,
the European Parliament (2011) reinforced that the PAYG pension systems can be
advantageous during periods of economic growth, but, being economic growth a
function of the rise in productivity, the amount of capital employed and the size of the
workforce, if the latter decreases, it will be harder for the real economy to grow in the
foreseeable future. Besides, PAYG financing encompasses higher transfers of wealth
from future to present generations due to the increase of contribution rates in order to
match current pension expenditures in relation to funded systems, where the return of
fund´s assets reduces the required amount of contributions (Van den Noord & Herd,
1993).
So, financial markets seem to be a good alternative, to the extent that it is
possible to find higher returns than the contribution from the growth in the real
economy: the differences between the average rate of return of capital (between 4.5%
and 5% in the XXI Century) and economic rate of growth (1.5%) reinforce this point.
However, Piketty (2014) added an important critique: in spite of the rates of return in
the financial markets (capital rates of return) surpass the wage progress, the wage
evolution is 5 to 10 times less volatile, turning the total application of contributions on
financial markets too risky27.
Concerning possible pension reforms, Diamond (1996) suggested an indexation
of normal retirement age to life expectancy28 and the investment of part of the trust
27 The 30´s Great Depression and 2008 financial crisis are sound examples of this volatility, generating big
losses for those who applied great amounts of retirement contributions on financial markets (Piketty, 2014).
28 This measure was already implemented in Portugal: the normal retirement age was 66 years in 2014, but
19
funds in the private economy (taking advantage of higher rates of return with caution in
relation to higher risks comparing to government bonds, which present greater
liquidity29). On the contrary, replacing part of Social Security with individual accounts
leads to high administrative costs and higher taxation, and replacing all of Social Security
with individual or firm mandates seems to be expensive, caused by administrative costs,
problems of cashing-out or bad investment decisions (Diamond, 1996). Regarding the
evolution of life expectancy, evidence from other countries like Spain suggests that the
sustainability factor should be linked to other factors such as employment or
dependency rates, and not only to life expectancy, in order to clarify which can really
influence the financial health of the pension system. Reinforcing such factor, increasing
the retirement age, extending the pension calculation period and increasing the number
of contribution years required to be entitled to 100% of the regulatory base, can stabilize
pension expenditure, at least during the application of such reforms (Doménech & de la
Fuente, 2011).
Measuring some policy measures to stress the fiscal challenge of shrinking
populations, Clements et al. (2015) studied the impact of some policies in developed
and undeveloped countries. The evidence suggests that encouraging bigger birth rates
could reduce the evolution of ageing and fiscal costs, but the effects seem to be modest
for most countries. Pro-migration policies would reduce age-related expenditures on
long-term, but it is not enough to extinguish the impact of ageing in more developed
countries. Raising labour force participation rates (especially for women and older
29 However, government bonds are subject to lower rates of return and vulnerability in relation to certain
20
workers) can increase production increasing the workforce, which would mitigate or at
least delay some of the projected impact from ageing. At last, some measures such as
raising retirement ages, reducing pensions relative to wages, increasing taxation of
pensions for upper income groups and increasing pension contributions could promote
the sustainability of public pensions and it should start now, although gradually so.
More recently, using a dynamic general equilibrium model (with an OLG à la
Blanchard-Yaari30 and hand-to-mouth pensioners to simulate the Portuguese
demographic structure), the European Central Bank (2015) tested the impact of a
two-year increase in the retirement age, a permanent cut in the pension replacement ratio
by 15% and an increase in the consumption tax by 1 p.p.. The first measure can reduce
the share of old-age pensioners and increase overall social security contributions,
enlarging their base and stabilising the impact of the ageing population on labour supply,
per capita consumption and real GDP31. The second measure produces better results
than the first one, because cuts in the replacement ratio reduce the old-age pension
expenditure, the government spending and the required increases in social security
contribution rates (combined with the first measure, the overall impact of ageing can be
positive in the short run, and close to nil over the medium run). The third measure does
not provide significant evidence.
4. Data and Methodology
4.1. Data Description
30 See also Blake (2006).
21
In order to stress which variables have a relevant influence on the Portuguese
social security system pension expenditure, the chosen ones were selected having into
account the studies analysed previously, particularly theEuropean Commission Ageing
Report (2015). As the analysis will be developed in the Portuguese case, only time series
data will be used in this work.
The dependent variable that will be stressed is pension spending by General
Social Security System on elderly, disability and survival support as a share of GDP at
current prices (pensions_to_gdp). It is a smaller component of total pension
expenditures analysed by the European Commission Ageing Report (2015), OECD
Pensions at a Glance (2015) and Chybalski (2014), but with more available yearly
observations. The time-series data from 1975-2014 was chosen as a result of the
limitations concerning the absence of more available observations during the research.
Regarding the possible factors affecting the level of pension expenditures, and
the availability of statistical data, the following explanatory variables were organised in
groups:
TABLE II – BRIEF DESCRIPTION OF THE EXPLANATORY VARIABLES3233
32 The Lun15_64 and LAPL variables are presented in a logarithmic form in order to normalize and smooth
the deviations and to help the coefficients interpretation, identified with L.
33 The dummy variables assume the value 1 after the structural changes not only to measure their impacts
in the following years, but also in order to avoid problems concerning the econometric specifications.
Group Variables Description Unit Source
Demographics OAD Old age dependence Index Percentage PORDATA (2015)
Labor Market Lun15_64 Logarithm of unemployed persons aged 15 to 64 Individuals PORDATA (2015)
22
TABLE III – DESCRIPTIVE STATISTICS OF THE VARIABLES
Source: Eviews 9 Output
The OAD (number of elderly persons aged 65 and over per 100 persons of
working age - from 15 to 64 years old) quantifies the impact of demography through the
connection between old age and working age on pensions_to_gdp (European
Commission, 2015).
The un15-6434(all individuals aged between 15 and 64 years old without job and
available for work, having actively sought paid or unpaid work in the last 30 days, on
strict sense)can be useful to stress the impact of unemployment on pensions. In PAYG
systems, the unemployment contributes for the unsustainability of pension systems,
shrinking the contribution base, at least in the short term (European Commission, 2015).
The APL (real GDP in terms of expenditure at constant prices of 2011 per annual
hours worked by employed people), as stressed by Castro et al. (2015), can present
enough potential to overcome the negative effects of ageing.
34 This variable is a proxy of unemployment in the absence of more available data concerning the
23
Regarding dummy variables, Andraz & Pereira (2012) analysed the possible
existence of four structural breaks during this sample period: Revolution of April 1974
(important social and economic changes during the second half of the 70´s), First Social
Security Act of 1984 (the great expansion of beneficiaries and more generosity
concerning the benefits), the Social Security Reform of 1993 (equality between women
and men in relation to the retirement age and several changes in pension calculation)
and the Third Social Security Act of 2002 (revocation of the Second Social Security Act in
2000, concerning new changes of pension calculation and a new General Social Security
institutional organization). In this work, the significance of these structural breaks will
be also analysed, adding the Fourth Social Security Act in 2007 (introduction of the
sustainability factor, which introduced an important change on pension calculation
concerning the increasing of life expectancy).
The descriptive statistics of the variables are specified in Table III.
If the purpose is to analyse the relationship between several variables using a
regression model, it is important to assume some stability through time: if this
relationship was arbitrary in each period, it would not be possible to know how a
variable affects another only with a unique process realization (Wooldridge, 2009).To
test for stationarity, the conduction of unit root tests is needed.
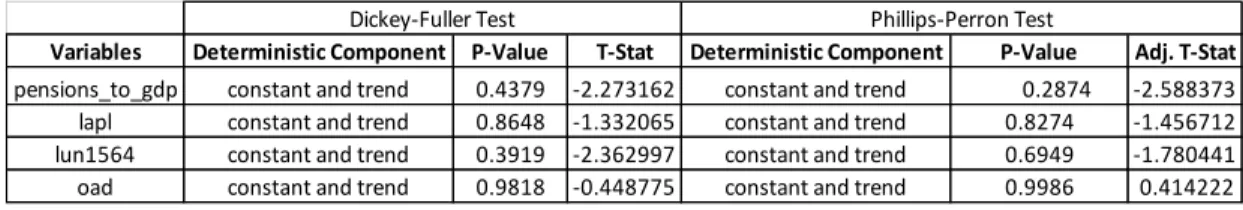
TABLE IV – UNIT ROOT AUGMENTED DICKEY-FULLER AND PHILLIPS-PERRON TEST´S RESULTS
Source: Eviews 9 Output
Variables Deterministic Component P-Value T-Stat Deterministic Component P-Value Adj. T-Stat
pensions_to_gdp constant and trend 0.4379 -2.273162 constant and trend 0.2874 -2.588373 lapl constant and trend 0.8648 -1.332065 constant and trend 0.8274 -1.456712 lun1564 constant and trend 0.3919 -2.362997 constant and trend 0.6949 -1.780441 oad constant and trend 0.9818 -0.448775 constant and trend 0.9986 0.414222
24
TABLE V - UNIT ROOT AUGMENTED DICKEY-FULLER AND PHILLIPS-PERRON TEST´S
RESULTS WITH FIRST DIFFERENCES
Source: Eviews 9 Output
Following the methodology adopted by Brooks (2014), the chosen tests were the
Augmented Dickey-Fuller test and Phillips-Perron test (Table IV and V). The p-values
analysis of both tests suggests that the null hypothesis of the presence of a unit root
cannot be rejected in all variables at 10% significance level, but the stationarity is
achieved with first differences through the rejection of the same null hypothesis at 5%
significance level, highlighting their strong persistence (I(1) process).
4.2. Adopted Methodology
To estimate the impact of Lun15_64, LAPL and OAD on pensions_to_gdp, it is
intended to stress the following function:
(1) 𝑝𝑒𝑛𝑠𝑖𝑜𝑛𝑠_𝑡𝑜_𝑔𝑑𝑝𝑡
= 𝛽0+ 𝛽1𝐿𝑢𝑛15_64𝑡 + 𝛽2𝐿𝐴𝑃𝐿𝑡+ 𝛽3𝑂𝐴𝐷𝑡+ 𝛿0𝑟𝑒𝑣1974𝑡
+ 𝛿1𝑟1984𝑡+ 𝛿2𝑟1993𝑡+ 𝛿3𝑟2002𝑡+ 𝛿42007𝑡
The finding of non-stationarity may turn the potential econometric results
statistically invalid. Typically, the linear combination of I(1) variables will be I(1), but it is
desirable to obtain I(0) residuals which are only achieved if the linear combination of I(1)
variables will be I(0), that is, if the variables are cointegrated (Brooks, 2014).
Variables Deterministic Component P-Value T-Stat Deterministic Component P-Value Adj. T-Stat
pensions_to_gdp constant 0 -6.227754 constant 0 -6.239673 lapl constant and trend 0.0166 -4.013996 constant and trend 0.0166 -4.013996 lun1564 none 0.0002 -3.971594 none 0.0002 -3.971594 oad constant and trend 0.0045 -4.533609 constant and trend 0.004 -4.580826
25
Regarding the hypothesis of the existence of more than one linearly independent
cointegration relationship between more than two variables, it is appropriate to stress
the issue of cointegration using the Johansen VAR test, as recommended by Brooks
(2014).
To develop the Johansen VAR framework, the selection of the optimum number
of lags is needed to avoid problems of residual autocorrelation, using theVAR Lag Order
Selection Criteria (Table VII). The Likelihood Ratio Criteria (LR),Final Predictor Error (FPE)
and Hannan-Quinn Information Criteria (HQ) selected two lags as an optimum limit,
against the evidence of Akaike Information Criteria and Schwarz Information Criteria
(SC), which presented the optimum selection of three and one lag, respectively.
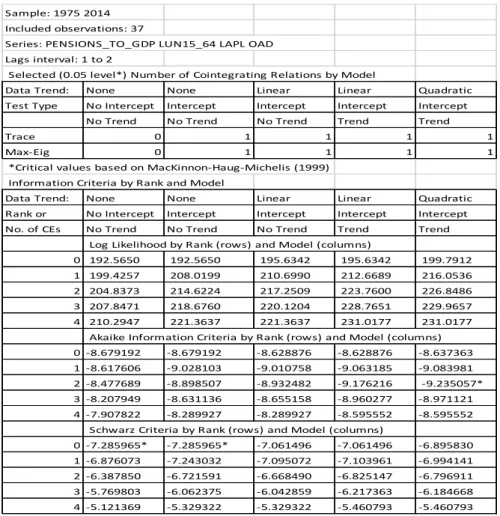
The Johansen Cointegration Test allows to select the appropriate lag length and
model to choose (Table VIII and IX), and the evidence suggests that the number of
appropriated lags is two (as referred before) with one cointegrating vector, and the
model to adopt consists on the allowance of a quadratic deterministic trend, with
intercept and trend in the cointegration equation and intercept in VAR, following Akaike
Information Criteria (Brooks, 2014).
It was decided to use an error correction model “incorporated” into a VAR framework in order to model the short and long run relationships between variables: a
Vector Error Correction Model (VECM). The VECM can be set up in the following form
(Brooks, 2014):
(2) ∆𝛾𝑡 = П𝛾𝑡−𝑘+ 𝛤1∆𝛾𝑡−1+ ⋯ + 𝛤𝑘−1∆𝛾𝑡−(𝑘−1)+ 𝑢𝑡35
35П= (Σ
𝑖=1
𝑘 𝛽
26
This VECM is composed by first differenced g variables on the LHS, and k-1 lags
of the dependent variables (differences) on the RHS, each with a Γ short-run coefficient
matrix. П consist on a long-run coefficient matrix, since in equilibrium, all ∆𝛾𝑡−𝑖 = 0, and establishing 𝑢𝑡 with the expected value of zero it implies thatП𝑦𝑡−𝑘= 0. П illustrates the speed of adjustment back to equilibrium, that is, it measures the proportion of last
period´s equilibrium error that is corrected for (Brooks, 2014).
The VECM model is illustrated in Table XI36. Figure 8 shows that the model is
stable, because all inverse roots of characteristic polynomial are inside the unit circle.
The residuals assumptions were tested, and it is possible to verify that the mean
of the residuals is almost zero (Table XII), the White Heteroskedasticity Test p-value does
not allow the rejection of homoskedastic residuals (Table XIII), the covariance between
residuals and explanatory variables are almost zero, satisfying the assumption of no
relationship between them (Table XIV), the residuals are normally distributed (Table XV)
and the null hypothesis of no residual serial correlation is not rejected at 5% significance
level with the use of two lags (Table XVI).
As such, the estimators are efficient, and the confidence intervals and hypothesis
tests using t and F-statistics are reliable.
5
.
Results5.1. Cointegration Equation
The presence of a cointegrating vector illustrates an equilibrium phenomenon,
since it is possible that cointegrating variables may deviate from their relationship in the
27
short run, but their association would return in the long run (Brooks, 2014). Then, it
exists a long-run relationship between the analysed variables, illustrated by the
following normalized cointegrating model, without dummy variables37:
(3) pensions_to_gdp= 1.320370 Lun15_64 + 1.818858 LAPL - 0.221652 OAD
(0.16300) (0.93573) (0.08153)
At first sight, it is admissible to think that in Equation 3 the long-run relationship
between OAD and pensions_to_gdp does not make sense. The negative coefficient
induces that, with the remain variables constant, an increase of 1 p.p. in OAD will cause
a decrease of 0.221652 p.p. on pension expenditure to GDP on average, seeming to be
contradictory: how the increase of old people (or the decrease of young people) can
cause a decrease of pension expenditure as a share of GDP?
It is possible to extract some possible interpretations from the negative OAD
long-run coefficient. Assuming that in the future old people will work more years due to
several factors such as the indexation of the official retirement age to life expectancy or
an individual option to work beyond the retirement age, an increase of old people does
not compulsorily imply an increase of pension expenditure as a share of GDP in the long
run, contradicting the mainstream literature about pension spending and other research
sources such as OECD (2015) and European Commission (2015).
In fact, the indexation of the official retirement age to life expectancy has been
supported by several authors analysed before such as Clements et al. (2015) or Diamond
(1996) as a crucial measure to guarantee the financial sustainability of Social Security,
smoothing the impact of an ever increasing number of pensioners. Moreover, if the
28
knowledge and accumulated experience provided by old people were exploited in an
industrialized society as referred by Rosa (1996), it would be possible to increase the
effective retirement age, extending the contributory career. Other possible reason can
be the fact that ageing can have a stronger impact on the pension value than on GDP in
the long run, which can be explained by successive reforms reducing pension
entitlements such as the sustainability factor, that is, in spite ofPortuguese pensions are
not fully indexed to wages after retirement (European Commission, 2015), the applied
reforms by Portuguese Government cause a bigger reduction on pension payments than
a probable reduction on GDP caused by ageing (Andraz & Pereira, 2012).
The remaining long-run coefficients seem to be reliable. The positive long-run
coefficient of Lun15_64 shows that, letting the remain variables constant, an increase
of 1% on unemployed people aged between 15 and 64 years old causes an increase of
1.320370/100 = 0.01320370 p.p. on pension expenditure to GDP on average,
corroborating the common interpretation about the negative effect of unemployment
on any pension system supported by the analysed authors. High unemployment leads
to negative migratory balances (affecting mostly the young people), aggravating the
ageing process and consequently the demographic declining. With less people, the
investment decreases, shrinking the economic growth38 (Castro et al., 2015)
Regarding the LAPL long-run coefficient, the evidence suggests that, letting the
remain variables constant, an increase of 1% on APL results on an increase of
1.818858/100 = 0.01818858 p.p. on pension expenditure to GDP on average. It implies
38 The causality from ageing and unemployment to productivity are confirmed by a VEC Granger Causality
29
that APL has a stronger impact on pension growth than GDP growth, contradicting the
European Commission (2015) approach. Nevertheless, these results reinforce the
importance of APL on pension growth and support the hypothesis that, in the future,
the transfer rate from wages to pensions will increase, being that structural change a
requirement when the ratio between old people and people of working age increases
significantly (Castro et al., 2015).
The fact that OAD presents a negative relationship with pensions_to_gdp arises
the hypothesis of a spurious result. As such, it was developed a Johansen Cointegration
Test with dummy variables (Table X), with the problem that critical values may not be
valid with exogenous series such as dummy variables. With this new test, the OAD
long-run coefficient is positive and the sign of the remain coefficients does not change, that
is, an increase on OAD causes an increase on pensions_to_gdp as has been supported
by the analysed authors, turning the results more credible: less contributions combined
with an indirect negative impact on potential economic growth through the decrease of
labour supply increase the burden of pension expenditures to GDP (Portugal Stability
Program, 2015). However, it is important to have into account the econometric
limitations of this change.
5.2. VECM Model Coefficients
To derive the VECM p-values, it was developed the VECM model with the
coefficients as C(1) until C(16) (Table XVII). C(1) is the coefficient of the cointegration
equation (as well as the speed of adjustment back to equilibrium), C(10) is the constant,
30
and C(12) until C(16) are the coefficients of the dummy variables. C(11) is the trend
coefficient (Brooks, 2014).
Looking at C(1), it is negative and statistically significant at 5%, confirming the
long-run relationship between pensions_to_gdp, Lun15_64, LAPL and OAD and the
existence of a correction mechanism of deviations (Wooldridge, 2009). Developing the
Wald Tests (Table XVIII), it is not possible to reject the null hypothesis of C(4)=C(5)=0,
C(6)=C(7)=0 and C(8)=C(9)=0, and the conclusion to be stressed is the absence of
short-run causality short-running from Lun15_64, OAD and LAPL to pensions_to_gdp.
Regarding the short-run coefficients of the dummy variables, only the revolution
of April 1974 (at 10% significance level) and the 1993 Social Security Reform (at 5%)
present statistical significance, and the negative coefficients illustrate each contribution
to the decrease of pension expenditure as a share of GDP: the possible causes can be
the high average real GDP growth rate after 1976 until 1979 of 5.4% in the first case
(PORDATA, 2015) and the implementation of the same official retirement age between
men and women, as well as the increase of the minimum contributory period from 10
to 15 years in the latter case (Segurança Social, 2015) .
5.3. Impulse – Response Functions
At last, it was stressed the impulse-response functions and the variance
decomposition for pensions_to_gdp, strongly dependent of the Cholesky ordering
which does not follow a specific requirement (Brooks, 2014). In order to guarantee some
31
the most exogenous variable to the most endogenous one, determined by a VEC
Granger Causality Test39.
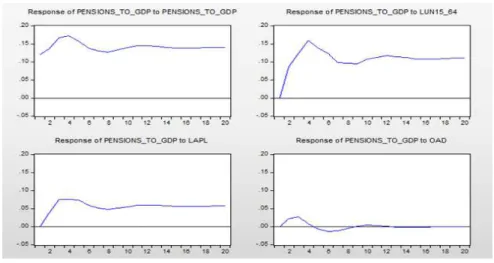
The adopted order is as follows: OAD, Lun15_64, pensions_to_gdp and LAPL.
Source: Eviews 9 Output
FIGURE 4 – RESPONSE TO CHOLESKY ONE STANDARD DEVIATION INNOVATION Following Brooks (2014) methodology, Figure 4 gives the impulse responses for
pensions_to_gdp, regarding several unit shocks to OAD and Lun15_64 and their impact
during 20 periods (years) ahead. Considering the signs of the responses, innovations to
OAD have a positive impact until the 5th year, achieving its peak in the 3rd year. After
that, the impact is negative, but the effect of the shock ends up dying down. A standard
deviation shock to Lun15_64 and LAPL has always a positive impact on pensions_to_gdp,
reaching its peak in the 4th and 3rd year, respectively, stagnating in the long-run. At last,
the own innovations to pensions_to_gdp register a similar impact in relation to
Lun15_64, that is, reaches the peak in the 4th year and a stagnation thereafter.
39 The higher the p-value, the greater the exogeneity of the variable. The other ordering possibilities were
32
Analysing this approach, the main highlight is the fact that OAD registers an
almost irrelevant contribution for the evolution of pensions_to_gdp in the long-run
comparing with the remain variables, surpassed by the contributions of Lun15_64 and
LAPL, reinforcing the doubts about the contribution of ageing on pension expenditures.
It is also possible to verify the relevance of unemployment in the presence of a positive
shock immediately in the first years (as stressed by the European Commission (2015))
and in a 20-year forecasting horizon (positive but constant impact), shrinking the
contributory base and the economic growth, and a similar pattern in relation to the
apparent productivity of labour, guaranteeing higher pension entitlements.
5.4. Variance Decomposition
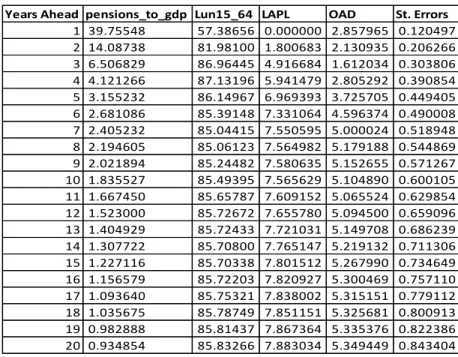
TABLE VI – VARIANCE FOR THE PENSIONS_TO_GDP RESIDUALS
Source: Eviews 9 Output
Accessing Table VI, it is possible to verify that, in the 20-year forecasting horizon,
the OAD shocks account for only around between 2.86% and 5.35% of the variance of
the pensions_to_gdp and Lun15_64 contributes between 57.87% and 85.83%,
Years Ahead pensions_to_gdp Lun15_64 LAPL OAD St. Errors
33
reinforcing the huge importance of unemployment on pension expenditure and the
reduced impact of ageing comparing with the remain variables. It is also important to
stress the own shocks of pensions_to_gdp, which accounts between 0.93% and 39.76%
of its movements40.
6. Conclusions and Future Research
Regarding the VECM model and the results obtained (taking into consideration
certain aspects such as non-stationarity, cointegration and residuals testing), the
evidence suggests that unemployment, apparent productivity of labour and old-age
dependence index jointly present a long-run relationship with pension expenditure as a
share of GDP, but not in the short-run.
The unemployment is crucial to explain the increase of pension expenditure as a
share of GDP, as reinforced by the analysed authors and the mainstream literature about
pensions. This interpretation is illustrated by the variance decomposition of
pensions_to_gdp and the impulse-response functions.
The apparent productivity of labour has also a positive impact on pension
expenditure to GDP according to the results stressed in this work, conflicting with
studies stressed by the European Commission (2015), which supports the assumption
that GDP growth is bigger than pension growth in Portugal due to the fact that the
Portuguese pensions are not fully indexed to wages after retirement.
40 These results, however, need to be analysed carefully: if the order of variables changes, the results of
34
The most intriguing result concerns the old-age dependence index: after the
development of one Johansen Cointegration Test without dummy variables and other
with dummy variables, the OAD long-run coefficient presents different signs, arising the
hypothesis that ageing may not be a “catastrophic” factor which jeopardizes the
financial sustainability of the Portuguese Social Security System (as Castro et al. (2015)
pointed out). This fact is corroborated by the almost irrelevant influence of OAD (in the
long-run) on the impulse-response-functions, but the empirical evidence found by the
majority of the analysed authors contests such conclusion.
This overall analysis needs to be assessed with caution since this work presents
some limitations, such as a small time series (40 years) and different results regarding
the different econometric techniques adopted, and challenges concerning the choice of
the appropriate variables to determine the impacts stressed by the analysed literature
and the choice of a suitable econometric model to take the statistical characterization
of the variables into account.
Further research on this topic could be, for instance, the choice of different
explanatory variables or a different econometric model to see if the previous results still
hold, a profound study assessing the impact of ageing on Portuguese pension
expenditures (in order to clarify the doubts arisen in this work) in the long-run and a
deep analysis about the role of the apparent productivity of labour as a possible