R E P O R T
A DISTRIBUTION SURVEY FOR OTTERS ALONG A RIVER IN
CENTRAL BHUTAN
Prakash CHETTRI1* and Melissa SAVAGE2
1
Department of Forestry, Bhutan. e-mail: [email protected] 2
University of California, Los Angeles, CA, USA. e-mail: [email protected] * Corresponding author
(Received 24th March 2014, accepted 15th July 2014)
Abstract: We report the findings of a survey for otters along a major river in central Bhutan. The river bears various names in different stretches along its run, including Mochhu, Phochhu, Punatsangchhu and Sunkosh. We report: 1) the distribution and density of otter sign, including tracks, scats, latrines and dens, 2) the correlation between sign abundance and vegetation and substrate characteristics, and 3) the correlation of otter sign with human disturbance. Five of the six 5.5 km transects sampled were positive for otter sign. The one transect with no otter sign was the site of a recent severe flood event. Linear sign density was 9.4 sign km-1 along one bank of the river, with a mean of 45% of two sample rounds positive for presence of otter sign in sample plots. The Kamichhu site possessed the highest percentage of positive plots at 95%, and the Sunkosh site the lowest at 35%. The number of otter sign was positively correlated with bankside vegetation and with sandy beaches with large boulders. Human disturbance also influenced the density of otter sign, with proximity of settlements, represented by the presence of footpaths, grazing and trash, apparently deterring otter presence. Three species of otters likely occupy the rivers of Bhutan (Lutrogale perspillata, Lutra lutra, and Aonyx cinereus) but since altitudinal niche partitioning by these species is not understood in the study area, we make no attempt to predict distribution by species. Only one otter species, a smooth-coated otter (L. perspicillata) was directly sighted.
Key words: Lutrogale perspillata, Bhutan, habitat, human disturbance
INTRODUCTION
and abundance of otters is needed to formulate local and national conservation plans (MacDonald and Mason, 1994).
Bhutan is an exceptionally rugged and mountainous country. The country's position on the southern slopes of the Himalaya range results in a huge drop in elevation on a north-south axis of ~ 145 km, from the highest point, at 7, 570 masl in the peaks along the border with China to the north, to 98 masl, in the lowlands at the border with India to the south. Some of the highest mountains in the world dominate the north of the country, where climate is severe year-round. Below the Himalayas lie temperate highlands which experience a strong monsoon season in mid-summer. At low elevations in the south, lie subtropical savannas and grasslands, which have been largely converted to agricultural production.
The snows and glaciers of the high Himalaya provide a series of generous parallel rivers with steep descent over this landscape. This gives the country a wide variety of natural habitats and climatic conditions, and high levels of biodiversity. Over 40% of the area of the country has been designated as natural protected area, and further areas are under consideration for designation as wildlife corridors between reserves. Hunting of any kind is prohibited, and a serious effort is made to patrol these large protected areas. While many reserves are inhabited by people, settlements are small and scattered. Arable land constitutes only 2.5% of the country (World Bank 2014). The Bhutanese government has consistently shown a commitment to wildlife protection and is concerned about the pressure on wildlife in the surrounding region (Rinzin et al. 2009).
Otter populations are declining throughout Asia and the Himalayan region (e.g., de Silva, 2007; Kafle, 2009), subject to intensifying pressures of expanding human populations, fragmentation of habitat, declining water quality, loss of an adequate prey base, and intensifying pressure from the pelt trade (Foster-Turley et al., 1990; Yoxon, 2007). The rivers of Bhutan offer abundant clean river habitat for otters. Although no studies have been conducted on the issue, the greatest threat in Bhutan at this time may be the current and planned construction of multiple hydroelectric power facilities. Ninety-one potential hydropower sites for run-of-the-river generation facilities have been identified in the country (Uddin et al., 2007). A drop of nearly 8,000 m in fewer than 200 km generates huge hydraulic force in numerous rivers, providing a clean energy source and a significant asset that the government has recently begun to tap for domestic supply and for export to India. The construction of these facilities, with high head dams and reservoirs, has the potential for negative impact on the habitat continuity and foraging base of otters, although Pedroso et al. (2007) suggest that otters can successfully use reservoirs for foraging. Two of the largest hydropower projects in the country, the Punatsangchhu Hydro Power Authority I and II, are now under construction on the river surveyed in this study (Rahaman and Varis, 2009).
This study presents data on the distribution of otter activity sign along the Phochuu/Punakha/Sunkosh River, the second longest river system in the country, flowing from the north to the south through central Bhutan to its confluence with Brahmaputra River in India (Choden, 2009). We had three objectives: 1) to document the distribution and density of otter sign - tracks, scats, latrines, and dens, 2) to correlate vegetation and bankside strata with otter sign, and 3) to correlate human disturbances with otter sign.
METHODS
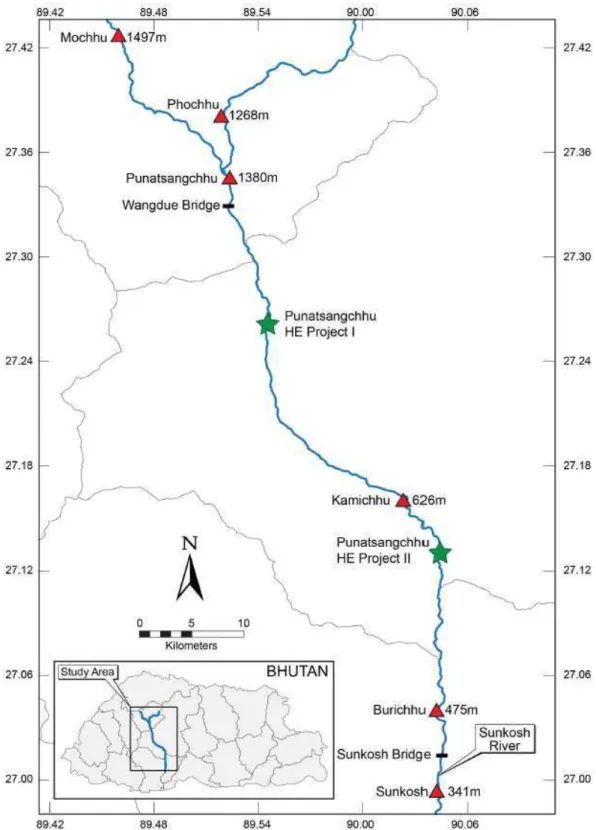
Sunkosh stretches (starting point of each study stretch was: Mochhu: 27°38'02.1"N, 089°51'50.8"E [1268 masl]; Phochuu: 27°42'39.5"N, 089°45'56.3"E [1497 masl]; Punatsangchhu: 27°34'30.7"N, 089°52'20.3"E [1380 masl]; Kamichhu: 27°15'58.77"N, 90° 2'18.84"E [626 masl]; Burichhu: 27°03'57.0"N, 090°04'10.0"E [475 masl]; Sunkosh: 26°59'18.2"N, 090°04'09.9"E [341 masl]) (Figure 1). The Kamichhu stretch was located between two hydroelectric facilities under construction, 22 km downstream from Punatsangchuu I and 5.5 km upstream from Punatsangchuu II (Figure 1).
Forest cover was dominated by temperate broadleaf forest along the upper portion of the study area, dry Chir pine (Pinus roxburghii) forests along the middle portion, and subtropical broadleaf vegetation in the lowest portion (Figure 2,3). Annual precipitation varies from 400 to 600 mm in the upstream section, 700 to 900 mm for the midstream region and more than 2000 mm in the southernmost region (Choden, 2009). No transects were located close to the two hydroelectric facilities and dam under construction, where the river is currently diverted from its channel.
Figure 2. The high-energy Punatsangchhu/Sunkosh River drains a large portion of the high Himalaya, and flows on a steep north-south gradient through narrow valleys.
Observations of tracks, scats, latrines, and dens were recorded in each of the six study stretches in plots along a transect on the riverbank parallel to the river. Ten plots measuring 100 m x 10 m, were located 500 m apart along each 5.5 km transect, for a total of 60 plots. Thus, a one linear kilometer transect was sampled within each of the six study stretches, with varying distances between transects (Figure 1). The sampling design modifies the methodology of Macdonald and Mason (1983) who investigated the distribution of scats as a measure of Eurasian otter activity on a river in Wales, and Nawab and Hussain (2012), who surveyed smooth-coated otters on a river in the upper Gangetic plain. Otter sign was identified by reference to Wangchuk et al. (2004), and by the presence in the fish bones and crab fragments in scat. No attempt to distinguish the species of otters present by differences in sign. Study stretches were selected during a reconnaissance trip to locate otter sign, and based on reports of otter presence by local residents.
The seasonal flow of the river is highly variable, with the highest flow during the summer monsoon months. The survey was conducted during the relatively low-water season of winter; plots were sampled in January and February, and resampled in April, 2013. A heavy 2-day rainfall between sampling efforts enabled the sampling of freshly deposited scats.
Presence of tracks, scats, latrines, or dens defined a plot and a transect as 'positive' for otter presence. Scats were registered separately when more than 5 m apart (Melquist and Hornocker, 1983; Newman and Griffin, 1994). Dens were recorded only when fresh scats were also present to corroborate otter use. Geographic co-ordinates and elevation were recorded from the center of each plot. Sampling was conducted along one bank of the river.
Habitat variables were also recorded in each plot. Habitat was characterized as 1) percent vegetation cover, and 2) bankside substrata. Vegetation was measured by percent cover class: 1) 0-5%, 2) 5-25%, 3) 25-50%, 4) 50-75% and 5) 75-100%. The midpoint of each category was averaged, giving a value for vegetation cover in each plot. Substrate attributes were binned by diameter category as follows: 1) sand (< 5 mm), 2) pebbles (5 mm-5 cm), 3) small stones (5-50 cm), 4) large stones (50-100 cm), and 5) boulders (>100 cm). Evidence of human disturbance, scored on a scale from 1 to 5, included: 1) human footpaths, 2) evidence of grazing, 3) garbage deposition sites, 4) loose trash, 5) sand and boulder excavation, 6) bankside construction, 7) evidence of fishing, 8) recreational sites, 9) evidence of the use of explosives, and 10) construction debris.
Density of each type of otter sign is reported for each study stretch and for each sampling round by density per plot and density per kilometer in Table 1. Otter sign per kilometer of river (sign km-1) was calculated for each study stretch separately, for each of the two sampling rounds, and for the two sampling rounds combined. Total otter sign recorded in each study stretch was correlated against 1) vegetative cover, 2) substrate parameters, and 3) human disturbance, using Pearson's correlation test. Evidence of sand and boulder extraction, construction activities, recreation, use of explosives, and construction debris were excluded from the analysis as none were recorded. We focused on sign distribution and density because, although important for wildlife conservation, estimating abundance of cryptic carnivores is difficult, and otter sign counts do not translate well into an estimate of otter abundance (Melquist and Hornocker, 1983; Mason and Macdonald, 1987; Gallant et al., 2007; Long et al., 2008).
RESULTS AND DISCUSSION
Punatsangchhu, Kamichhu, Burichhu and the Sunkosh stretches. Thirty-one out of 60 plots in round one of sampling, or 52%, were positive for otter sign, and 23 out of 60 plots in round two of sampling, or 38%, were positive for otter sign. Percentage of plots positive for otter sign for both rounds combined was 45%. If the flood-affected Mochhu section, where no sign was found and otters were apparently absent, is omitted from analysis, the proportion of positive plots rises to 54% for combined sampling rounds. The documentation of more numerous positive plots in round 1 than in round 2 was likely due to the longer period of time of accumulation of sign. Mean percent positive plots for combined rounds was none in the Mochhu stretch, 55% in the Phochuu stretch, 35% in the Punatsangchhu stretch, 95% in the Kamichhu stretch, 50% in the Burichhu stretch and 35% in the Sunkosh stretch (Table 1). Individual scats were the most common form of otter sign, with tracks the second most common, with rare dens (Table 1).
Table 1. Number of otter sign by type (round 1 [R1] and round 2 [R2] sampling combined) per sampled river stretch, mean density of otter sign km-1, and percent plots positive for otter sign (n = 60; sampled length of transect per site = 1 km).
Study stretches Scats Tracks Dens Mean % positive R1 R2 R1 R2 R1 R2 R1 R2 density plots
km-1
Mochuu 0 0 0 0 0 0 0 0 0 0
Phochhu 3 2 10 5 1 0 2 1 12 55
Punatsangchhu 1 1 6 3 0 0 0 0 5.5 35
Kamichhu 3 2 14 8 11 12 0 0 25 95
Burichhu 1 1 7 0 9 1 0 0 9.5 50
Sunkosh 1 1 2 3 2 0 0 0 4.5 35
Total 9 7 39 19 23 13 2 1 9.4 45
By comparison, in studies of smooth-coated otter distribution in India, Hussain and Choudhury (1997) reported 36% of sampled sites as positive in 425 km, and Nawab and Hussain (2012) reported 15.5% of sampled sites as positive in 190 km. Both studies, however, documented sign on both banks of the river.
The mean of otter sign km-1 of river along the length of all transects for combined rounds of sampling was 9.4 sign km-1, with a mean of 12.2 sign km-1 for round one and 6.7 sign km-1 for round two (Table 1). Mean of otter sign for both sampling rounds combined ranged on the transects from none for Mochhu, 12 sign km-1 for Phochhu, 5.5 sign km-1 for Punatsangchhu, 25 sign km-1 for Kamichhu, 9.5 sign km-1 for Burichhu, and 4.5 sign km-1 for Sunkosh (Table 1). It is difficult to correlate the presence of otter sign with the intensity of use of an area by otters, and further research will be needed to document the species and abundance of otters in this river.
No otter sign was documented in the Mochhu stretch, although there appears to be abundant suitable otter habitat there, and National Park staff has reported otter sightings in past years. In summer of 2012, however, a severe flood caused by a stalled intense rainstorm, may have reduced prey availability and temporarily caused otters to move downstream for better hunting. The higher percentage of tracks than scats in the Kamichhu stretch suggests that bankside substrate may strongly influence how well tracks are recorded, and that scats counts may yield more reliable results than track counts (Mason and Macdonald, 1987).
Macdonald, 1987; Kruuk, 1995; Melisch and Foster-Turley, 1996; Hussain and Choudhury, 1997; Anoop and Hussain, 2004).
Otter sign was positively correlated with sandy substrate (r=0.63, n=57, P<0.05) and boulders (r=0.94, P<0.05) (Table 2). Pebbles and large stones, on the other hand, were negatively correlated with otter sign (r=-0.53, n=33, P<0.05) and (r=-0.63, n=113, P<0.05) respectively (Table 2). Anoop and Hussain (2004) note that sand is used by otters for grooming and basking, and that scats and dens are most common in sites with sandy substrate and boulders.
Table 2. Correlations between otter sign and percent substrate and vegetation cover (P<0.05 [one-tailed])
Habitat Parameters # sign Pearson's r Sig.
Sand 57 0.63 0.00
Pebbles 33 -0.53 0.00
Small stones 72 -0.19 0.06
Large stones 113 -0.63 0.00
Boulders 64 0.94 0.00
Vegetation 85 0.52 0.00
Certain human disturbances appeared to influence otter presence. There is a negative correlation between otter sign and human footpaths (r=-0.63, n=31, P <0.05) and grazing (r=-0.71, n=26, P<0.05), suggesting that the proximity of human settlements deters otters (Table 3), as reported by Newman and Griffin (1994) and Nawab and Hussain (2012). Harassment by feral dogs from settlements may be one reason for this.
Table 3. Correlations between otter sign and human disturbance parameters (P=0.05 [one-tailed]) Human Disturbance # Pearson's r Sig.
Parameters sign
Footpath 31 -0.63 0.00
Grazing 26 -0.71 0.00
Garbage deposition 10 0.02 0.47
Loose trash 13 -0.03 0.46
Fishing 23 -0.45 0.02
Evidence of illegal fishing was also negatively correlated with otter sign (Table 3), but the reasons for this are probably complicated. Signs of illegal fishing were concentrated in the lower portions of the river, along the Sunkosh stretch. Despite a negative correlation between signs of fishing and otter sign (r=-0.45, n=23, P <0.05), in some plots fresh tracks were observed close to fish traps in the Sunkosh and Burichhu stretches, as well as fresh evidence of dragging of fish traps and fish kills. Otters are at risk of being trapped in such snares during foraging. Of the ten defined human disturbance parameters, five were not documented in plots: extraction of river materials, construction activities, recreation, use of explosives, and construction dumps.
sign was documented in the Kamichhu stretch, perhaps because part of this stretch is protected from illegal fishing and may have high fish densities. The golden mahaseer (Tor putitora), which inhabits the river here, is endangered throughout the Himalayan region due to habitat loss and degradation and overfishing (Nautiyal, 1994). Mining of sand along the Mochhu and Punatsangchhu stretches, although not documented in sampled plots, may also influence otter habitation.
CONCLUSION
Our observations constitute the first distribution survey of otters along the rivers of Bhutan. Otter signs were found in all study stretches except one. Tracks, scats, latrines and dens were recorded in about half of sample plots. Otter signs were more common in sites with more vegetation cover, and along sandy riverbanks with large boulders. Fewer otter signs were observed along sandy banks if those areas were subjected to frequent human activities and/or lacked vegetation cover. In contrast, abundant sign was documented in sandy areas with large boulders and vegetation, away from human footpaths. Differential size of tracks may reflect presence of both adults and cubs, or the sympatricpresence of both Eurasian and smooth-coated otters.
This study documents otter presence over a short period of time in the dry winter season in Bhutan, and surveys are needed along other rivers and in other seasons. Behavioral traits and prey base were not studied, nor was otter abundance,
essential to give managers the tools to conserve and protect otter species in the country. Otters throughout Asia face serious threats, and pressure from the pelt trade in the Himalayan region is intense (Yoxon, 2007). In addition, the impact on otter populations of the construction of multiple hydro-generation facilities needs investigation. Although the Bhutanese Forest and Nature Conservation Rules clearly outline the legal protected status of otters, a knowledge base of the distribution, abundance and ecology of the three species of otters inhabiting the country is urgently needed. We recommend that the Department of Forests and Park Service formulate river bankside regulation to protect riparian habitats. Bhutan, with its many rivers of high water quality and quantity, low hunting pressure, low human population pressure, and high level of governmental commitment to wildlife protection, presents a conservation opportunity for otters, if a comprehensive, scientifically-based conservation program is implemented.
ACKNOWLEDGEMENTS - The authors thank Nicole Duplaix, Otter Specialist Group, Nawang Norbu, Director, Ugyen Wangchuk Institute for Conservation of Environment and Sherab Dorji, Research Officer, UWICE for their kind support.
REFERENCES
Anoop, K. R., Hussain, S.A. (2004). Factors affecting habitat selection by smooth-coated otters (Lutra perspicillata) in Kerala, India. Journal of Zoology, 263(4): 417-423.
Choden, S. (2009). Sediment transport studies in Punatsangchu River, Bhutan. Master's Thesis, Department of Building and Environmental Technology, Lund University, Sweden. 48 pp.
de Silva, P.K. (2011). Status of Otter Species in the Asian Region Status for 2007. In: Proceedings of Xth International Otter Colloquium, Hwacheon, South Korea. IUCN Otter Spec. Group Bull.
28A: 97-107.
Foster-Turley, P., Macdonald, S. M., Mason, C.F. (1990). Otters: An action plan for their conservation. IUCN/Otter Specialist Group, Gland. 126 pp.
Gallant, D., Vasseur, L., Berube, C.H. (2007). Unveiling the limitations of scat surveys to monitor social species: A case study on river otters. Journal of Wildlife Management71(1): 258-265.
Hussain, S.A., Choudhury, B.C. (1997). Distribution and status of the smooth-coated otter (Lutrogale perspicillata) in National Chambal Sanctuary, India. Biological Conservation 80(2): 199-206. Kafle, G. (2009). A Review on Research and Conservation of Otters in Nepal. IUCN Otter Specialist
Kruuk, H. (1995). Wild Otters: Predation and Populations. Oxford University Press.
Long, R.A., MacKay, P., Ray, J., Zielinski, W. (Eds). (2008). Noninvasive survey methods for carnivores. Island Press.
Macdonald, S.M., Mason, C.F. (1983). Some factors influencing the distribution of otters (Lutra lutra). Mammal Review13(1): 1-10.
Macdonald, S.M., Mason, C.F.(1994). Status and conservation needs of the otter (Lutralutra) in the western Palaearctic. Vol. 67. Council of Europe.
Mason, C., Macdonald, S.M.(1987). The use of scats for surveying otter (Lutra lutra) populations: An evaluation. Biological Conservation41(3): 167-177.
Melisch, R., Foster-Turley, P. (1996). First record of hybridisation in otters (Lutrinae: Mammalia), between smooth-coated otter, Lutrogale perspicillata (Geoffroy, 1826) and Asian small-clawed otter, Aonyx cinerea (Illiger, 1815). Zoologische Garten66: 284-288.
Melquist, W.E., Hornocker, M.G. (1983). Ecology of river otters in west central Idaho. Wildlife Monographs83: 1-60.
Nautiyal, P.(1994). The endangered golden mahseer in Garhwal Himalaya: a decade of retrospection. Nature Conservators, Muzaffarnagar (India): 191-196.
Nawab, A., Hussain, S.A. (2012). Factors affecting the occurrence of smooth‐coated otter in aquatic systems of the Upper Gangetic Plains, India. Aquatic Conservation: Marine and Freshwater Ecosystems22(5): 616-625.
Newman., D., Griffin, C.R. (1994). Wetland use by river otters in Massachusetts. The Journal of Wildlife Management, 58(1):18-23.
Pedroso, N.M., T. Sales-Luis, and M. Santos-Reis. (2007). Use of Aguieira Dam by Eurasian otters in Central Portugal. Folia Zoologica56(4): 365-377.
Rahaman, M.M., Varis, O. (2009). Integrated water management of the Brahmaputra basin: Perspectives and hope for regional development. Natural Resources Forum. 33(1): 60-75. Rinzin, C., Vermeulen, W.J., Wassen, M.J., Glasbergen, P. (2009). Nature conservation and human
well-being in Bhutan: An assessment of local community perceptions. The Journal of Environment & Development18 (2): 177-202.
Ruiz-Olmo, J., Loy, A., Cianfrani, C., Yoxon, P., Yoxon, G., de Silva, P.K., Roos, A., Bisther, M., Hajkova, P., Zemanova, B. (2008). Lutra lutra: IUCN Red List of Threatened Species, 2013.1. <www.iucnredlist.org>.
Uddin, S.N., Taplin, R., Yu, X. (2007). Energy, environment and development in Bhutan. Renewable and Sustainable Energy Reviews11(9): 2083-2103.
Wangchuk, T., Thinley, P., Tshering, K., Thsering, C., Yonten, D. (2004). A Field Guide to the Mammals of Bhutan. Department of Forestry, Ministry of Agriculture, Royal Government of Bhutan, Thimphu.
World Bank. 2014. Arable Land (percent of land area).
http://data.worldbank.org/indicator/AG.LND.ARBL.ZS
Yoxon, P. (2007). Alarming trade in otter furs. In: Proceedings of the Xth Otter Colloquium, Hwacheon, South Korea. IUCN Otter Spec. Group Bull. 28A: 2 pp.
RÉSUMÉ
ETUDE DE LA REPARTITION DES LOUTRES LE LONG DE LA RIVIERE AU CENTRE DU BHOUTAN
Nous rapportons ici les résultats de l’enquête sur les Loutres le long de la principale rivière du centre du Bhoutan. Tout le long de son cours, cette rivière possède une grande variété de noms incluant Mochhu, Phochhu, Punatsangchhu et Sunkosh. Nous reportons ici (1) la distribution et la densité des traces de Loutres pouvant être des empreintes, des excréments, des latrines et des tanières, (2) la corrélation entre
l’abondance de ces traces et les caractéristiques de la végétation et du substrat
environnant, et (3) la corrélation de ces traces avec les perturbations engendrées par les hommes. Cinq des six transects de 5,5 km échantillonnés ont présenté des signes
révélant la présence de Loutres. Le seul transect n’en présentant aucune a, récemment,
grand pourcentage d’emplacements positifs avec 95 %, et le site de Sunkosh le plus
faible avec 35 %. Le nombre de traces de la présence de Loutres était positivement corrélé avec la végétation des rives et les plages de sable présentant de gros rochers. Les perturbations humaines (sentiers, pâturage et déchets) influencent aussi la densité des traces de Loutres en les dissuadant. Trois espèces de Loutre (Lutrogale perspillata, Lutra lutra, and Aonyx cinerea) sont supposées occuper les rivières du Bhoutan (Wangchuk et al., 2004), cependant la répartition altitudinal des niches de
ces espèces n’est toujours pas connue pour la zone étudiée, et nous n’avons
aucunement essayé d’en prédire leur distribution. Seulement une espèce de Loutre, la
Loutre à pelage lisse (L. perspicillata), a pu être directement identifiée.
RESUMEN
PROSPECCIÓN DE LA DISTRIBUCIÓN DE NUTRIAS A LO LARGO DE UN RÍO EN BHUTAN CENTRAL

![Table 2. Correlations between otter sign and percent substrate and vegetation cover (P<0.05 [one- [one-tailed])](https://thumb-eu.123doks.com/thumbv2/123dok_br/16302616.186224/7.892.131.762.310.434/table-correlations-otter-percent-substrate-vegetation-cover-tailed.webp)
