Journal of Engineering Science and Technology Review 7 (4) (2014) 125- 136
Research Article
Study on the Spatial Stress of the Chongqing Yangtze River Bridge in China
Yan Li1,*, Liangliang Zhang1 and Antipasli S.R.2
1
Collegeof Civil Engineering, Chongqing University, 401334, Chongqing City, China
2Construction Design Laboratory for Bridge Engineering in CCED Group, Patras 264009, Greece
Received 29 May 2014; Accepted 23 September 2014
___________________________________________________________________________________________
Abstract
Continuous rigid-frame bridges are usually used in building bridges with long span and high piers. It is characterized by the consolidation between piers and beams in the middle of bridge piers and flexible bridge piers in the lower part. Among all the factors, curvature has the most obvious influence on the stress of curved continuous rigid-frame bridge, because of which, the curved beam bridge produces coupling effect of bending moment and receives complicated stress, leading to the deformation such as torsion and displacement of radial direction. No matter it is the cast-scaffold construction or cantilever construction, for continuous rigid-frame bridges, considering that after the long term creep of concrete, structure stress tends to be in a drop-frame state, so it is necessary to know the mechanical properties of the finished bridge. Taking the Chongqing Yangtze River Bridge as an example, this paper mainly analyzes the internal forces and deformations of a finished curved continuotus rigid-frame bridge by establishing a spatial finite element model with Midas Civil 2006 software and by changing the model’s radius of curvature. The results show that as the curvature increases, the vertical deformation and torsion angle of the long-span curved continuous rigid-frame bridge are both reduced under the effect of a dead load and prestressed load, presenting mechanical properties of bridge, namely, “coupling effect of bending moment”. In the model analyzed, the deformation of the bridge in the transverse direction also behaves a trend of gradual decrease with an increase in radius of curvature with the range 500–2000 m.
Keywords: Rigid-frame bridge; Chongqing Yangtze River Bridge; stress analysis; curvature
__________________________________________________________________________________________
1. Introduction
The word “bridge” is used here to refer to buildings constructed to allow roads to cross natural or artificial barriers. A bridge is generally composed of five major parts, including an upper or lower span structure of bridge span which bears the traffic load from automobiles or other vehicles, and five smaller parts. They assure the safety of the bridge structure.
A rigid-frame bridge consolidates the main beam with its piers. Due to this consolidation, the bending moments on the main beam are transferred to the piers so that the piers are subjected simultaneously to the effects of bending and stress. Rigid-frame bridges have a super-statically determinate structure and thus have complex stress conditions. In addition to problems associated with the dead load and potential fire disasters, we also need to take into account the variation in the internal structural forces induced by soil pressure, temperature variation, the shrinkage and creep of concrete, and the nonuniform settlement of piers, etc. According to their different means of support, rigid-frame bridges can be classified into articulated and non-articulated types. With regards to engineering, rigid- frame bridges are usually divided into single-span, multi-span, slant-legged, prestressed T-type, and prestressed continuous rigid-frame
bridges, etc.
Continuous rigid-frame bridges are applicable to bridges with high piers and large span. They consolidate the main beam with piers and there is no hinge in the mid-span. Therefore, traveling on such a bridge is comfortable. The piers are generally flexible and thin-walled. Their role is similar to that of cycloidal cylinders. The flexibility of the piers can be used to adapt its longitudinal displacement caused by various external forces. The piers are not high, which has less built-in effect on the beam. Therefore, the stress state of the beam is close to that of a continuous beam bridge. Considering the effects of longitudinal deformation, rotation of the beam direction and the eccentricity pressure on the piers, flexible piers are used in continuous rigid-frame bridges.
In recent years, the construction of prestressed concrete (PC) continuous rigid-frame bridges has significantly increased all over the world with the rapid development of global economy and technology. In 1998, Norway built the world’s first bridge of this type (the Stolma Bridge with a main span of 301 m) and also the world’s second (Raftsundet Bridge with a main span of 298 m). In 1997, China built the Humen Bridge (with a main span of 270 m), which suggested that PC continuous rigid-frame bridge construction in China has taken a leading position in the world.
The stress state in T-type rigid-frame bridges is basically identical both in the construction and operation stages. As T-type rigid-frame bridges can make full use of the ______________
* E-mail address:[email protected]
ISSN: 1791-2377 © 2014 Kavala Institute of Technology. All rights reserved.
J
estr
JOURNAL OF Engineering Scienceand Technology Review
performance of the materials used, their spans are allowed to be enlarged..
However, due to the use of hinges between the main beams, the high deflection in the mid-span, and the difficulty in pro- ducing, installing, and maintaining the hinges, T-type rigid-frame bridges have been seldom used in recent years. At present, the world’s largest PC T-type rigid-frame bridge is the Asuncion Bridge in Paraguay, South America. It was built in 1978, with a span of 270 m. China’s largest PC T-type rigid-frame Bridge is the Chongqing Yangtze River Bridge, with a main span of 174 m.
2. The Chongqing Yangtze River Bridge
The Chongqing Yangtze River Bridge (also known as the Shibanpo Yangtze River Bridge) is located between Shibanpo (Yuzhong District) and Liziyuan (Nanan District) in Chongqing, China. Construction of the bridge began on November 26, 1977 and it was put into use on July 1, 1980, six months ahead of schedule. The bridge crosses the Yangtze River with its northern end connected to the main arterial route in the southern district which stretches straight to Chongqing Railway Station and Chaotianmen Port; its southern end is connected to the Sichuan-Guizhou road. Its total length is 1,120 m (including the abutment aerial part). The northern approach is 496 m long, the southern approach 1,725 m long, and there was originally a twin-bore tunnel in the southern end which was dismantled in 2003 to build a new interchange on the southern end. The intersection of the end of the south approach with the north approach uses a half-bridge interchange. The main bridge includes 7 piers, 2 platforms, 8 holes, and is 311 m in total. The main span is 174 m long. This bridge is the T-type steel structure bridge with the longest span in the world. It was designed by the Shanghai Municipal Design Institute and constructed by the Chongqing Bridge Engineering Company. The bridge crosses the Yangtze River and, with its grand charm, has become one of the famous attractions in Chongqing. On the end of the bridge, there are inscriptions by marshal Ye Jianying (a famous supreme commander in China). A sculpture on the bridgehead (‘Seasons’) was created by the Department of Sculpture, Sichuan Fine Arts Institute, China, and represents the four seasons of life by impersonating the seasons in fantasy. In December 2003, a new double-lined bridge was built based on the original Chongqing Yangtze River Bridge to improve the traffic capacity and relieve the traffic pressure on the Chongqing Yangtze River Bridge. On 25th September, 2006, the double-lined bridge was completed and opened to traffic.
The four figures (spring, summer, autumn, and winter) in the Seasons sculpture on both bridgeheads also caused an intense discussion in the whole city that year. Artists suggested that the four figures should be sculptured completely naked, like the famous sculptures seen in western countries. However, after several months of intense discussion, the traditional national consciousness gained the upper hand and each figure was decorated with a streamer to block three points on the four figures. In fact, sculpture should be appreciated from artistic perspective. If the three points had not been blocked, this bridge would surely be a famous tourist attraction in China.
Fig.1. The Chongqing Yangtze River Bridge.
Fig.2. The layout of the façade of the Chongqing Yangtze River Bridge.
The main bridge is 1,120 m long in total. The whole bridge has the structural form 86.5 – 4×138 – 330 – 133.75 (m), with the maximum span being 330 m (the longest span of any continuous rigid bridge in the world). The cantilever beam is 3.2 m high, the root is 11.0 m high, the span of the hanging beam is 35 m long, and the bridge is 21 m wide. It has four lanes and one 2 m wide sidewalk on each side). The upper structure is composed of two single cell-box girders, which saves material and is more convenient to construct than a three-rib structure. Three-dimensional prestressed and cast-in-place cantilever methods were utilized in the construction. The strength reached R30 in 3 days. The bridge is the first in China to use prestressed elastic-expansion joints with stiffening steel and chloroprene rubber pipes whose expansion capacity reaches 200 mm).
The piers have a hollow, uniform cross-sectioned reinforced-concrete structure. The vertical walls of the piers are set to correspond to the ribs of the box girders. The base edge is 60–70 m away from the bridge surface. A sliding form construction method was used, i.e. the bridge height was increased by 2.8–4.0 m every day during the construction. There is a twin-bore tunnel in the south bridgehead, with a length of 311 m.
The two continuous, rigid-framed girders of the Chongqing Yangtze River Bridge were constructed by using the hanging-basket cantilever construction method. In addition to the block pieces on the pier, the single T-type box girder is divided into 20 pairs of beam sections. These beam sections use symmetrical, cast-in-place cantilevers arranged in a 6×3.0 – 6×3.5 – 4×4.0 – 4×4.5 formation. The blocks on the pier are 12.0 m long, the closure section of the middle hole is 2.0 m long, and the cast-on-site section of the side holes is 11.0 m long. The most massive block used in the cast-in-cantilever beam section is 163.0 tons in weight. The hanging-basket weighed 80 tons and the weight of the hanging-basket in the closure section of the middle hole is limited to 20 tons. The closure of the main bridge was designed to be of the order of the side span and mid-span. Piers 1#, 2#, and 3# of the main bridge of the Chongqing Yangtze River Bridge (Fig. 2) are all double thin-walled hollow piers, with heights of 42, 51, and 52 m, respectively. Their transverse length is 6.5 m and the forward width is 2.5 m. The foundations of piers use a cast-in-place bored pile of 1.8 m and are designed based on a socketed pile.
3. Construction of the finite element model
construction phase and using economical and practical three-dimensional beam elements. The model of the whole bridge consists of 228 units and 235 nodes. The main beam and pier were modeled using 144 elements and 84 elements, respectively. Fig. 3 shows how the three-dimensional model of the whole bridge generates
Fig.3. The three-dimensional model of the whole bridge.
3.1 Elements
The main beam and piers of the Chongqing Yangtze River Bridge are constructed with beam elements. Each element consists of two nodes and belongs to the ‘three-dimensional beam element of uniform or variable section’ class, which provides the element with properties including deformation rigidness due to tension, pressing, shear, and torsion. Each node of the beam element has a linear and rotational displacement in three directions (either in the element’s or global coordinate system), that is, each node has six degrees of freedom.
3.2 Boundary conditions
There is a vertical restriction on the central line of the box girder web on the abutments of the two ends of the Chongqing Yangtze River Bridge (the continuous rigid-frame bridge). The rigid arm is used to connect the top of the pier and the main beam nodes corresponding to the pier’s top section in where the pier and beam are consolidated As the bridge’s foundations employ socketed piles and the cushion cap has a large size, the necessary consolidation restrictions are included in the treatment of the boundary conditions of the pier’s base.
3.3 Prestressed loads
When building the model, Midas Civil software modeled the loads on the prestressed steel beams as an equivalent loads to work on the concrete interface. When calculating transformed section, the intensity and velocity of the steel beam are also considered. The prestressed steel beam in the main beam of this model was simulated by using prestressed elements.
3.4 Calculating the coordinate system of the model
The origin of the global coordinates used in the model is located at the center of the top surface of the roof of box girder 1#. The positive direction of the x-axis was taken to be in a direction tangential to the curve along the
longitudinal direction of the bridge. The positive direction of the y-axis was set in the direction to the center of the circle of the curved-beam bridge; the positive direction of the z-ax- is is vertically upwards
3.5 Geometrical parameters of other finite element models
Based on the Chongqing Yangtze River Bridge, by changing the radii of curvature of the main bridge, other FEMs are constructed in the same way as that of the Chongqing Yangtze River Bridge with same span layout of the main beam, pier heights, and size and material of each section. The radii of curvature of other FEMs are 500, 750, 1250, 1500, and 2000 m, respectively, in this work.
4.The analysis of internal stress of curved beam bridge under the effect of dead load
4.1 Distribution of internal stress of curved Beam Bridge along the longitudinal direction of bridge under the effect of dead load
Fig.4. The longitudinal distribution of stress in the main beam of the Chongqing Yangtze River Bridge under the effect of a dead load: (a) The transverse bending moment along the longitudinal direction of the bridge, (b) the longitudinal bending moment, and (c) the distribution of the torque along the longitudinal direction.
Fig. 4(a) shows that the maximum longitudinal bending
moments in this bridge correspond to peak negative bending moments near the top sections of each pier. Moreover, the global maximum is observed on the section at the top of pier 2#. It can also be directly observed from Fig. 4(b) that extreme traverse bending moments occur on the sections near the tops of the piers. The maximum transverse bending moment is observed on pier 3#. Fig. 4(c) shows that both maximum positive and negative torques occur at the root faults on the top sections of each pier.
4.2 The analysis of internal stress of curved beam bridge with different radii of curvature under the effect of a dead load
According to the analysis mentioned above, the negative bending moment on the root section of pier 1# of the curved continuous rigid-frame bridge is a control value under the effect of dead load. Therefore, to reinforce our analysis, we analyzed the variation in the negative bending moment near the top sections of each pier as a function of curvature. Table 1 shows the negative bending moments acting on the tops of the piers of the bridge for different radii of curvature.
Table 1. The negative bending moments (105 kN m) on the tops of different piers under the effect of dead load for various radii of curvature.
Curvature (m) Pier 1# Pier 2# Pier 3#
Left block 1# Right block 1# Left block 1# Right block 1# Left block 1# Right block 1#
500 –4.78 –6.30 –7.21 –7.19 –6.39 –5.06
750 –4.75 –6.28 –7.19 –7.18 –6.35 –4.86
1000 –4.74 –6.27 –7.17 –7.17 –6.32 –4.83
1250 –4.72 –6.26 –7.16 –7.17 –6.23 –4.75
1500 –4.69 –6.25 –7.13 –7.13 –6.19 –4.68
2000 –4.68 –6.25 –7.11 –7.11 –6.15 –4.60
Table 2. The rate of increase of the negative bending moment on the root section of block 1# under the effect of a dead load.
Rate of increase (%)
Pier 1# Pier 2# Pier 3#
Left block 1# Right block 1# Left block 1# Right block 1# Left block 1# Right block 1#
750-500 /500 -0.628% -0.317% -0.277% -0.139% -0.626% -3.953%
1000-500 /500 -0.837% -0.476% -0.555% -0.278% -1.095% -4.545%
1250-500 /500 -1.255% -0.635% -0.693% -0.278% -2.504% -6.126%
1500-500 /500 -1.883% -0.794% -1.110% -0.834% -3.130% -7.510%
2000-500 /500 -2.092% -0.794% -1.387% -1.113% -3.756% -9.091%
Note: The (750–500)/500 figure represents the ratio of the difference in load (displacement) for a radius of curvature of 750 m compared to that with a radius of curvature of 500 m for the curved continuous rigid-frame bridge. By analogy, the residue ratios are similarly obtained.
As is shown in Table 1 and 2, as the radius of curvature (r) increases, the absolute values of the negative bending moment on each pier top under the effect of dead load decreases. However, the reduction is insignificant. To directly observe the variation graphically, Fig. 5 only shows a comparative curve occurring when r = 500, 1000, 2000 m.
Table 1 and 2 and Fig. 5 appear to suggest that an increase in the radius of curvature leads a gradual reduction in the longitudinal bending moment. However, the change is not obvious.
According to the discussion in Section 3.1, the transverse bending moment of the curved continuous rigid-frame bridge peaks at the sections near the top of each pier under the effect of a dead load (and the maximum is near the top of pier 3#). Therefore, for convenience, this study merely
analyzed the variation of the transverse bending moment on the section near the top of pier 3#, as is shown in Fig. 6.
Fig.5. The negative bending moments on the tops of the piers under a dead load effect for different radii of curvature for piers (a) 1#, (b) 2#, and (c) 3#.
Fig.6.The variation of the transverse bending moments on the top of pier 3# under the effect of a dead load for different radii of curvature.
Fig. 6 directly shows that the transverse bending moment on the top of pier 3# decreases with an increase in radii of curvature. In addition, as the radii of curvature increases, the trend in the reduction of the transverse
bending moment gradually declines.
Table 3. The variation of the transverse bending moment (103 kN m) near the pier top under the effect of a dead load for different radii of curvature.
Curvature (m) Pier 1# Pier 2# Pier 3#
Left block 1# Right block 1# Left block 1# Right block 1# Left block 1# Right block 1#
500 -9.12 -6.51 -9.36 -9.64 -16.92 -20.36
750 -6.38 -4.28 -7.17 -7.31 -13.03 -12.12
1000 -5.60 -3.01 -5.13 -5.30 -11.10 -10.63
1250 -3.98 -2.42 -4.29 -4.45 -9.03 -8.08
1500 -2.68 -2.13 -3.78 -3.91 -7.00 -7.02
2000 -2.15 -1.78 -3.02 -3.22 -5.02 -5.78
Table 4. The rate of increase of the transverse bending moments on the root section of block 1# under the effect of a dead load.
Rate of increase (%)
Pier 1# Pier 2# Pier 3#
Left block 1# Right block 1# Left block 1# Right block 1# Left block 1# Right block 1#
750-500 /500 -30.044% -34.255% -23.397% -24.170% -22.991% -40.472%
1000-500 /500 -38.596% -53.763% -45.192% -45.021% -34.397% -47.790%
1250-500 /500 -56.360% -62.826% -54.167% -53.838% -46.631% -60.314%
1500-500 /500 -70.614% -67.281% -59.615% -59.440% -58.629% -65.521%
2000-500 /500 -76.425% -72.657% -67.735% -66.598% -70.331% -71.611%
Table 3 and 4 show that a variation in the radius of curvature results in a large variation of the transverse bending moments in a curved continuous rigid-frame bridge. Moreover, it is obvious that the rate of increase of the transverse bending moment on the section near the top of the pier of the side span is significantly greater than that on the top of the pier of the mid-span.
Analysis of the data in Table 3.1 suggests that the maximum torque on the curved continuous rigid-frame
bridge under a dead load effect occurs on the sections near the tops of piers 2# and 3#. Therefore, for convenience in this analysis, we analyzed the variation in the torque on the section near the top of pier 2# for different curvature radii, as is shown in Fig. 7.
Fig.7. The variation in the torque on the section near the top of pier 2# under a dead load effect for different radii of curvature.
Table 5. The variation in the torque on the sections near the top of the piers under the effect of a dead load for different radii of curvature.
Curvature (m) Pier 1# Pier 2# Pier 3#
Left block 1# Right block 1# Left block 1# Right block 1# Left block 1# Right block 1#
500 1.68 -1.66 1.87 -1.87 1.71 -2.37
750 1.13 -1.16 1.56 -1.01 1.15 -1.42
1000 0.57 -0.84 0.92 -1.0 0.89 -1.20
1250 0.41 -0.73 0.62 -0.92 0.70 -0.95
1500 0.33 -0.56 0.60 -0.59 0.62 -0.78
2000 0.22 -0.44 0.45 -0.48 0.47 -0.68
Table 6. The rate of increase in the torque on the root section of block 1# under the effect of a dead load.
Rate of increase (%)
Pier 1# Pier 2# Pier 3#
Left block 1# Right block 1# Left block 1# Right block 1# Left block 1# Right block 1#
750-500 /500 -32.74% -30.12% -16.58% -45.99% -32.75% -40.08%
1000-500 /500 -66.07% -49.40% -50.80% -46.52% -47.95% -49.37%
1250-500 /500 -75.60% -56.02% -66.84% -50.80% -59.06% -59.92%
1500-500 /500 -80.36% -66.27% -67.91% -68.45% -63.74% -67.09%
2000-500 /500 -86.90% -73.49% -71.94% -72.33% -72.51% -77.31%
As is shown in Table 5 and 6, varying the radius of curvature results in a great variation in the torque. Moreover, the rate of increase in torque on the section near the top of the pier of a side span is greater than that on the section near the top of the pier of the mid-span.
5. Analysis of internal stress of curved Beam Bridge under the load effect of pretressed steel beams
5.1 Distribution of internal stress of curved Beam Bridge along the longitudinal direction of bridge under the load effect of pretressed steel beams
Fig.8. The longitudinal distribution of the bending moment under the load effect from prestressed steel beams: (a) Transverse bending moment, (b) longitudinal bending moment, and (c) torque.
As is shown in Fig. 8(a), the maximum bending moments appear on the sections near the tops of the piers in the curved continuous rigid-frame bridge subject to a prestressed effect. In Fig. 8(b), the extreme values in the transverse bending moments are also found on the sections near the pier tops, with the maximum one on the top of pier 3#. Fig. 8(c) indicates that the maximum torque on the curved continuous rigid-frame bridge occurs on the sections near the tops of piers 1# and 3# under the effect of prestressing.
5.2 The effect of different radii of curvature on the internal stress of curved beam bridge under the load effect of prestressed steal beam
Analysis of Table 4.1 shows that the positive bending moment on the root section of block 1# of the curved continuous rigid-frame bridge is controlled under the load effect of a prestressed steel beam. . To further the analysis, we analyzed the variation of the positive bending moment on the section near the top of pier 2#, as shown in Fig. 9.
Fig.9. The variation in the longitudinal bending moment on the top of pier 2# under a prestressing effect for different radii of curvature.
Fig. 9 shows that as the radius of curvature increases, the bending moment on the top of pier 2# subject to a prestressing effect falls significantly. However, the trend in the reduction in the bending moment remains insignificant.
Table 7. The variation in the longitudinal bending moment (105 kN m) near the tops of the pier under a prestressing effect for different curvatures.
Curvature (m) Pier 1# Pier 2# Pier 3#
Left block 1# Right block 1# Left block 1# Right block 1# Left block 1# Right block 1#
500 6.79 9.18 10.13 10.22 9.07 6.83
750 6.61 8.96 9.90 9.80 9.01 6.52
1000 6.51 8.85 9.78 9.76 8.85 6.50
1250 5.70 8.33 9.48 9.21 8.64 6.33
1500 5.48 7.96 8.97 8.89 8.47 6.13
2000 5.47 7.84 8.58 8.52 8.29 6.07
Table 8. The rate of increase in the longitudinal bending moment on the root section of block 1# under a prestressing effect.
Rate of increase (%)
Pier 1# Pier 2# Pier 3#
Left block 1# Right block 1# Left block 1# Right block 1# Left block 1# Right block 1#
750-500 /500 -2.65% -2.40% -2.27% -4.11% -0.66% -4.54%
1000-500 /500 -4.12% -3.59% -3.46% -4.50% -2.43% -4.83%
1250-500 /500 -16.05% -9.26% -6.42% -9.88% -4.74% -7.32%
1500-500 /500 -19.29% -13.29% -11.45% -13.01% -6.62% -10.25%
2000-500 /500 -19.44% -14.60% -15.30% -16.63% -8.60% -11.13%
As is shown in Table 7 and 8, a variation in the curvature results in a slight variation in the longitudinal bending moment. The analysis in Section 4.1 shows that the extreme values in the transverse bending moments of the curved continuous rigid bridge are found on the sections near the tops of the pier under a dead load effect, with the maximum one on the top of pier 3#. Therefore, for convenience, we also analyzed the variation in the transverse
bending moment on the section near the top of pier 3# for the current case, as shown in Fig. 10.
Fig.10. The variation in the transverse bending moments on the top of pier 3# under a prestressing effect for different curvatures.
Table 9. The variation in the transverse bending moment (103 kN m) on the pier tops under a prestressing effect for different radii of curvature.
Curvature (m) Pier 1# Pier 2# Pier 3#
Left block 1# Right block 1# Left block 1# Right block 1# Left block 1# Right block 1#
500 17.38 15.17 16.12 22.35 40.97 38.31
750 14.41 12.06 10.59 15.10 33.06 31.46
1000 12.27 8.40 7.93 9.34 28.87 27.41
1250 10.51 7.03 5.15 6.87 24.30 22.25
1500 8.75 5.27 4.01 5.05 22.64 20.14
2000 7.12 4.39 3.18 4.20 20.09 18.69
Table 10. The rate of increase in the transverse bending moment on the root section of block 1# under the prestressing effect.
Rate of increase (%)
Pier 1# Pier 2# Pier 3#
Left block 1# Right block 1# Left block 1# Right block 1# Left block 1# Right block 1#
750-500 /500 -17.09% -20.50% -34.31% -32.44% -19.31% -17.88%
1000-500 /500 -29.40% -44.63% -50.81% -58.21% -29.53% -28.45%
1250-500 /500 -39.53% -53.66% -68.05% -69.26% -40.69% -41.92%
1500-500 /500 -49.65% -65.26% -75.12% -77.40% -44.74% -47.43%
2000-500 /500 -59.03% -71.06% -80.27% -81.21% -50.96% -51.21%
As is shown in Table 9 and 10, a variation in the curvature leads to a significant variation in the transverse bending moment of the curved continuous rigid-frame bridge.
The analysis in Section 4.1 shows that the maximum torque in the curved continuous rigid-frame bridge is found on the sections near the tops of piers 1# and 3# under the load effect of prestressed steel beams. Therefore, this study concentrated on the variation in the torque on the section near the top of pier 1# for different curvatures, as shown in Fig. 11.
Fig. 11 demonstrates that as the curvature increases, the torque on the top of pier 1# falls. Besides, it is apparent that the trend in the torque reduction declines as the curvature increases.
Fig.11. The variation in the torque on the top of pier 1# under a prestressing effect for different curvatures.
Table 11. The variation in the torque (103 kN m) on the tops of piers under a prestressing effect for different curvatures.
Curvature (m) Pier 1# Pier 2# Pier 3#
Left block 1# Right block 1# Left block 1# Right block 1# Left block 1# Right block 1#
500 14.82 -12.75 1.57 -5.55 6.77 19.67
750 12.32 -9.86 1.03 -4.80 5.64 16.49
1000 10.11 -7.91 0.95 -4.76 3.95 14.95
1250 7.65 -6.86 0.83 -3.95 3.53 13.67
1500 5.87 -5.11 0.57 -3.45 3.07 13.03
Table 12. The rate of increase in the torque on the root section of block 1# under the prestressed effect.
Rate of increase (%)
Pier 1# Pier 2# Pier 3#
Left block 1# Right block 1# Left block 1# Right block 1# Left block 1# Right block 1#
750-500 /500 -16.87% -22.67% -34.39% -13.51% -16.69% -16.17%
1000-500 /500 -31.78% -37.96% -39.49% -14.23% -41.65% -24.00%
1250-500 /500 -48.38% -46.20% -47.13% -28.83% -47.86% -30.50%
1500-500 /500 -60.39% -59.92% -63.69% -37.84% -54.65% -33.76%
2000-500 /500 -68.69% -60.86% -78.34% -47.57% -62.33% -36.96%
As is shown in Table 11 and 12, variation of the curvature results in a significant variation in the torque. Moreover, the variation in the torque on the sections near the top of the pier of a side span under the prestressed effect is larger and more significant than that near the top of the pier of the mid-span.
6. Analysis of deformation of the curved-beam bridge under the effect of dead load
6.1 Distribution in the deformation of curved Beam Bridge along the longitudinal direction under the effect of dead load
Fig. 12 illustrates the distribution in the displacement of the main beam of the Chongqing Yangtze River Bridge under the effect of a dead load along the longitudinal direction. The distributions in the longitudinal and transverse displacement and the torsion angle of the main beam are given.
Fig.12. The distribution in the displacement along the longitudinal direction of the bridge under the effect of a dead load: (a) Longitudinal displacement, (b) transverse displacement, and (c) torsion angle.
As is shown in Fig. 12(a), under a dead load, the maximum vertical displacements of the curved continuous rigid-frame bridge appear in the middles of the two mid-spans. In Fig. 12(b), the maximum transverse displacement can be seen to occur in the section near the mid-span of span 3#. Finally, we can conclude from Fig. 12(c) that the maximum torsion angle is found on the section near the 1/4 part of the left and right spans of pier 2#.
6.2 Variation of deformation of curved beam bridge with different radii of curvature under the effect of dead load
The analysis in Section 5.1 shows that the maximum longitudinal displacement is found on the section near the middle of two mid-spans. Therefore, the variation of the longitudinal deformation on the section near the middle of one mid-span is analyzed, as is shown in Fig. 13.
The vertical displacement of the mid-span of the second span gradually reduces as the curvature increases, as is shown in Fig. 13.
Table 13. The vertical displacement (10–2 m) of the main span of each span under a dead load for different radii of curvature.
Curvature (m) Pier 1# Pier 2# Pier 3#
Left block 1# Right block 1# Left block 1# Right block 1# Left block 1# Right block 1#
500 -4.05 -20.23 -20.65 -4.58 500 -4.05
750 -3.91 -20.09 -20.50 -4.50 750 -3.91
1000 -3.84 -19.85 -20.28 -4.23 1000 -3.84
1250 -3.71 -19.65 -20.30 -3.98 1250 -3.71
1500 -3.69 -19.60 -19.84 -3.81 1500 -3.69
2000 -3.67 -19.40 -19.44 -3.53 2000 -3.67
Table 14. The rate of increase in the vertical displacement of the main span of each span under the effect of a dead load.
Rate of increase (%)
Pier 1# Pier 2# Pier 3#
Left block 1# Right block 1# Left block 1# Right block 1# Left block 1# Right block 1#
750-500 /500 -3.46% -0.69% -0.73% -1.75% 750-500 /500 -3.46%
1000-500 /500 -5.19% -1.88% -1.79% -7.64% 1000-500 /500 -5.19%
1250-500 /500 -8.40% -2.87% -1.69% -13.10% 1250-500 /500 -8.40%
1500-500 /500 -8.89% -3.11% -3.92% -16.81% 1500-500 /500 -8.89%
2000-500 /500 -9.38% -4.10% -5.86% -22.93% 2000-500 /500 -9.38%
As is shown in Table 13 and 14, the increase in the radius of curvature results in a gradual reduction of the vertical displacement of the curved continuous rigid-frame bridge under the effect of a dead load. However, the variation is insignificant.
The analysis in Section 5.1 shows that the maximum transverse displacement is found on the section near the midspans of piers 2# and 3# under the effect of a dead load. Therefore, this study just considers the variation in the transverse displacement of a section near the midspan under a dead load effect as a function of curvature (Fig. 14).
Fig.14. The variation in the transverse displacement under a dead load for different curvatures.
As can be seen from Fig. 14, the transverse displacements gradually decline as the curvature increases. Moreover, the trend in the reduction tends to be slower with increased curvature.
Table 15. The variation in the transverse displacement (10–3 m) of each controlling section under the effect of a dead load for different curvatures.
Curvature (m) Pier 1# Pier 2# Pier 3#
Left block 1# Right block 1# Left block 1# Right block 1# Left block 1# Right block 1#
500 5.80 6.91 13.86 14.78 19.98 12.10
750 3.55 4.53 11.47 12.39 17.14 10.41
1000 2.53 3.34 10.05 11.89 15.12 9.77
1250 2.18 2.96 8.73 9.86 12.68 8.14
1500 1.85 2.44 7.20 8.38 10.51 6.98
Table 16. The rate of change of the transverse displacement of each controlling section under a dead load for different curvatures.
Rate of increase (%)
Pier 1# Pier 2# Pier 3#
Left block 1# Right block 1# Left block 1# Right block 1# Left block 1# Right block 1#
750-500 /500 -38.79% -34.44% -17.24% -16.17% -14.21% -13.97%
1000-500 /500 -56.38% -51.66% -27.49% -19.55% -24.32% -19.26%
1250-500 /500 -62.41% -57.16% -37.01% -33.29% -36.54% -32.73%
1500-500 /500 -68.10% -64.69% -48.05% -43.30% -47.40% -42.31%
2000-500 /500 -69.31% -64.83% -50.36% -51.01% -59.31% -49.50%
As is shown in Table 15 and 16, the transverse displacement of each controlling section gradually falls by a large amount with the curvature increasing.
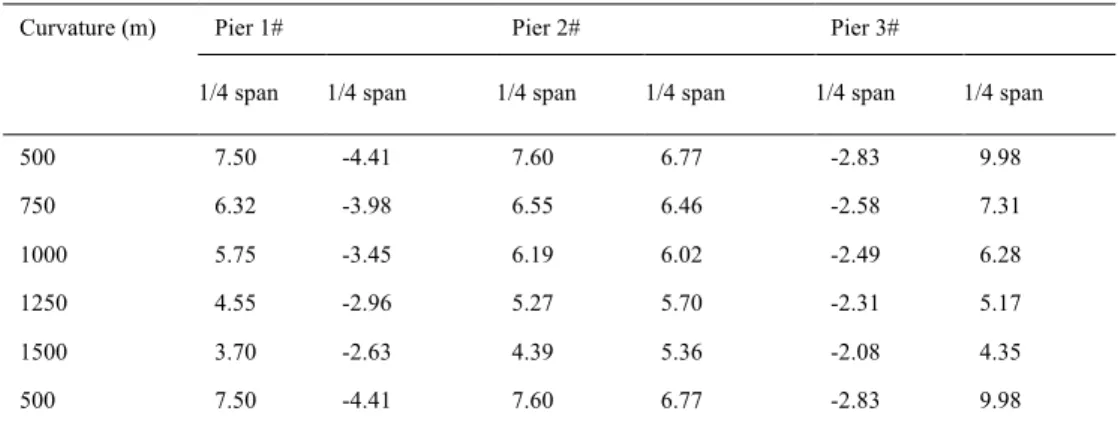
From the analysis of Section 5.1 one can see that the maximum torsion angle displacement is found on the section near the 1/4 span of the left and right spans of pier 2# under the effect of a dead load. Therefore, for convenience in this analysis, we merely analyzed the variation in the torsion angle of the section near the 1/4 span of the left and right spans of pier 2# (Fig. 15).
Fig. 15 shows that the torsion angle displacement of the section near the 1/4 span of the left and right spans of pier 2# falls as the curvature increases.
Fig.15. The variation in the torsion angle displacement under a dead load for different curvatures.
Table 17. The torsion angle displacement (10–4 rad) of the section near the 1/4 span of each span under a dead load for different curvatures.
Curvature (m) Pier 1# Pier 2# Pier 3#
1/4 span 1/4 span 1/4 span 1/4 span 1/4 span 1/4 span
500 7.50 -4.41 7.60 6.77 -2.83 9.98
750 6.32 -3.98 6.55 6.46 -2.58 7.31
1000 5.75 -3.45 6.19 6.02 -2.49 6.28
1250 4.55 -2.96 5.27 5.70 -2.31 5.17
1500 3.70 -2.63 4.39 5.36 -2.08 4.35
500 7.50 -4.41 7.60 6.77 -2.83 9.98
Table 18. The rate of variation of the torsion angle displacement of the section near the 1/4 span of each span under a dead load for different curvatures.
Rate of increase (%) Pier 1# Pier 2# Pier 3#
1/4 span 1/4 span 1/4 span 1/4 span 1/4 span 1/4 span
(750–500)/500 –15.73% –9.75% –13.82% –4.58% –8.83% –26.75%
(1000–500)/500 –23.33% –21.77% –18.55% –11.08% –12.01% –37.07%
(1250–500)/500 –39.33% –32.88% –30.66% –15.81% –18.37% –48.20%
(1500–500)/500 –50.67% –40.36% –42.24% –20.83% –26.50% –56.41%
(2000–500)/500 –60.67% –48.30% –53.16% –28.06% –30.39% –63.93%
It can be seen from table 17 and 18 that variation in the curvature can result in a large variation in the torsion angle displacement under the effect of a dead load. More specifically, the torsion angle displacement gradually falls as curvature increases.
7. Conclusions
Based on Chongqing Yangtze River Bridge, this study firstly built a spatial finite element model with Midas Civil 2006 software and then analyzed the internal stresses and deformations of the curved continuous rigid-frame bridge in
As the radius of curvature is increased from 500 to 750, 1000, 1250, 1500, and 2000 m, the vertical displacement of the mid-span section of span 3# decreases from –20.65×10⁻² to –19.44×10⁻² m under the effect of a dead load. Under the effect of a prestressed steel beam load, the vertical displacement of the midspan section of span 3# decreases from 28.21×10⁻² to 26.28×10⁻² m. Regardless of whether the bridge was under the effect of a dead load or prestressed load, the variation in the vertical displacement was insignificant as the curvature increases. However, the transverse displacement and torsion angle present large variation. As the curvature increases from 500 to 750, 1000, 1250, 1500, and 2000 m, the transverse displacement near
the midspan section of span 3# decreases from 19.98×10⁻³ to 8.13×10⁻³ m under the effect of a dead load, with a maximum rate of variation of –69.3%. The torsion angle displacement on the left 1/4 span section of pier 2# declines from 7.60×10⁻⁴ to 3.56×10⁻⁴ rad, with a maximum rate of variation of –63.9%, under the load effect from a prestressed steel beam. The transverse displacement near the midspan section of span 3# decreases from –25.08×10⁻³ to – 11.89×10⁻³ m, with a maximum rate of variation of –61.8%. The torsion angle displacement on the left 1/4 span section of pier 2# declines from 3.34×10⁻⁴ to 2.16×10⁻⁴ rad, with a maximum rate of variation of –74.8%.
______________________________
References
1. Chen, S., Chen, H. J.,“The mechanical principles of pile-frame-typed abutment”. Journal of Fuzhou University, (2), 1998, pp. 81-84.
2. Chen, S., Chen, P. J., “The comparison, selection, optimization, and modification of the designing schemes of mountainous highway bridge”. Journal of the China Railway Society, 33(10), 2011, pp. 51-56.
3. Lin, C. C.,“The application range and reasonable types of concrete suspension bridge”. China Journal of highway and transport, (4) 1993, pp. 39-44.
4. Huang, W. J., Qi, G. R., Liang, T. X.,“The suspension bridges in Fujian province, China”. China Journal of highway and transport (12), 1995, pp.160-168.
5. Ding, H. S., Huang, W. J., “The double spline sub-domain calculation of Yangtoukou interchange”. China Journal of highway and transport, (4) 1989, pp. 60-68.
6. Miehell, J. H., “The small deformation of curves and surfaces with application to the vibrations of a helix and a circularring”. Messenger of Mathematic 19,1890, pp. 68-76
7. Love, A. E., “A treatise on the Mathematical Theory of Elastieity”. New York:Dover,1944
8. Federhofer,K.,Dynamik, D. B., Kreisringes.Wien: Springer, 1950 9. Vlasov, V. Z., “Joint Power and Bandwidth Allocation for
Amplify-and-Forward Cooperative Communications Using Stackelberg Game”, IEEE Transactions on Vehicular Technology 62(4), 2013, pp. 1678-1691.
10. Timoshenko, S. P., Gere. J. M., Theory of Elasticstability. 2nded. NewYork:MeGraw Hill Book Co.Inc,1961
11. Yang, Y. B., Kuo ,S. R,. “Effect of curvature on stability of curved beams”. J Engrg Struct Div, (113), 1987, pp. 1185-1202. 12. Markus, S., Nasasi, T., “Vibrationsof curved beams”. The Shock
and Vibration Digest, (13), 1981, pp. 3-14.
13. Laura, P. A., Mauriz, M. J., “Recent research on vibrations of arch- type structures”. The Shock and Vibration Digest, (19),1987, pp. 6-9.
14. Childamparam, P., Leissa, A. W., “Vibrations of Planar curved beams,Rings and arches”. App1 Mech Rev, (46), 199, pp. 467-483.
15. Auciello, N. M., De Rosa, M. A., “Free vibrations of cireular arches:A review”. J Soud Vib, 176(4), 1994, pp. 433-455. 16. Kapania, R. K., Li, J., “On a geometrically exact curved/twisted
beam theory under rigid cross-section assumption”. Compational Mechanics, 30(5), 2003, pp. 428-443.
17. Jiang, Z. G., Luo, Q. Z., Tang, J. A,.“Spatial displacement model for horizontally curved beams”. Struct ural Engineering and Mechanics, 15(1), 2003, pp. 151-157.
18. Hodges, D. H., “Geometrieally exact intrinsic theory for dy-namics of curved and twisted anisotropic beams”. AIAA Journal, 41(6), 2003, pp.1131-1137.
19. Piovan, M. T., Cortinez, V. H., “Mechanics of anisotropic curve beams with thin-walled sections”. Revista Internacional de Metodos Numericos para calculo y Diseno en Ingenieria, 19(3), 2003, pp. 341-362.
20. Yu, A. M., Gu, X.,“The integral equation solution of curved beam shear stress”. Journal of Tongji University, 32 (8), 2004, pp. 1015 -1019.
21. Li, F., Patton, R., Moghal, K., “The relationship between weight reduction and force distribution for thin wall structures”. Thin-Walled Struct ures, 43(4), 2005, pp. 591-616.
22. Chiang, Y. C., “The Poisson effect on the curved beam analysis”. Struct ural Engineering and Mechanics, 19(6) , 2005, pp.707-720 23. Fan. L. C.,“Bridge construction”. Journal of Communication and
Computer, 7(8), 2010, pp.24-30.
24. He. S. H., “The theory and calculation method of advanced bridge structure”. International Journal of Computer Applications, 11(3), 2010, pp. 28-31.
25. Li. G. H., “The torsional buckling analysis of curved box girder”. Journal of the China Railway Society, 31(4), 2009, pp.104-107. 26. X. H.F., “The structural theory of advanced bridge”. Journal of the
China Railway Society, 34(6), 2012, pp. 40-45.
27. Zhu, B. F., “The principle and application of finite element method”. The Second edition. China water conservancy and hydropower Press, 2000