code to the honey bee (Apis mellifera) genome to analyze its methylation structure. The results indicate that the honey bee genome exhibits CpG overrepresentation in spite of its methylation ability and that two conserved motifs, CTCGAG and CGCGCG, in the unmethylated regions are responsible for the overrepresentation of CpG.
Citation: Ichinose N, Yada T, Gotoh O (2014) Tetrahedral Gray Code for Visualization of Genome Information. PLoS ONE 9(1): e86133. doi:10.1371/ journal.pone.0086133
Editor:Frederique Lisacek, Swiss Institute of Bioinformatics, Switzerland
ReceivedSeptember 4, 2013;AcceptedDecember 8, 2013;PublishedJanuary 27, 2014
Copyright:ß2014 Ichinose et al. This is an open-access article distributed under the terms of the Creative Commons Attribution License, which permits unrestricted use, distribution, and reproduction in any medium, provided the original author and source are credited.
Funding:This research was supported by the Aihara Project, the FIRST program from Japan Society for the Promotion of Science (JSPS), initiated by CSTP. This work was partially supported by JSPS KAKENHI Grant Numbers 221S0002 and 22310124. The funders had no role in study design, data collection and analysis, decision to publish, or preparation of the manuscript.
Competing Interests:The authors have declared that no competing interests exist.
* E-mail: [email protected]
Introduction
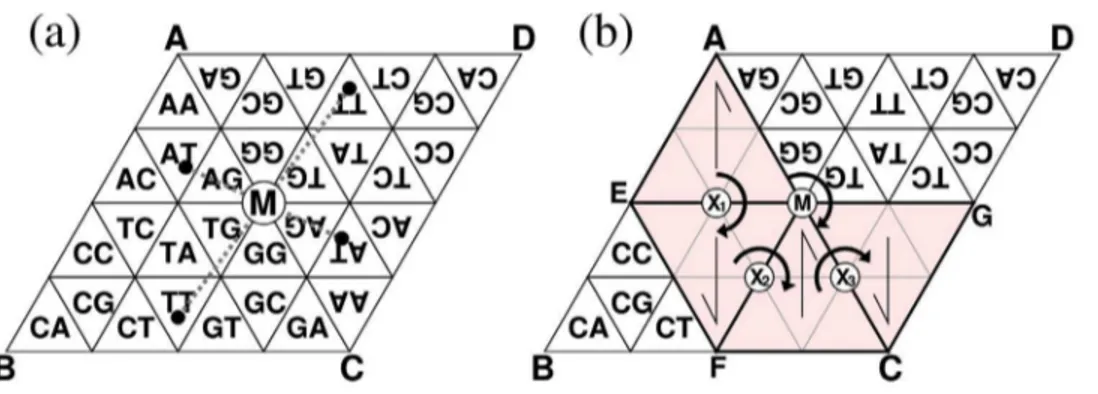
One of the first steps in exploring the huge amount of information contained in genomes is content visualization of short nucleotide sequences of a fixed length ofk(k-mers). The landmark study of such visualization is Jeffrey’s chaos game representation (CGR) [1]. CGR is a transformation between a DNA sequence and a position in a unit square. All sequences having the same prefix are transformed into the corresponding box as shown in Fig. 1(a). When all suffixes in a genome are transformed, its frequency distribution in the unit square represents the content information. Because of the simplicity and visibility of CGR, several applications and extensions have been proposed, such as extensions to protein or arbitrary sequences [2,3], alignment-free comparisons of genomes [4], fractal analysis [5,6], and analysis of Markov properties [7]. For the purpose of information visualiza-tion, however, CGR has a serious drawback in that adjacentk -mers can be completely different from each other,e.g., CTT and GAA in Fig. 1(a). Thus, physical proximity in CGR does not necessarily indicate similarity of the correspondingk-mers.
Besides CGR, we can consider various transformations of DNA sequences. What transformation is most informative for DNA sequence analysis? One of the best candidates is the Gray code [8]. The Gray code is originally defined as an ordering of binary numbers in which adjacent numbers differ from each other by only one bit. We can easily extend it to quaternary numbers corresponding to DNA sequences [9],i.e., the Hamming distance between the adjacentk-mers is always one in the code. Such DNA Gray code has been applied to motif discovery [10].
Another candidate for transformation is the de Bruijn code (or cycle) [11]. In the de Bruijn code, adjacentk-mers have the shift relation, i.e., the edit distance between them is always two. Although differ in the measure (Hamming distance and edit distance), the Gray code and the de Bruijn code share the property of a constant distance between neighbors. However, we prefer to use the Gray code because it has the hierarchical structure favorable for visualization such that allk-mers with a same prefix are included in a closed set, whereas the de Bruijn code does not have such a property.
Although the original Gray code is one-dimensional, the Gray code can be extended to two-dimensional (2D) space similar to CGR [12]. In the 2D Gray code, thek-mers corresponding to two boxes adjacent in the vertical and horizontal directions differ from each other by only one nucleotide (Fig. 1(b)). Our biological knowledge suggests that similar sequences tend to have an identical or similar function, as exemplified by synonymous codons and iso-regulatorycis-elements. As a neighboring region always corresponds to a set of similar sequences, the 2D Gray code may be more useful than CGR that lacks such a property.
The 2D Gray code has a toric structure such that the top and bottom boundaries and the left and right boundaries are respectively connected to each other. This implies that the Gray code structure is closed on the surface of a torus. Unfortunately, however, it is difficult to realize a toric structure in the 3D space with an actual material, such as a paper craft.
the basic unit of the 2D Gray code is rectangular, that of TGC is triangular (Fig. 2). In TGC, ak-mer differs from each of its three neighbors by only one nucleotide. This relationship is valid even at the edges of the tetrahedron. We demonstrate here an algorithm and its implementation that enables us to draw the development of TGC on a paper with a conventional PC and a printer. As a tetrahedron can be easily constructed by paper craft (Fig. 3), the complete structure of the Gray code can be closely scrutinized in one’s hands. Moreover, a set of tetrahedrons generated from the genomic sequences of various organisms can be displayed in a tree-structured object to visually demonstrate the evolutionary changes in genome contents along the tree of life.
Methods
Construction of tetrahedral Gray code (TGC)
We refer to a triangle corresponding to ak-mer as a cell. We generate the(kz1)-mer codes from ak-mer code by dividing the original cell into four smaller sub-cells corresponding to the four
nucleotides, A, C, G, and T, which are appended to the originalk -mer. The problem is how to assign the four nucleotides to the four sub-cells. In TGC, we use a specific generator tetrahedron to determine the assignment (Fig. 4).
As illustrated in Fig. 4, each cell on a surface of the generator represents a unique nucleotide. An important feature of the generator is that the nucleotides corresponding to the two cells bordering each other on an edge are identical. To construct TGC, we start with the monomer tetrahedron whose four surfaces are labeled with the four kinds of nucleotides. Then, we recursively apply the following procedure up to the predefined depth,i.e., the (kz1)-mer code is formed from thek-mer code by rotation and stamping of the generator, as shown in Fig. 5 (k~2in this case). As a result of the stamping, the parental cell is divided into four sub-cells. By appending the nucleotides on the surface of the generator to the parental k-mer, we generate four unique (kz1)-mers, which are then assigned to the corresponding sub-cells (Fig. 5(c)). All the cells in the originalk-mer TGC are stamped by rotating the generator around each edge (Fig. 5(d)). Obviously, all possible (kz1)-mers are generated by this inductive procedure and these (kz1)-mers are unique. After the procedure reaches the predefined depth, we apply the genome information to TGC as described in the later subsection ‘‘Visualization of genome contents’’.
We argue that this procedure produces TGC from the following observations. If two adjacent cells in the (kz1)-mer TGC are derived from the same parental (i.e.,k-mer) cell, their sequences differ by only one nucleotide because the firstk-mers are identical while the last ones are unique because of the feature of the generator. On the other hand, if the two adjacent cells come from different parental cells, those parental cells must have been adjacent. Here, we assume that the parental cells satisfy the TGC conditions,i.e., the sequences of the parental cells differ by only one nucleotide. The last nucleotides of those adjacent(kz1)-mers are identical because the nucleotides on both sides of an edge in the generator are identical. Therefore, the sequences of two adjacent cells differ by only one nucleotide even if those cells come from different parental cells. Consequently, the(kz1)-mer code is inductively a TGC as the monomer code is obviously a TGC.
The above consequence is dependent on the assumption that the generator can return to the first cell with the same surface and orientation after a certain number of rotations are applied to it. If this assumption were invalid, inconsistencies would occur in some cells during the procedure,i.e., two or more differentk-mers would Figure 1. Transformations of CGR (a) and 2D Gray code (b) of trimers.
doi:10.1371/journal.pone.0086133.g001
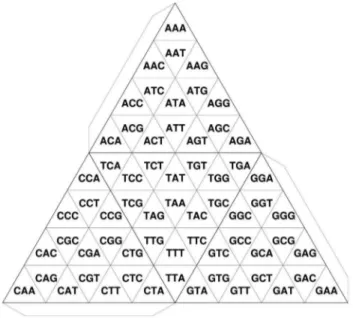
Figure 2. Transformation of TGC of trimers. Flaps indicate connecting boundaries in order to make a tetrahedron.
be mapped in the same cell. The assumption of the recurrence of the generator is valid as proved in the next subsection.
Recurrence of generator
Akiyama has shown that a tetrahedron can return to the first cell with the same surface and orientation after a certain number of rotations over a triangular lattice on aplane[13,14]. However, movements of the generator on the plane and on the surfaces of the tetrahedron are not exactly the same because the tetrahedron is closed at its edges. A proof on the plane is therefore not directly applicable to that on the tetrahedron. In this regard, we have to show that the recurrence of the generator holds even when the generator moves over the edges of the tetrahedron.
The key point is that the edge rotation of the generator should be equivalent to a half turn (180u) of the triangular development of the generator around each midpoint of its three boundaries. Consider two generators with the states before and after an edge rotation as shown in Fig. 6(a) and (b), respectively. These generators are developed by cutting open the same three edges including the rotation edge such that each development becomes a triangle. As a result, we obtain the two triangular developments
ABC and DCB as shown in Fig. 6(c). These triangles including their internal patterns are identical to each other when the half turn around midpoint X of boundary BC is applied to them, implying the equivalence of the rotation of the generator around edge BC and this half turn. This relationship holds for the other two midpoints of boundaries AB and CA.
Similarly to the movement of a tetrahedron [13,14], the recurrence of the triangle holds on the plane because the process of half turns generates a type of transformation group calledthe plane crystallographic grouporthe wallpaper groupin group theory (Group p2 in our case) [15]. By the half turns, the development of the generator moves on the triangular lattice on which each triangle consists of four cells. The wallpaper group is defined as a set of such transformations and their compositions. As each half turn does not change the stamps as shown in the previous paragraph, its repeat (or composition) does not also change them. Therefore, all transformations belonging to the wallpaper group do not change the stamps.
We remark here that the invariance of stamps does not always imply the recurrence of the triangle on the plane,i.e., it is only a necessary condition. Thus, we have to show that such a discordance does not occur in our case. In general, we can assume five transformations besides the identical transformation, such that a regular triangle is transformed into itself as a result of the composition of a certain number of transformations: two 120u rotations around the center and three reflections. However, these five transformations change the stamps and hence the assumption is inconsistent with the fact that a composition does not change the stamps. Therefore, only the identical transformation is allowable as the composition such that the triangle returns to the initial position after a certain number of half turns, proving the recurrence of the triangle on the plane [15].
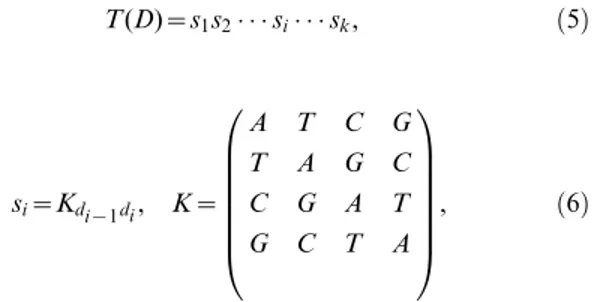
To emulate the movement of the generator on the surfaces of the tetrahedron, we consider the development of a TGC (triangle ABC) and one of its half turns (CDA) in Fig. 7(a). The movement of the generator over boundary AC corresponds to its movement over the edge of the tetrahedron. Segments AM and CM contact each other at the edge of the tetrahedron made from triangle Figure 3. Paper crafts of TGC. Content information of human and honey bee genomes is depicted on the left and center paper crafts, respectively.
doi:10.1371/journal.pone.0086133.g003
Figure 4. Generator represented by a development (a) and a tetrahedron (b).
ABC. The correspondence holds because segment AM (or CM) of triangle CDA is the transformed (turned) image of segment CM (or AM) of ABC,i.e., these segments of the two developments contact each other in the same way as they contact at the edge of the tetrahedron. This correspondence holds for the other half turns of ABC. This fact implies that the recurrence of the generator on the tetrahedral surfaces is equivalent to the proposition that ‘‘a pair of
identical cells in the original and transformed images has an identical stamp when the generator moves over the boundary between the two developments’’. Note that the identical stamp implies the identical orientation of the generator as shown in the previous paragraph. Therefore, we only have to prove this proposition to complete the proof of the recurrence of the generator.
Figure 5. Procedure for formation of trimer code from dimer code.(a) The dimer code is assumed. (b) The generator is stamped on a cell. (c) The generator is rotated around an edge and stamped again. (d) Repeating the rotation and stamping for all cells yields the trimer code. doi:10.1371/journal.pone.0086133.g005
Figure 6. Equivalence between edge rotation of a tetrahedron and half turn of its development.(a) The tetrahedron before an edge rotation. (b) After an edge rotation of (a). (c) Triangles ABC and DCB are the developments of (a) and (b), respectively. These developments are related by the half turn around point X.
The movement of the generator over boundary AC is shown in Fig. 7(b). The three half turns around points X1, X2, and X3move
the generator from the initial AEM to the last CGM positions. Triangles AEM and CGM have point symmetry around M. Moreover, the identical cells are also located symmetrically around M as shown in Fig. 7(a). Therefore, each pair of identical cells has an identical stamp. This property holds for longerk-mers because the half turn around M belongs to the wallpaper group and hence all stamps are symmetric around M. Consequently, the above proposition is proved and then the proof for the recurrence of the generator on the tetrahedral surfaces is completed.
Algorithm
To draw TGC with a computer program, we first establish a relationship between a position of a triangular cell and a quaternary sequence that we call anaddress,D, which is defined by:
D~d1d2 di dk, di[f0,1,2,3g, ð1Þ where the size ofDequalskwhen we usek-mer codes. The four digits assigned to each quaternary basedicorrespond to the four affine transformations defined by:
Mn~
an 0 xn
0 bn yn
0 0 1
0
B @
1
C
A, n[f0,1,2,3g, ð2Þ
where, (an,bn,xn,yn)~ (1 2, 1 2, 1 4, ffiffiffi 3 p
4 ) if n~0
({1
2,{ 1 2, 3 4, ffiffiffi 3 p
4 ) if n~1 (1
2, 1
2,0,0) if n~2
(1 2,
1 2,
1
2,0) if n~3
8 > > > > > > > > > > > < > > > > > > > > > > > :
: ð3Þ
Each affine transformation maps a regular triangle of unit length into an inner triangle as explained in Fig. 8. To transform a point (x,y), we use a vectorv~(x,y,1)and a productMnvT, whereT denotes the transposition.
As the product of these affine transformations, we obtain a transformationMDof the addressD:
MD~Md1Md2 Mdi Mdk: ð4Þ
The transformation of the regular triangle ABC by MD identifies the cell corresponding to the addressD. The relationship between the address of length 2 and the cell is exemplified in Fig. 9(a).
at M.
doi:10.1371/journal.pone.0086133.g007
Figure 8. Relationship between addresses and cells (a) and affine transformations (b). Points A, B, and C are vertexes of a regular triangle and positioned at (1=2,pffiffiffi3=2), (0,0), and (1,0), respectively. Points D, E, and F are the midpoints of the three boundaries, respectively. Each affine transformation moves triangle ABC into an inner triangle indicated in (b).
doi:10.1371/journal.pone.0086133.g008
mationT can be expressed as:
T(D)~s1s2 si sk, ð5Þ
si~Kdi{1di, K~
A T C G
T A G C
C G A T
G C T A
0
B B B B B B @
1
C C C C C C A
, ð6Þ
where K is the relation matrix defined by the generator, Kij denotes an element ofK, andd0~0is arbitrarily chosen to assign
the first bases. The algorithm for the construction of TGC is summarized in the pseudocode (Fig. 10). Allk-mers are displayed by callingtetracode(’’,I,0), whereI is the3|3identity matrix.
Visualization of genome contents
We use TGC to visualize genome information represented by thek-mer frequencyf, which is defined by:
f(S)~( number of S in genome )
( length of genome ) , ð7Þ
where S denotes a k-mer, S~s1s2 si sk, si[fA,T,C,Gg. For sequence analysis, k-mer frequencies relative to some
backgroundfrequencies are often more useful than the raw values. For example, we can adopt the zeroth-order Markov model as the background frequenciesfB:
fB(S)~P(s1)P(s2) P(sk), ð8Þ
where Pis the probability of occurrence of a nucleotide in the genome. Other examples of background frequencies are a
higher-Results and Discussion
Educational use of TGC
In a science outreach event, we used TGC to exhibit the genomic landscape along the tree of life. The genomic landscape is displayed in a mobile sculpture that is arranged to accord with a phylogenetic tree composed of 34 organisms (Fig. 12 and S1). Specifically, in the mobile sculpture, a fulcrum corresponds to a branch point of organisms and an object dangling from a horizontal bar by a rod corresponds to a TGC expressing the genome information of a specific organism.
In the mobile sculpture, we can observe evolutionary conser-vation and variation among neighboring organisms at a glance. For example, organisms in vertebrates have similar patterns in TGC, whereas those in insects are more diversified as we discuss in the following subsections in detail. Thus, this mobile sculpture can give us a concise insight into comparative genomics.
For calculation of a TGC of the complete human genome (total size of 2.95 Gbp), for example, the calculation time was 28 s (linearly dependent on genome size) and the memory usage was 17 MB on a normal PC. Thus, the application of TGC is sufficiently feasible for creating a large mobile sculpture. Further-more, we provide an auxiliary tool named GENOREP to select an appropriate number of representatives from a potentially huge set of genomic sequences as described in Text S1.
Figure 10. Algorithm for displaying TGC ofk-mers. doi:10.1371/journal.pone.0086133.g010
Analytical use of TGC
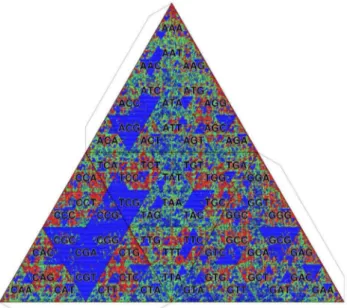
Genome information and CpG methylation. Figure 13 shows the TGC of the human genome. For this and other examples, we use the frequency distribution of octamers (k= 8) for color visualization. Since the number of the cells is huge (48~65536for octamers), we indicate only the first three letters common to a closed set of octamers. This display is feasible because the Gray code has the hierarchical structure as we mentioned in Introduction. The background frequency is deter-mined by the zeroth-order Markov model that is constructed from the given genome itself. The most remarkable feature perceivable in Fig. 13 is the depletion ofk-mers having CpG dinucleotides, which is demonstrated by the large blue area around the prefix CG. The CpG depletion is caused by the methylation of the cytosine of CpG [16]. The spontaneous deamination of methyl-cytosine causes mutations to thymine, which are difficult to repair as thymine is a normal DNA component. As the methylation of
CpG is adopted as the functional regulator in vertebrates, the characteristics of CpG depletion are ubiquitously observed in vertebrate genomes (Fig. S2–S5).
In invertebrates, such as insects, the patterns of methylation are much more diversified. In accordance with the observation that the methylation of the fruit fly (Drosophila melanogaster) genome is restricted to the early stages of embryonic development [17], appreciable CpG depletion is not observed (Fig. 14). By contrast, the CpG methylation in the honey bee (Apis mellifera) genome contributes to important developmental determinations to become a queen or a worker [18]. Unexpectedly, however, the CpG-containingk-mers are overrepresented (Fig. 15) in contrast to the observations of vertebrate genomes. To solve this discrepancy, we analyze the methylation of theA. melliferagenome in more detail. Methylation of A. mellifera genome. The methylation status of theA. melliferagenome was obtained from the results of bisulfite sequencing of queen brain genome [19] (accession Figure 12. Exhibition of TGCs in a science outreach event.The mobile sculpture is composed along the tree of life.
number: SRA012457) by means of the same method as that explained in the original paper [19].
It is known that the methylation sites are specifically located at exons [19] and CpG methylation of them is used to control the activities of the genes [20]. Then, we classify a gene into two categories, methylated and unmethylated, by the criterion whether the gene has at least one methylated exon or not. The CpG observation/expectation (o/e) ratios of theA. melliferagenes (i.e., f(CG)=f(C)=f(G)) have a bimodal distribution [20] and the methylated genes are categorized into the low CpG class [19]. Indeed, the average CpG (o/e) ratio of the methylated genes is 0.632 whereas that of the unmethylated genes is 1.13. This result indicates that the CpG depletion actually occurs in the methylated genes.
Because of their larger sizes, intergenic regions have a greater contribution than intragenic regions to the characteristics of the whole genome. Then, we extract two types of intergenic regions, those between methylated genes (IGm) and those between unmethylated genes (IGu). Although the discrimination between IGm and IGu is made by the methylation states of its adjacent genes but not by those of IGm and IGu themselves, IGm has significantly more methylation sites than IGu (Table S1). In addition, the length of IGm(average 2,880 bp and total*9 Mbp) is one order of magnitude less than that of IGu (19,133 bp and *39 Mbp) (Fig. S6). Therefore, IGuis mainly responsible for the CpG overrepresentation of theA. melliferagenome.
It is still unclear whether the CpG overrepresentation in IGuis simply explained by the lack of methylation. To answer this question, we compare IGu with the intergenic regions of theD. melanogastergenome which is not methylated at the adult stage [17]. TGC is critical for such a comparative analysis, in which we use the intergenic sequences of D. melanogaster as the background frequency fB in Equation (9). The result shows that the CpG-containingk-mers are more overrepresented in theA. melliferaIGu than in the intergenic regions ofD. melanogaster(Fig. 16), suggesting that the CpGs inA. melliferaIGuare maintained more actively than the passive effect of unmethylation.
It is notable that not all but only particular CpG-containing sequences, e.g., CGA, CGT, ACG, TCG, and CGCG, are overrepresented (Fig. 16). This result suggests the existence of motifs around CpG. To find a potential motif(s) around CpG in IGu, we plot the weight matrix, i.e., the log odds ratiom of the conditional probability:
m(X,i)~log2
f(XDi)
f(X) , X[fA,T,C,Gg, ð10Þ
where i is the position from CG and f(XDi) indicates the conditional frequency of nucleotideX at positioni. As shown in Figure 13. TGC of human genome (Homo sapiens). Octamer
frequencies are depicted. The background frequency is determined by the zeroth-order Markov model.
doi:10.1371/journal.pone.0086133.g013
Figure 14. TGC of fruit fly genome (Drosophila melanogaster). Octamer frequencies are depicted. The background frequency is determined by the zeroth-order Markov model.
doi:10.1371/journal.pone.0086133.g014
Figure 15. TGC of honey bee genome (Apis mellifera).Octamer frequencies are depicted. The background frequency is determined by the zeroth-order Markov model.
Fig. 17, the most prominent motif is CTCGAG and the second most prominent motif is CGCGCG.
The consensus sequence CTCGAG coincides with the recog-nition site of restriction enzymeXhoI. This enzyme is known to recognize unmethylated CpG, suggesting that the consensus sequence may be the binding target of a protein that has DNA binding ability and competes with methyltransferase. By contrast, the consensus sequence CGCGCG can originate from tandem repeats of CpG. Because it is known that tandem repeats tend to be unmethylated in theA. melliferagenome [21], this motif may be involved in the mechanisms preventing DNA in tandem repeats from methylation. These motifs are overrepresented in IGu in comparison with IGmand these characteristics are also conserved in related species (Fig. S7 and S8). Consequently, CTCGAG and CGCGCG are considered to be functional motifs specific to the unmethylated regions and the reason for the CpG overrepresen-tation is that these consensus sequences having CpG are
Conclusions
We have proposed the tetrahedral Gray code (TGC) to visually represent the genome information of various organisms. The mobile sculpture of TGC is informative for comparative genomics. Indeed, we got the idea of the specificity of theA. melliferagenome by observing this mobile sculpture. For a single genome, the TGC condition is useful for finding motif-like structures observed as a contiguous region with high frequencies. The boundary of such a region is also important. Ask-mers bordering each other on the boundary differ by only one nucleotide, the drastic change of their frequencies ensures the importance of this divergent nucleotide. This contiguous property helps us to better understand the observed characteristics compared with CGR in which neighbor-ingk-mers can be completely different.
The structure of TGC is clarified by making its paper craft. In order to make a paper craft of given genomes, the online and stand-alone versions of the application, named Padog, are available at our website:
http://www.genome.ist.i.kyoto-u.ac.jp/,ichinose/padog/.
Supporting Information
Figure S1 Exhibition of TGCs of 34 organisms in a science outreach event. The mobile sculpture is composed along the tree of life.
(TIFF)
Figure S2 TGC of mouse genome (Mus musculus).
Octamer frequencies are depicted. The background frequency is determined by the zeroth-order Markov model.
(TIFF)
Figure S3 TGC of chicken genome (Gallus gallus).
Octamer frequencies are depicted. The background frequency is determined by the zeroth-order Markov model.
(TIFF)
Figure S4 TGC of frog genome (Xenopus tropicalis).
Octamer frequencies are depicted. The background frequency is determined by the zeroth-order Markov model.
(TIFF)
Figure S5 TGC of zebrafish genome (Danio rerio).
Octamer frequencies are depicted. The background frequency is determined by the zeroth-order Markov model.
(TIFF)
Figure S6 Distributions of lengths of intergenic regions IGmand IGu.
(TIFF) Figure 16. Comparative visualization of IGu of A. mellifera
genome with intergenic regions of D. melanogaster genome. Octamer frequencies are depicted. The background frequency is determined byD. melanogastergenome.
doi:10.1371/journal.pone.0086133.g016
References
1. Jeffrey HJ (1990) Chaos game representation of gene structure. Nucleic Acids Res., 18(8), 2163–2170.
2. Basu S, Pan P, Dutta C, Das J (1997) Chaos game representation of proteins, J. of Mol. Graphics and Modelling, 15, 279–289.
3. Almeida JS, Vinga S (2002) Universal sequence map (USM) of arbitrary discrete sequences. BMC Bioinfo., 3: 6.
4. Deschavanne PJ, Giron A, Vilain J, Fagot G, Fertil B (1999) Genomic signature: Characterization and classification of species assessed by chaos game representation of sequences. Mol. Biol. Evol., 16(10), 1391–1399.
5. Hao B-L, Lee HC, Zhang S-Y (2000) Fractals related to long DNA sequences and complete genomes, Chaos, Solitons and Fractals, 11, 825–836. 6. Gutie´rrez JM, Rodrı´guez MA, Abramson G (2001) Multifractal analysis of DNA
sequences using a novel chaos-game representation. Physica A, 300, 271–284. 7. Almeida JS, Carric¸o JA, Maretzek A, Noble PA, Fletcher M (2001) Analysis of
genomic sequences by Chaos Game Representation. Bioinformatics, 17(5), 429– 437.
8. Gray F (1947) Pulse code communication. U.S. Patent 2632058.
9. Er MC (1984) On generating theN-ary reflected Gray codes, IEEE Trans. on Comp., C-33 (8), 739–741.
10. Ichinose N, Yada T, Gotoh O (2012) Large-scale motif discovery using DNA Gray code and equiprobable oligomers. Bioinformatics, 28(1), 25–31. 11. de Bruijn NG (1946) A Combinatorial Problem. Koninklijke Nederlandse
Akademie v. Wetenschappen, 49, 758–764.
12. Feldman W, Pevzner P (1994) Gray code masks for sequencing by hybridization. Genomics, 23, 233–235.
13. Akiyama J, Hirata K, Kobayashi M, Nakamura G (2006) Convex developments of a regular tetrahedron. Comp. Geometry, 34, 2–10.
14. Akiyama J (2007) Tile-makers and semi-tile-makers. Amer. Math. Mon., 114(7), 602–609.
15. Duzhin SV, Chebotarevskii BD (2004) Transformation groups for beginners, AMS, Student Mathematical Library 25.
16. Cooper DN, Krawczak M (1989) Cytosine methylation and the fate of CpG dinucleotides in vertebrate genomes. Hum. Genet., 83(2), 181–188.
17. Lyko F, Ramsahoye BH, Jaenisch R (2000) DNA methylation inDrosophila melanogaster. Nature, 408, 538–540.
18. Kucharski R, Maleszka J, Foret S, Maleszka R (2008) Nutritional Control of Reproductive Status in Honeybees via DNA Methylation. Science, 319(5871), 1827–1830.
19. Lyko F, Foret S, Kucharski R, Wolf S, Falckenhayn C, et al. (2010) The honey bee epigenomes: Differential methylation of brain DNA in queens and workers. PLoS Biol., 8(11), e1000506.
20. Foret S, Kucharski R, Pittelkow Y, Lockett GA, Maleszka R (2009) Epigenetic regulation of the honey bee transcriptome: unravelling the nature of methylated genes. BMC Genomics, 10: 472.
21. Feng S, Cokus S, Zhang X, Chen PY, Bostick M, et al. (2010) Conservation and divergence of methylation patterning in plants and animals. PNAS, 107(19), 8689–8694.