Maternal Severity Index Model (MSI): Tools for Assessing
the Management of Severe Maternal Morbidity
Joao Paulo Souza1*, Jose Guilherme Cecatti2, Samira M. Haddad2, Mary Angela Parpinelli2, Maria Laura Costa2, Leila Katz3, Lale Say1, on behalf of the Brazilian Network for Surveillance of Severe Maternal Morbidity Group"
1UNDP/UNFPA/WHO/World Bank Special Programme of Research, Development and Research Training in Human Reproduction, Department of Reproductive Health and Research, World Health Organization, Geneva, Switzerland,2Department of Obstetrics and Gynecology, School of Medical Sciences, University of Campinas (UNICAMP), Campinas, Brazil,3Department of Obstetrics, Instituto de Medicina Integral Prof. Fernando Figueira (IMIP), Recife, Pernambuco, Brazil
Abstract
Objectives:To validate the WHO maternal near-miss criteria and develop a benchmark tool for severe maternal morbidity assessments.
Methods: In a multicenter cross-sectional study implemented in 27 referral maternity hospitals in Brazil, a one-year prospective surveillance on severe maternal morbidity and data collection was carried out. Diagnostic accuracy tests were used to assess the validity of the WHO maternal near-miss criteria. Binary logistic regression was used to model the death probability among women with severe maternal complications and benchmark the management of severe maternal morbidity.
Results:Of the 82,388 women having deliveries in the participating health facilities, 9,555 women presented pregnancy-related complications, including 140 maternal deaths and 770 maternal near misses. The WHO maternal near-miss criteria were found to be accurate and highly associated with maternal deaths (Positive likelihood ratio 106.8 (95% CI 99.56–114.6)). The maternal severity index (MSI) model was developed and found to able to describe the relationship between life-threatening conditions and mortality (Area under the ROC curve: 0.951 (95% CI 0.909–0.993)).
Conclusion: The identification of maternal near-miss cases using the WHO list of pregnancy-related life-threatening conditions was validated. The MSI model can be used as a tool for benchmarking the performance of health services managing women with severe maternal complications and provide case-mix adjustment.
Citation:Souza JP, Cecatti JG, Haddad SM, Parpinelli MA, Costa ML, et al. (2012) The WHO Maternal Near-Miss Approach and the Maternal Severity Index Model (MSI): Tools for Assessing the Management of Severe Maternal Morbidity. PLoS ONE 7(8): e44129. doi:10.1371/journal.pone.0044129
Editor:Landon Myer, University of Cape Town, South Africa
ReceivedFebruary 20, 2012;AcceptedAugust 1, 2012;PublishedAugust 29, 2012
Copyright:ß2012 Souza et al. This is an open-access article distributed under the terms of the Creative Commons Attribution License, which permits unrestricted use, distribution, and reproduction in any medium, provided the original author and source are credited.
Funding:The Brazilian Network for Surveillance of Severe Maternal Morbidity was financially supported by CNPq/DECIT (The Brazilian National Research Council and the Department of Science and Technology of the Brazilian Ministry of Health), grant number 402702/2008-5. The funders had no role in study design, data collection and analysis, decision to publish, or preparation of the manuscript.
Competing Interests:The authors have declared that no competing interests exist. * E-mail: [email protected]
"Membership of the Neoned Study Group and LNF Study Group is provided in the Acknowledgments.
Introduction
An estimated 287 000 maternal deaths occurred in 2010 around the world. Despite the substantial reduction as compared to 1990, much has to be done for achieving the relevant target of the Millennium Development Goals [1]. Most of the burden of maternal deaths is carried by low-income countries, but maternal mortality is still a relevant public health problem among middle-income countries. In this context, strengthening health systems and services to provide optimal care for women during pregnancy and childbirth is crucial, particularly to those women experiencing acute pregnancy-related complications [2–5].
Confidential enquiries of maternal deaths have been used for many years to understand health systems and services failures in
near-miss audits have been considered as useful approaches to improve maternal health care [7,8].
In 2008, the World Health Organization (WHO) has adopted a maternal near-miss definition and established standard criteria for the identification of women presenting pregnancy-related life-threatening conditions. Women surviving any of the life-threaten-ing conditions listed in the Table 1 durlife-threaten-ing pregnancy, childbirth, or postpartum are considered as maternal near-miss cases by WHO. The WHO definition enables a common ground for the implementation of maternal near-miss assessments across coun-tries and allows international comparisons to be carried out [9].
Validation of the Set of the WHO Criteria for Identifying Women with Life-threatening Conditions
The WHO maternal near-miss definition and identification criteria have been developed using the collective wisdom of a group of international experts gathered by WHO in an evidence-informed process [9]. A systematic review summarizing the range of previous related experiences provided the scientific basis for the development of the WHO definition and identification criteria [10]. Intensive-care prognostic and severity assessment scores, such as the APACHE II, SAPS, MODS and particularly the SOFA score, were reviewed as possible sources of severity markers for identifying women with life-threatening conditions [11–13]. A secondary analysis of a previous multicountry study was conducted to explore pragmatic identification criteria for maternal near misses [14]. In addition, a small preliminary study was carried for piloting and pre-validating the criteria proposed by the WHO working group [15].
In spite of the evidence-informed process that led the development of the WHO criteria for identifying women with life-threatening conditions, an actual validation of such criteria is required. The validation of such criteria depends on the similarity
between maternal deaths and maternal near-miss cases. From the conceptual standpoint, near-miss cases should be as similar to maternal deaths as possible. However, the development of criteria to identify near-miss cases is challenged by the absence of a gold-standard for near-miss cases. In addition, the identification of near-miss cases is always retrospective, i.e. the woman needs to survive the life-threatening complication in order to be considered as a near-miss case. In this context and considering a set of criteria as a diagnostic test, it is assumed that a set of criteria able to accurately ‘‘identify’’ maternal deaths would have as false positives the maternal near-miss cases. Truly-positive cases (maternal deaths) would be similar to false positive cases (maternal near-miss cases) except the vital status [14].
Development of a Benchmarking Tool
Populations of critically ill patients may differ in their mortality risks, depending on the severity of individual cases, the case-mix, and the quality of the therapeutic management, among other factors. Prognostic/risk-scoring systems have been used in the assessment of medical and surgical critically ill patients. Most of these systems are based on mathematical models and aim at determining the position of individual patients in the spectrum of severity. By providing a judgment-free assessment of individual risks, these tools enable neutral case-mix adjustments for groups of patients. Some of these tools also enable an assessment of health service performance in the provision of care, as they allow an estimation of expected mortality considering the specific popula-tion case-mix. By comparing the observed mortality to the expected mortality in the population, a sense of appropriateness of care can be made [11,12,16,17]. This is a benchmark approach, which uses the population that generated the model as the standard for comparison [17]. Some attempts to use these generic systems in populations of severely-ill obstetric populations have
Table 1.The WHO set of severity markers (life-threatening conditions) used in maternal near-miss assessments.
Group A* Group B*
Cardiovascular dysfunction N Shock N pH,7.1
N Lactate.5 N Use of continuous vasoactive drugs
N Cardiac arrest
N Cardio-pulmonary resuscitation (CPR)
Respiratory dysfunction N Acute cyanosis N Gasping
N Respiratory rate.40 or,6/min N PaO2/FiO2,200 mmHg
N Oxygen saturation,90% for$60 minutes N Intubation and ventilation not related to anesthesia
Renal dysfunction N Oliguria non responsive to fluids or diuretics N Creatinine$300 mmol/l or$3,5 mg/dl N Dialysis for acute renal failure
Coagulation/hematological dysfunction
N Clotting failure N Acute thrombocytopenia (,50 000 platelets)
N Transfusion of$5 units of blood/red cells
Hepatic dysfunction N Jaundice in the presence of pre-eclampsia N Bilirubin.100 mmol/l or.6,0 mg/dl Neurological dysfunction N Metabolic coma (loss of consciousness AND
the presence of glucose and ketoacids in urine)
N Coma/loss of consciousness lasting 12 hours or more
N Stroke
N Status epilepticus/Uncontrollable fits/total paralysis
Uterine dysfunction N Hysterectomy due to infection or hemorrhage
*A glossary with relevant operational definitions is available at reference 28. Stratification of the WHO life-threatening conditions is based on the SOFA score (reference 30). Group B reflects SOFA score categories 3 and 4 (i.e. markers of greater severity).
been made, but the accuracy of these systems has been considered as suboptimal, possibly due to the mismatch between the reference population (general, non-obstetric) and the target population (obstetric) [18–22].
The WHO criteria are a package of 25 severity markers portraying a comprehensive range of life-threatening conditions. Each of these severity markers is associated with a specific relationship with mortality. In addition, women experiencing pregnancy-related complications can present more than one of these severity markers. Thus, combinations of severity markers would be associated with different mortality risks. For instance, a woman that presents postpartum hemorrhage and undergoes a hysterectomy due to uterine atony has a different risk of death as compared to a woman presenting several markers of severity denoting multiple organ dysfunctions. Similarly, depending on the case-mix, a population of women presenting life-threatening conditions may differ in its relationship with mortality in comparison to other populations of women presenting life-threatening conditions. Thus, a benchmark tool able to minimize severity bias by providing case-mix adjustment and enable comparisons to a reference population would improve the applicability of the maternal near-miss concept and enable more appropriate comparisons between populations.
Objectives
The present analysis aims at validating the WHO criteria for identification of women with pregnancy-related life-threatening conditions and developing a benchmark tool for severe maternal morbidity assessments.
Methods
Ethics Statement
This project has been reviewed and approved by the National Council for Ethics in Research (CONEP, Brazilian Ministry of Health) and by the Institutional Review Boards of each site (listed below). All data was obtained from medical records and did not identify participants. The National Council for Ethics in Research and the Institutional Review Boards of each site granted a waiver of individual informed consent.
The Review Boards of the following institutions reviewed and approved this project: Maternidade Cidade Nova Dona Nazarina Daou (Manaus, AM), Maternidade Clime´rio de Oliveira (Salva-dor, BA), Hospital Geral de Fortaleza (Fortaleza, CE), Hospital Geral Dr. Ce´sar Cals (Fortaleza, CE), Maternidade Escola Assis Chateaubriand (Fortaleza,CE), Hospital Materno Infantil de Goiaˆnia (Goiaˆnia, GO), Hospital Universita´rio da Universidade Federal do Maranha˜o (Sa˜o Luis, MA), Maternidade Odete Valadares (Belo Horizonte, MG), Instituto de Sau´de Elı´dio de Almeida (Campina Grande,PB), Hospital Universita´rio Lauro Wanderley da Universidade Federal da Paraiba (Joa˜o Pessoa, PB), Centro Integrado de Sau´de Amaury de Medeiros (Recife, PE), Instituto de Medicina Integral Prof. Fernando Figueira (Recife, PE), Hospital das Clı´nicas da Universidade Federal de Pernanm-buco (Recife, PE), Hospital das Clı´nicas da Universidade Federal do Parana´ (Curitiba, PR), Hospital Maternidade Fernando Magalha˜es (Rio de Janeiro, RJ), Instituto Fernandes Figueira (Rio de Janeiro, RJ), Hospital das Clinicas da Universidade Federal do Rio Grande do Sul (Porto Alegre, RS), Faculdade de Medicina de Botucatu da Universidade Estadual Paulista (Botucatu, SP), Hospital da Mulher da Universidade Estadual de Campinas (Campinas, SP), Hospital e Maternidade Celso Pierro da Pontifı´cia Universidade Cato´lica (Campinas, SP), Hospital Israelita Albert Einstein (Sa˜o Paulo, SP), Faculdade de Medicina
de Jundiaı´ (Jundiaı´, SP), Hospital das Clı´nicas da Faculdade de Medicina de Ribeira˜o Preto da Universidade de Sa˜o Paulo (Ribeira˜o Preto, SP), Santa Casa de Limeira (Limeira, SP), Santa Casa de Sa˜o Carlos (Sa˜o Carlos, SP), Casa Maternal Leonor Mendes de Barros (Sa˜o Paulo, SP), Hospital Sa˜o Paulo da Universidade Federal de Sa˜o Paulo (Sa˜o Paulo, SP).
Study Design
Methodological details of the Brazilian Network for Surveillance of Severe Maternal Morbidity Study have been published elsewhere [23,24]. Briefly, this is a multicenter, cross-sectional study implemented in 27 Brazilian referral maternity hospitals. A convenience sampling strategy was used to build the network of health facilities. Aiming at lessening the impact of the non-random sampling and optimizing the representativeness of Brazilian referral maternity hospitals, an adequate mix of health facilities was sought: public and private health facilities, university and non-university hospitals, at least one health facility from each of the five country macro-regions. The number of health facilities was determined based on the number of maternal deaths and maternal-near miss cases required to validate the use of the WHO criteria for pregnancy-related life-threatening conditions and carry out other relevant analysis. Based on previous studies [10,25], a total of approximately 75,000 deliveries would have to be screened in order to identify around 100 maternal deaths and 600 maternal near miss cases.
com-pliant database solution and study management system was used (OpenClinica, Akaza Research, LLC, 2009, Waltham, MA, USA, www.openclinica.org).
Data Quality
Several procedures were adopted to ensure high quality data and reliable information, including preparatory meetings, site visits, close monitoring of data collection and data entry, concurrent query management, inconsistency checks, double data collection for selected medical charts, and use of a detailed manual of operation. In the preparatory meetings, study coordinators and data collectors from each site were trained in the study procedures. The study protocol, manual of operation and study forms were thoroughly reviewed; training was provided on the use of the web-based data management system. During data collection the participating hospitals received continuous support including site visits. In the site visits, the study implementation was assessed and selected medical records were checked against data entered in the data management system. In addition, the web-based data management system used in this study is compliant with Good Clinical Practice (GCP) and regulatory guidelines (e.g. 21 CFR Part 11), allowing differentiated user roles and privileges, password and user authentication security, electronic signatures, SSL encryption, de-identification of Protected Health Information (PHI). Auditing to record and monitor access and data changes aligned with a set of validation and cross checking rules were implemented as part of the online data-management. Through this comprehensive package of data quality procedures reliable and high quality data were obtained.
Statistical Analysis
The Maternal Mortality Ratio (MMR) with 95% Confidence Intervals (CI) was determined based on the total of live births that took place in the participating hospitals during the data collection period. The study maternal mortality data was compared with the WHO maternal mortality estimates for 2010 in Brazil (together with its range of uncertainty) [1]. Sensitivity, specificity, positive and negative likelihood ratios were used to determine the accuracy of the WHO criteria in the identification of women with life-threatening conditions. Vital status at discharge was considered as the gold standard for identifying women with life-threatening conditions. The prevalence of women with life-threatening complications, maternal deaths and maternal near-miss cases was calculated. In addition, the prevalence and mortality estimates together with crude relative risks and 95% CI were calculated for each severity marker.
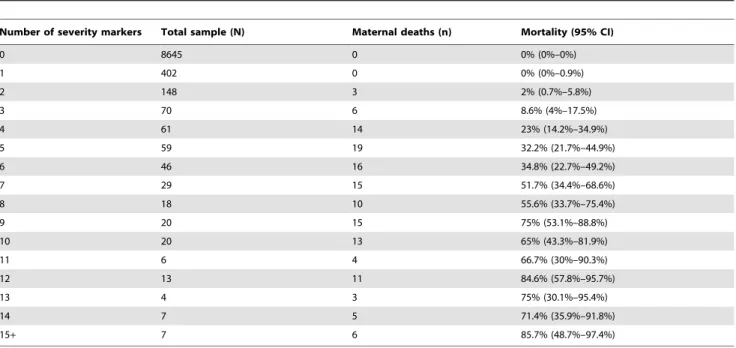
It was hypothesized that the number of severity markers present in each case would be correlated with mortality. The study population was categorized according with the total number of severity markers per case. In each category, the frequency of cases and mortality with 95% confidence interval was determined. The correlation between number of markers per case and mortality was determined by calculating the Pearson’s correlation coefficient. In each case, the total number of severity markers is hereby defined as the maternal severity score.
Two binary logistic regressions models were developed and tested to describe the relationship between (severe) morbidity and mortality. In order to enable this, the study population was split in two: the subpopulation ‘‘A’’ (used for model development), and the subpopulation ‘‘B’’ (used for model testing) [27]. The size of the subpopulation ‘‘B’’ was determined considering that the area under the Receiver Operating Characteristic curve (AUROC) would be used as an estimator of model validity. The following parameters were used in the subpopulation ‘‘B’’ sample size
calculation: 0.05 as the probability of making a Type I error, 0.20 as the probability of making a Type II error, AUROC 0.500 as null hypothesis value, and 0.800 as the minimum expected AUROC. Based on these parameters, a total of 28 maternal deaths would be required in the subpopulation ‘‘B’’ for the comparison of the AUROC with the null hypothesis value. Considering the total number of maternal deaths included in the study database, 80% of the study population was randomly allocated to the population ‘‘A’’ and the remainder (20%) was allocated to the population ‘‘B’’.
The model I consisted in a univariate analysis including only the maternal severity score (i.e. the number of WHO severity markers). The model II tested the maternal severity score, distal predictors of maternal deaths (e.g. obstetric and demographic variables, direct and indirect causes of maternal deaths) and life-threatening conditions categorized as presented in the Table 1. In the multivariate analysis (model 2), a stepwise approach was used and only predictors that contributed significantly to the model were retained (the probabilities for stepwise were set as 0.05 (entry) and 0.10 (removal)). These logistic regression models estimate the probability of maternal death based on the presence or absence of severity markers and other relevant characteristics [27]. The Hosmer-Lemeshow goodness-of-fit test was used to assess the ability of these models in adequately describing the data. The Nagelkerke R square test was used to estimate the proportion of variance in maternal mortality associated with the models’ predictors. The area under the ROC curve was determined for the Maternal Severity score and the models I and II. The best performing model was selected to generate the Maternal Severity Index (MSI), hereby defined as the estimated probability of maternal death.
PASW Statistics 18, Release Version 18.0.0 (SPSS, Inc., 2009, Chicago, IL, www.spss.com) was the main statistical package used in this analysis. MedCalcH Version 11.6.1.0 (MedCalc Soft-ware,2011, Mariakerke, Belgium, www.medcalc.org) was used for AUROC sample size calculation.
Results
relative risks ranging from 20 to 60, and 6 presented relative risks over 60. The amount of severity markers per case (the maternal severity score) presented a very high positive correlation with mortality as illustrated in the Figure 1 and Table 4.
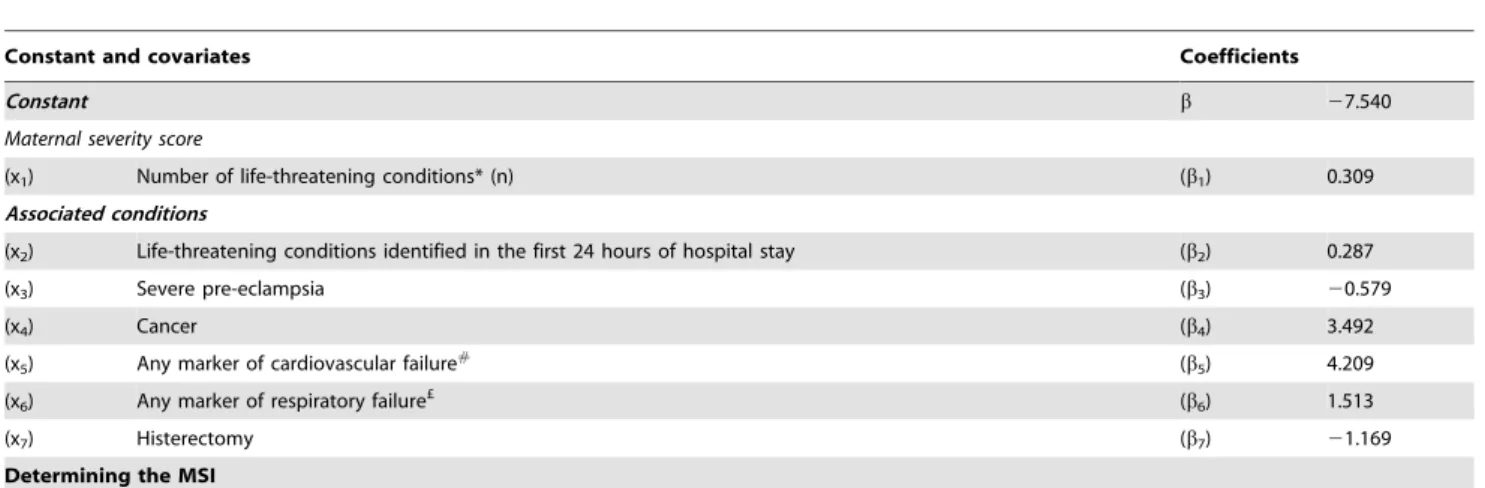
The logistic regression models were developed in the subpop-ulation ‘‘A’’, which included a total of 7,674 randomly selected cases (111 maternal deaths). The models were tested in the subpopulation ‘‘B’’, which included a total of 1881 cases (29 maternal deaths). The size of each subpopulation complied with the predetermined study sample size requirements. Table 5 summarizes the performance of the models and the maternal severity score. The model II presented a better death prediction performance as evaluated by the Hosmer-Lemeshow test, Nagelk-erke R2test, and the percentage of maternal deaths with a model-estimated death probability greater than 50%. Based on these findings, the model II was selected to become the MSI model. Table 6 presents the covariates that were retained in the model II (i.e. the MSI model) together with the coefficients that correspond to each covariate. The death probability can be obtained using the formula presented in the Table 5. A downloadable calculator has been developed to facilitate the use of the MSI (Appendix S1).
Discussion
The WHO criteria for pregnancy-related life-threatening conditions were found to be highly associated with maternal deaths. Survivors of the WHO pregnancy-related life-threatening conditions can be accurately classified as maternal near-miss cases. A severity score representing the total number of life-threatening conditions present in each case and a mathematical model describing the relationship between severity markers and maternal deaths have been developed.
Scoring systems have been used to evaluate severity and outcome of critically ill patients since many years. APACHE, SAPS, and SOFA systems are among the most used ones [11]. Some of these systems are extensively used for intensive care benchmarking and quality of care assessment [16,17]. Notwith-standing, these systems have been developed based on general critical care populations from developed countries. In these reference populations, obstetric patients were largely omitted or underrepresented, either because pregnant women were excluded, or because maternal deaths are rare events in the countries where
these systems were developed. Another issue that should be acknowledged is that the physiological changes of pregnancy affect some of the markers used by general severity scoring systems leading to overestimation of severity [18]. Also, diseases that are exclusive to this period of life (e.g. eclampsia, HELLP syndrome, acute fatty liver of pregnancy, amniotic fluid embolism), have peculiar characteristics that may not have been adequately addressed by scores designed for general populations. Owing to this, the performance of these systems in obstetric population is challenged, particularly in developing countries. Limitations are observed in the discriminatory power and the calibration of generic scoring systems when applied to obstetric population [12,15,19–22].
The maternal severity score and the MSI model, developed in this study, may contribute for a better assessment of severity of obstetric populations and enable a benchmark approach to quality of care of women experiencing severe complications related with pregnancy. As part of the strengths of this analysis, the MSI model was developed in a large multicenter study, which had an appropriate sample both in terms of number of critically ill obstetric patients and maternal deaths. The study population was large enough to allow adequate model development and testing in different subsets of the study population as methodologically recommended [27]. In the end, the MSI model was found to be robust, presenting good performance and discriminatory power. There are also two additional potential advantages that should be noted: the MSI model was developed based on the WHO criteria for pregnancy-related life-threatening conditions and the study database reflects the standard of care provided in obstetric referral hospitals from a developing country.
The WHO criteria for pregnancy-related life-threatening conditions are part of a strategy promoted by WHO for assessing and improving quality of maternal health care [8,9,28]. These criteria are used in the identification of maternal near-miss cases in clinical audits and other near-miss studies. Together with routine implementation, there are several near-miss research projects being currently conducted around the world using these criteria. In addition to external validation, these initiatives may favor further dissemination of the maternal near miss concept and enable the use of the MSI model as a benchmark tool.
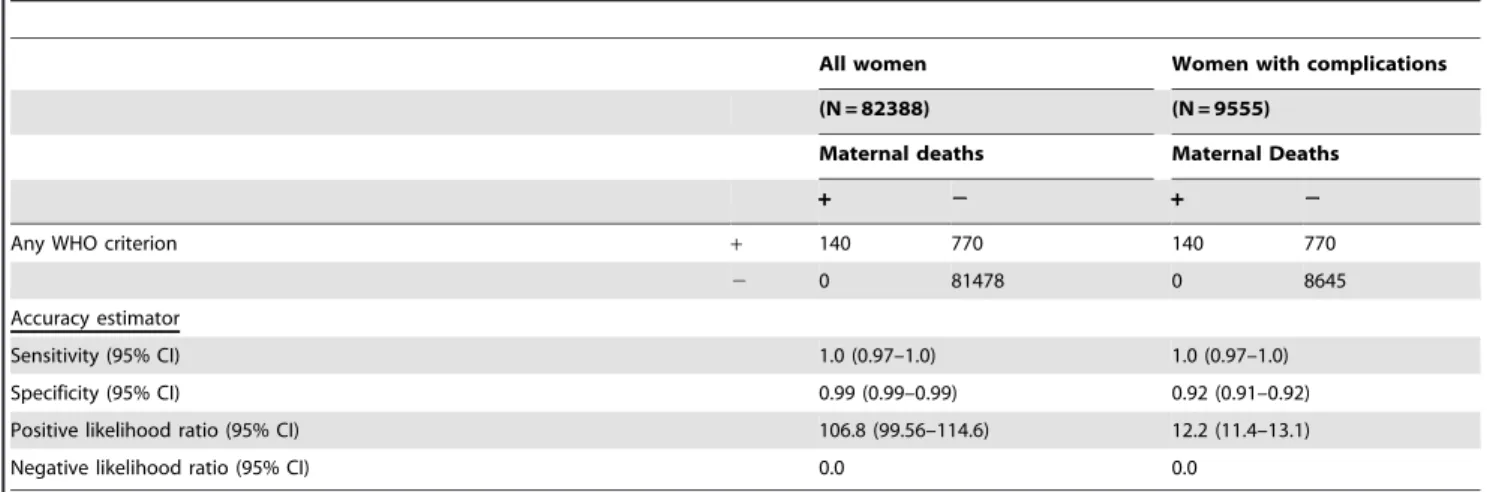
As in other severity models, the MSI model reflects the characteristics and standards of care received by the population Table 2.Accuracy of the WHO set of severity markers in the prediction of maternal deaths among all women and women with pregnancy-related complications *.
All women Women with complications
(N = 82388) (N = 9555)
Maternal deaths Maternal Deaths
+ 2 + 2
Any WHO criterion + 140 770 140 770
2 0 81478 0 8645
Accuracy estimator
Sensitivity (95% CI) 1.0 (0.97–1.0) 1.0 (0.97–1.0)
Specificity (95% CI) 0.99 (0.99–0.99) 0.92 (0.91–0.92)
Positive likelihood ratio (95% CI) 106.8 (99.56–114.6) 12.2 (11.4–13.1)
Negative likelihood ratio (95% CI) 0.0 0.0
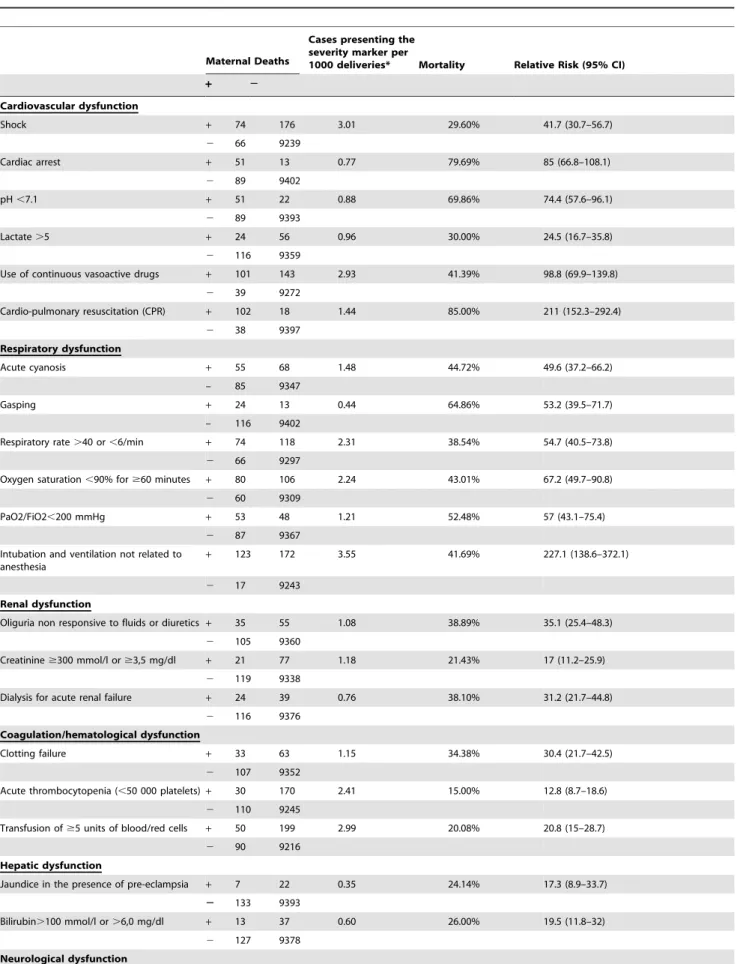
Table 3.Relationship between severity markers (WHO criteria) and maternal deaths.
Maternal Deaths
Cases presenting the severity marker per
1000 deliveries* Mortality Relative Risk (95% CI)
+ 2
Cardiovascular dysfunction
Shock + 74 176 3.01 29.60% 41.7 (30.7–56.7)
2 66 9239
Cardiac arrest + 51 13 0.77 79.69% 85 (66.8–108.1)
2 89 9402
pH,7.1 + 51 22 0.88 69.86% 74.4 (57.6–96.1)
2 89 9393
Lactate.5 + 24 56 0.96 30.00% 24.5 (16.7–35.8)
2 116 9359
Use of continuous vasoactive drugs + 101 143 2.93 41.39% 98.8 (69.9–139.8)
2 39 9272
Cardio-pulmonary resuscitation (CPR) + 102 18 1.44 85.00% 211 (152.3–292.4)
2 38 9397
Respiratory dysfunction
Acute cyanosis + 55 68 1.48 44.72% 49.6 (37.2–66.2)
– 85 9347
Gasping + 24 13 0.44 64.86% 53.2 (39.5–71.7)
– 116 9402
Respiratory rate.40 or,6/min + 74 118 2.31 38.54% 54.7 (40.5–73.8)
2 66 9297
Oxygen saturation,90% for$60 minutes + 80 106 2.24 43.01% 67.2 (49.7–90.8)
2 60 9309
PaO2/FiO2,200 mmHg + 53 48 1.21 52.48% 57 (43.1–75.4)
2 87 9367
Intubation and ventilation not related to anesthesia
+ 123 172 3.55 41.69% 227.1 (138.6–372.1)
2 17 9243
Renal dysfunction
Oliguria non responsive to fluids or diuretics + 35 55 1.08 38.89% 35.1 (25.4–48.3) 2 105 9360
Creatinine$300 mmol/l or$3,5 mg/dl + 21 77 1.18 21.43% 17 (11.2–25.9)
2 119 9338
Dialysis for acute renal failure + 24 39 0.76 38.10% 31.2 (21.7–44.8)
2 116 9376 Coagulation/hematological dysfunction
Clotting failure + 33 63 1.15 34.38% 30.4 (21.7–42.5)
2 107 9352
Acute thrombocytopenia (,50 000 platelets)+ 30 170 2.41 15.00% 12.8 (8.7–18.6) 2 110 9245
Transfusion of$5 units of blood/red cells + 50 199 2.99 20.08% 20.8 (15–28.7)
2 90 9216
Hepatic dysfunction
Jaundice in the presence of pre-eclampsia + 7 22 0.35 24.14% 17.3 (8.9–33.7) 2 133 9393
Bilirubin.100 mmol/l or.6,0 mg/dl + 13 37 0.60 26.00% 19.5 (11.8–32)
that provided data for its development. Brazil is the largest country in Latin America and the world’s fifth largest country (both by geographical area and population). It is an upper-middle income country which overall MMR is estimated as 56 maternal deaths per 100,000 live births in 2010 by WHO [1]. This study includes a substantial proportion of all maternal deaths that are estimated to have occurred in the country during the data-collection period (8%, range of uncertainty 5–13%). The fact that the MSI model has been developed in an obstetric population is relevant for the applicability of this tool in other populations. This is particularly important in the context of other scoring systems (e.g. the APACHE family) that were developed in generic populations of developed countries. We believe that the application of the MSI to obstetric populations of other developing countries is more direct as compared to extrapolating results from non-obstetric popula-tions from developed countries. However, it should be noted that the standard of care provided by the participating facilities is being used as the reference for the MSI estimates. One would expect
that there may be still some limitations and constraints in the quality of care provided by the participating facilities. Thus, the underlying aim of using the MSI as a benchmark is to assess the health service performance against a standard and, through interventions to improve quality of care, achieve a superior performance.
This study has some limitations that are worth noting. First, the non-random nature of the facility sampling process may have introduced some level of selection bias, potentially impairing the country representativeness of this study. On the other hand, the convenience sampling approach was realistic and made this study feasible. Precautions have been taken to maximize country representativeness. An analysis based on the intra-cluster correla-tion coefficients provided some evidence supporting the success of these precaution measures [29]. Second, this study is largely based on information obtained from medical records. In order to reduce the chances of recording bias, information from medical records was complemented with information obtained directly from the assisting staff (if relevant information was missing and in case of doubt). In addition, several procedures to optimize quality of data have been put in place. Third, the study population is essentially provided by referral hospitals which tend to concentrate the more severe cases: the MMR observed in this study is about three times the overall MMR estimated for the country. Another aspect that deserves noting is the relationship between the various covariates within the MSI model. The maternal severity score (i.e. the total number of severity markers present in each case) is positively correlated with maternal mortality and as the number of life-threatening conditions increase, the death probability increases. If a life-threatening condition is identified at hospital arrival or within the first 24 hours of hospital stay, there is an increase in the risk of death, possibly denoting the fact that the woman has arrived in the hospital already in a very severe condition. Cancer and a cardiovascular or respiratory failure substantially increase the death risk. Two covariates (i.e. severe pre-eclampsia and hysterectomy) have negative coefficients denoting a ‘‘protective’’ association within the model. At the first glance this may seem counterintuitive, but these negative coefficients have to be considered in the context of severe maternal morbidity. Our Table 3.Cont.
Maternal Deaths
Cases presenting the severity marker per
1000 deliveries* Mortality Relative Risk (95% CI)
+ 2
Coma/loss of consciousness.12h + 36 29 0.78 55.38% 50.5 (37.8–67.5)
2 104 9386
Metabolic coma + 6 12 0.22 33.33% 23.7 (12.1–46.6)
2 134 9403
Stroke + 10 15 0.30 40.00% 29.3 (17.6–48.8)
2 130 9400 Status epilepticus/Uncontrollable fits/total
paralysis
+ 5 11 0.19 31.25% 22.1 (10.5–46.6)
2 135 9404 Uterine dysfunction
Hysterectomy due to infection or hemorrhage+ 22 149 2.06 12.87% 10.2 (6.7–15.7) 2 118 9266
*N = 82,388 deliveries.
doi:10.1371/journal.pone.0044129.t003
Figure 1. The relationship between the number of severity markers and mortality (the size of each bubble denotes the amount of cases).
interpretation to the negative coefficient associated to pre-eclampsia is that women presenting a severe health condition due to pre-eclampsia have the potential of a better outcome as compared to women in the same level of severity having other complications. This can be due to the fact that severe pre-eclampsia tend to be a transient complication and effective strategies to manage women with pre-eclampsia exist (e.g. fetal delivery, magnesium sulfate and anti-hypertensive drugs) and may have been used in the population that provided data to this model, resulting in reduced death risks. Similarly, hysterectomy plays a game-changing role in the outcome of women with uterine-related haemorrhage and infection.
There are several potential applications to both Maternal Severity Score and MSI. A primary application is determining the level of complexity and severity of a certain obstetric population. For example, a district hospital treating a population with an average maternal severity score = 0.5 is expected to require much more material and human resources than another district hospital
treating a population with a maternal severity score = 0.1. These two hypothetical district hospitals receive two different case-mix and the maternal severity score can be used to put the health service in context and support decision making for resource allocation. Another primary application is the health impact evaluation, as part of quality of care assessment. The average MSI can provide an estimation of the expected number of maternal deaths for a selected population. For example, a hypothetical obstetric population being treated in an intensive care unit or in a high dependency facility in a tertiary hospital has an average MSI of 10%. It means that in a group of 100 women treated in this facility it would be expected the occurrence of 10 maternal deaths. If 20 maternal deaths have taken place in this population, one could conclude that there may be some opportunities being missed in this facility and a strategy to improve care is needed. The MSI allows also inter-hospital and over-time comparisons. Another possible application is in research. In a randomized controlled trial, for instance, it is worthwhile determining if both trial arms
Table 5.The performance of the models I and II and the maternal severity score.
Hosmer-Lemeshow test*
Nagelkerke R2 test£
Percentage of maternal deaths with a model-estimated
death probability.50% (subpopulation ‘‘A’’)
Percentage of maternal deaths with a model-estimated
death probability.50%
(subpopulation ‘‘B’’) AUROC with 95% CI@
Model I ,0.001 0.629 45.9% 55.2% 0.955 (0.925–0.984)
Model II 0.402 0.745 66.7% 69.0% 0.954 (0.922–0.985)
Maternal Severity Score
N.A. N.A. N.A. N.A 0.955 (0.925–0.984)
*The Hosmer-Lemeshow test indicates a poor fit if p value is less than 0.05.
£The Nagelkerke R2values the proportion of variance in maternal mortality associated with the models’ predictors. Higher R2values, better model performance. @Area under the receiver operating characteristic curve with 95% confidence intervals calculated among women with life-threatening conditions of the subpopulation ‘‘B’’.
N.A.: not applicable.
doi:10.1371/journal.pone.0044129.t005
Table 4.Relationship between the number of severity markers (maternal severity score) and mortality*.
Number of severity markers Total sample (N) Maternal deaths (n) Mortality (95% CI)
0 8645 0 0% (0%–0%)
1 402 0 0% (0%–0.9%)
2 148 3 2% (0.7%–5.8%)
3 70 6 8.6% (4%–17.5%)
4 61 14 23% (14.2%–34.9%)
5 59 19 32.2% (21.7%–44.9%)
6 46 16 34.8% (22.7%–49.2%)
7 29 15 51.7% (34.4%–68.6%)
8 18 10 55.6% (33.7%–75.4%)
9 20 15 75% (53.1%–88.8%)
10 20 13 65% (43.3%–81.9%)
11 6 4 66.7% (30%–90.3%)
12 13 11 84.6% (57.8%–95.7%)
13 4 3 75% (30.1%–95.4%)
14 7 5 71.4% (35.9%–91.8%)
15+ 7 6 85.7% (48.7%–97.4%)
are comparable in terms of severity. Severity can functions as a major confounder: trial results can differ because of unbalances in the severity of the study populations (e.g. populations containing more severe cases tend to present worse health outcomes in comparison to populations with less severe cases). The maternal severity score and the MSI can be used for adjusting for the case-mix, through stratification or as a covariate in statistical modeling. In summary, the maternal severity score provide an estimation of the overall severity associated with a specific women or a selected population. Similarly, the MSI provides an estimate of the death risk. To maximize usability, the Appendix S1 contains a maternal severity score and maternal severity index calculator. As a final remark, the estimates derived from the MSI model are to be used with caution. A MSI with 95% of death risk means that among 100 women with similar conditions, 95 women may die. However, the model is not able to differentiate if the specific woman is among the 5 that will survive. Thus, MSI estimates should not directly guide the management of critically ill patients.
Conclusions
The identification of maternal near-miss cases using the WHO list of pregnancy-related life-threatening conditions is valid, as these conditions are accurately associated with maternal deaths. The MSI model adequately describes the relationship between severity markers and maternal deaths. The MSI model can be used as a tool for benchmarking, population severity assessment and case-mix adjustment. The use of the MSI model within a maternal near-miss approach has the potential of contributing to the assessment and improvement of maternal health care, particularly that required by women experiencing severe maternal morbidity. Further studies assessing the performance of the MSI model in other populations are welcome.
Supporting Information
Appendix S1 The Maternal Severity Index (MSI) Calculator (XLSX)
Acknowledgments
Brazilian Network for Surveillance of Severe Maternal
Morbidity Group (in alphabetical order).
Elson J Almeida Jr, Eliana M Amaral, Melania M Amorim, Carla B Andreucci, Ma´rcia M Aquino, Maria V Bahamondes, Antonio C Barbosa Lima, Frederico Barroso, Adriana Bione, Ione R Brum, Iracema M Calderon, Rodrigo S Camargo, Felipe F Campanharo, Luiz E Carvalho, Simone A Carvalho, Jose´ G Cecatti, George N Chaves, Eduardo Cordioli, Maria L Costa, Roberto A Costa, Sergio M Costa, Francisco E Feitosa, Djacyr M Freire, Simone P Gonc¸alves, Everardo M Guanabara, Daniela Guimara˜es, Lu´cio T Gurgel, Samira M Haddad, Leila Katz, Debora Leite, Moises D Lima, Gustavo Lobato, Fa´tima A Lotufo, Adriana G Luz, Nelson L Maia Filho, Marilia G Martins, Jacinta P Matias, Rosiane Mattar, Carlos A Menezes, Elaine C Moises, Olı´mpio B Moraes Filho, Joaquim L Moreira, Marcos Nakamura-Pereira, Denis J Nascimento, Maria H Ohnuma, Fernando C Oliveira Jr, Rodolfo C Pacagnella, Cla´udio S Paiva, Mary A Parpinelli, Robert C Pattinson, Liv B Paula, Jose C Perac¸oli, Frederico A Peret, Cynthia D Perez, Cleire Pessoni, Alessandra Peterossi, Lucia C Pfitscher, Joa˜o L Pinto e Silva, Silvana M Quintana, Ivelyne Radaci, Edilberto A Rocha Filho, Simone M Rodrigues, Roger D Rohloff, Marilza V Rudge, Gloria C Saint’ynes, Danielly S Santana, Patricia N Santos, Lale Say, Luiza E Schmaltz, Maria H Sousa, Maria R Sousa, Joa˜o P Souza, Fernanda G Surita, Elvira A Zanette, Vilma Zotareli.
Author Contributions
Conceived and designed the experiments: JPS JGC. Analyzed the data: JPS. Contributed reagents/materials/analysis tools: SMH LK. Wrote the paper: JPS. Performed the experiments (statistical modeling): JPS. Provided input to the discussion: MAP MLC LS. Read and approved the manuscript: MAP MLC LS.
References
1. World Health Organization, UNICEF, UNFPA and the World Bank. Trends in maternal mortality: 1990 to 2010. Geneva: World Health Organization, 2012
(World Health Organization website. Available: http://whqlibdoc.who.int/ publications/2012/9789241503631_eng.pdf. Accessed 2012 Aug 3).
Table 6.The Maternal Severity Index (MSI).
Constant and covariates Coefficients
Constant b 27.540
Maternal severity score
(x1) Number of life-threatening conditions* (n) (b1) 0.309
Associated conditions
(x2) Life-threatening conditions identified in the first 24 hours of hospital stay (b2) 0.287
(x3) Severe pre-eclampsia (b3) 20.579
(x4) Cancer (b4) 3.492
(x5) Any marker of cardiovascular failure# (b5) 4.209
(x6) Any marker of respiratory failure£ (b6) 1.513
(x7) Histerectomy (b7) 21.169
Determining the MSI
x1equals to the total number of life-threatening conditions present in the specific case and in the sequence x2to x7, x equals 1 if the condition is present or x equals 0 if the condition is absent; then:
Logit = b+(x1b1)+(x2b2)+(x3b3)+(x4b4)+(x5b5)+(x6b6)+(x7b7) MSI = eLogit/(1+eLogit)
*Listed in the Table 1.
#Presence of any of the following conditions: pH
,7.1, Use of continuous vasoactive drugs, Cardiac arrest, Cardio-pulmonary resuscitation (CPR). £Presence of any of the following conditions: Gasping, PaO2/FiO2
2. United Nations. Global Strategy for Women’s and Children’s Health. New York: United Nations, 2010 (World Health Organization website. Available: http://www.who.int/pmnch/topics/maternal/201009_globalstrategy_wch/en/ index.html. Accessed 2012 Aug 3).
3. Campbell OM, Graham WJ, Lancet Maternal Survival Series steering group (2006) Strategies for reducing maternal mortality: getting on with what works. Lancet 368(9543): 1284–1299.
4. Costello A, Azad K, Barnett S (2006) An alternative strategy to reduce maternal mortality. Lancet 368(9546): 1477–1479.
5. Maine D (2007) Detours and shortcuts on the road to maternal mortality reduction. Lancet 370(9595): 1380–1382.
6. Lewis G (2007) The Confidential Enquiry into Maternal and Child Health (CEMACH). Saving Mothers’ Lives: reviewing maternal deaths to make motherhood safer - 2003–2005. The Seventh Report on Confidential Enquiries into Maternal Deaths in the United Kingdom. London: CEMACH. (The Public Health Agency website. Available: http://www.publichealth.hscni.net/sites/ default/files/Saving%20Mothers %20Lives%202003–05%20.pdf. Accessed 2012 Aug 3).
7. Pattinson R (2009) Near miss audit in obstetrics. Best Pract Res Clin Obstet Gynaecol 23(3): 285–6.
8. Pattinson R, Say L, Souza JP, Broek N, Rooney C, et al. (2009) WHO maternal death and near-miss classifications. Bull World Health Organ 87(10): 734. 9. Say L, Souza JP, Pattinson RC, WHO working group on Maternal Mortality
and Morbidity classifications (2009) Maternal near miss–towards a standard tool for monitoring quality of maternal health care. Best Pract Res Clin Obstet Gynaecol 23(3): 287–96.
10. Say L, Pattinson RC, Gu¨lmezoglu AM (2004) WHO systematic review of maternal morbidity and mortality: the prevalence of severe acute maternal morbidity (near miss). Reprod Health 1(1): 3.
11. Strand K, Flaatten H (2008) Severity scoring in the ICU: a review. Acta Anaesthesiol Scand 52(4): 467–78.
12. Lapinsky SE, Hallett D, Collop N, Drover J, Lavercombe P, et al. (2011) Evaluation of standard and modified severity of illness scores in the obstetric patient. J Crit Care 26(5): 535.e1–7.
13. Oliveira Neto AF, Parpinelli MA, Cecatti JG, Souza JP, Sousa MH (2009) Factors associated with maternal death in women admitted to an intensive care unit with severe maternal morbidity. Int J Gynaecol Obstet 105(3): 252–256. 14. Souza JP, Cecatti JG, Faundes A, Morais SS, Villar J, et al. (2010) Maternal near
miss and maternal death in the World Health Organization’s 2005 global survey on maternal and perinatal health. Bull World Health Organ 88(2): 113–9. 15. Cecatti JG, Souza JP, Oliveira Neto AF, Parpinelli MA, Sousa MH, et al. (2011)
Pre-validation of the WHO organ dysfunction based criteria for identification of maternal near miss. Reprod Health 8(1): 22.
16. Knaus WA (2002) APACHE 1978–2001: the development of a quality assurance system based on prognosis: milestones and personal reflections. Arch Surg 137(1): 37–41.
17. Higgins TL (2007) Quantifying risk and benchmarking performance in the adult intensive care unit. J Intensive Care Med 22(3): 141–156.
18. Price LC, Slack A, Nelson-Piercy C (2008) Aims of obstetric critical care management. Best Pract Res Clin Obstet Gynaecol 22(5): 775–799. 19. Tempe A, Wadhwa L, Gupta S, Bansal S, Satyanarayana L (2007) Prediction of
mortality and morbidity by simplified acute physiology score II in obstetric intensive care unit admissions. Indian J Med Sci 61(4): 179–185.
20. 20. Muench MV, Baschat AA, Malinow AM, Mighty HE (2008) Analysis of disease in the obstetric intensive care unit at a university referral center: a 24-month review of prospective data. J Reprod Med 53(12): 914–920.
21. Togal T, Yucel N, Gedik E, Gulhas N, Toprak HI, et al. (2010) Obstetric admissions to the intensive care unit in a tertiary referral hospital. J Crit Care 25(4): 628–633.
22. Vasquez DN, Estenssoro E, Canales HS, Reina R, Saenz MG, et al. (2007) Clinical characteristics and outcomes of obstetric patients requiring ICU admission. Chest 131(3): 718–24.
23. Haddad SM, Cecatti JG, Parpinelli MA, Souza JP, Costa ML, et al. (2011) From planning to practice: building the national network for the Surveillance of Severe Maternal Morbidity. BMC Public Health 11: 283.
24. Cecatti JG, Souza JP, Parpinelli MA, Haddad SM, Camargo RS, et al. (2009) Brazilian network for the surveillance of maternal potentially life threatening morbidity and maternal near-miss and a multidimensional evaluation of their long term consequences. Reprod Health 6: 15.
25. Cecatti JG, Souza JP, Parpinelli MA, de Sousa MH, Amaral E (2007) Research on severe maternal morbidities and near-misses in Brazil: what we have learned. Reprod Health Matters 15(30): 125–133.
26. Shah A, Faundes A, Machoki M, Bataglia V, Amokrane F (2008) Methodo-logical considerations in implementing the WHO Global Survey for Monitoring Maternal and Perinatal Health. Bull World Health Organ 86(2): 126–31. 27. Bewick V, Cheek L, Ball J (2005) Statistics review 14: Logistic regression. Crit
Care 9(1): 112–118.
28. World Health Organization. Evaluating the quality of care for severe pregnancy complications: the WHO near-miss approach for maternal health. Geneva: World Health Organization, 2011 (World Health Organization website. Available: http://whqlibdoc.who.int/publications/2011/9789241502221_eng. pdf. Accessed 2012 Aug 3).
29. Haddad SM, Sousa MH, Cecatti JG, Parpinelli MA, Costa ML, et al. (2011) Intra-class correlation coefficients showed adequate heterogeneity for variables collected in the Brazilian Network for Surveillance of Severe Maternal Morbidity Study. Unpublished data (available under request).