Research Article
Applying the Maternal Near Miss Approach for
the Evaluation of Quality of Obstetric Care:
A Worked Example from a Multicenter Surveillance Study
Samira Maerrawi Haddad,
1Jose Guilherme Cecatti,
1,2Joao Paulo Souza,
1Maria Helena Sousa,
2Mary Angela Parpinelli,
1Maria Laura Costa,
1Rodolfo C. Pacagnella,
1Ione R. Brum,
3Olímpio B. Moraes Filho,
4Francisco E. Feitosa,
5Carlos A. Menezes,
6Everardo M. Guanabara,
7Joaquim L. Moreira,
8Frederico A. Peret,
9Luiza E. Schmaltz,
10Leila Katz,
11Antonio C. Barbosa Lima,
12Melania M. Amorim,
13Marilia G. Martins,
14Denis J. Nascimento,
15Cláudio S. Paiva,
16Roger D. Rohloff,
17Sergio M. Costa,
18Adriana G. Luz,
19Gustavo Lobato,
20Eduardo Cordioli,
21Jose C. Peraçoli,
22Nelson L. Maia Filho,
23Silvana M. Quintana,
24Fátima A. Lotufo,
25Carla B. Andreucci,
26Márcia M. Aquino,
27and Rosiane Mattar
281Department of Obstetrics and Gynaecology, School of Medical Sciences, University of Campinas (UNICAMP),
R. Alexander Fleming 101, P.O. Box 6030, 13083-881 Campinas, SP, Brazil
2Centre for Research on Reproductive Health of Campinas (Cemicamp), R. Vital Brasil 200,
13083-888 Campinas, SP, Brazil
3Federal University of Amazonas, Manaus, AM, Brazil 4CISAM, School of Medical Sciences, Recife, PE, Brazil 5Federal University of Cear´a, Fortaleza, CE, Brazil 6Federal University of Bahia, Salvador, BA, Brazil 7Hospital Geral Cesar Cals, Fortaleza, CE, Brazil 8Hospital Geral de Fortaleza, Fortaleza, CE, Brazil 9Maternidade Odete Valadares, Belo Horizonte, MG, Brazil 10Hospital Materno Infantil, Goiania, GO, Brazil
11IMIP, Recife, PE, Brazil
12Federal University of Pernambuco, Recife, PE, Brazil 13Federal University of Campina Grande, PB, Brazil 14Federal University of Maranh˜ao, S˜ao Luis, MA, Brazil 15Federal University of Paran´a, Curitiba, PR, Brazil 16Federal University of Para´ıba, Jo˜ao Pessoa, PB, Brazil
17Hospital Maternidade Fernando Magalh˜aes, Rio de Janeiro, RJ, Brazil 18Federal University of Rio Grande do Sul, Porto Alegre, RS, Brazil 19Hospital Maternidade Celso Pierro, Campinas, SP, Brazil 20Instituto Fernandes Figueira, Rio de Janeiro, RJ, Brazil 21Hospital Israelita Albert Einstein, Sao Paulo, SP, Brazil 22University of the State of S˜ao Paulo, Botucatu, SP, Brazil 23Jundia´ı School of Medicine, Jundia´ı, SP, Brazil
24University of S˜ao Paulo, Ribeir˜ao Preto, SP, Brazil 25Santa Casa de Limeira, Limeira, SP, Brazil 26Santa Casa de S˜ao Carlos, SP, Brazil
27Maternidade Leonor Mendes de Barros, Sao Paulo, SP, Brazil 28Federal University of S˜ao Paulo, SP, Brazil
Correspondence should be addressed to Jose Guilherme Cecatti; [email protected]
Received 27 April 2014; Revised 17 June 2014; Accepted 17 June 2014; Published 24 July 2014
Academic Editor: Sohinee Bhattacharya
Copyright © 2014 Samira Maerrawi Haddad et al. his is an open access article distributed under the Creative Commons Attribution License, which permits unrestricted use, distribution, and reproduction in any medium, provided the original work is properly cited.
Objective. To assess quality of care of women with severe maternal morbidity and to identify associated factors.Method. his is a national multicenter cross-sectional study performing surveillance for severe maternal morbidity, using the World Health Organization criteria. he expected number of maternal deaths was calculated with the maternal severity index (MSI) based on the severity of complication, and the standardized mortality ratio (SMR) for each center was estimated. Analyses on the adequacy of care were performed.Results. 17 hospitals were classiied as providing adequate and 10 as nonadequate care. Besides almost twofold increase in maternal mortality ratio, the main factors associated with nonadequate performance were geographic diiculty in accessing health services (� < 0.001), delays related to quality of medical care (� = 0.012), absence of blood derivatives (� = 0.013), diiculties of communication between health services (� = 0.004), and any delay during the whole process (� = 0.039). Conclusions. his is an example of how evaluation of the performance of health services is possible, using a benchmarking tool speciic to Obstetrics. In this study the MSI was a useful tool for identifying diferences in maternal mortality ratios and factors associated with nonadequate performance of care.
1. Introduction
he outcome of a critically ill patient is a result of clinical and individual factors, including previous health status, physiologic reserve, disease diagnosis, and also adequacy of care provided during the disease. hus, it is diicult to individually analyze and predict morbidity and
mortal-ity outcomes in critically ill patients [1]. Stratiication of
patient groups according to clinical severity may facilitate interpretation of these results by comparing similar groups
[2].
Some scoring systems are capable of quantifying severity, for example, the APACHE (Acute Physiology and Chronic Health Evaluation), SAPS (Simpliied Acute Physiology Score), SOFA (Sequential Organ Failure Assessment), and
MPM (Mortality Prediction Model) [1]. However, they were
developed using general populations of critically ill patients in high income countries. Considering severe pregnancy complications, several factors seem to reduce the capacity to classify severity and predict mortality among pregnant women with these models.
he diferent physiologic parameters, diseases unique to pregnancy, and a population largely composed of young women who were previously healthy contribute to the little
applicability of these tools in Obstetrics [3]. As a result,
traditional risk stratiication models usually overestimate mortality among pregnant women, which may hinder anal-ysis of the performance of care provided and interpretation
of morbidity and mortality outcomes [3].
“Benchmarking” may be understood as a reference point against which comparisons can be made, regarding the performance between facilities and/or best practice. he demand for this type of data is growing, not only due to initiatives to pay for performance but also because of clin-ical, administrative, and research applications. Performance feedback at an institutional or individual level may lead to an
improvement in overall performance [2].
Several initiatives for maternal and infant health have been implemented worldwide, aimed at achieving the
mil-lennium development goals (MDG) [4–8]. Nevertheless,
advances made over the years are below those required for efective morbidity and mortality reduction. Structured health systems are identiied as fundamental to obtain better
results and accelerate progress for achieving these goals [9,
10].
he World Health Organization (WHO) used organ dys-function criteria and parameters of extreme severity speciic to Obstetrics to deine life-threatening conditions associated with pregnancy, standardizing the maternal near miss criteria
[8]. A maternal near miss is an event in which a woman nearly
died, but survived a severe complication occurring during pregnancy, childbirth, or within 42 days of its termination. It represents the extreme degree of organ dysfunction/failure in the wide spectrum of morbidity and difers from death only
by the inal outcome [8].
Until this deinition, several studies used diferent param-eters for severe morbidity, such as admission to intensive
care units (ICU) or clinical diagnoses [11–14]. he irst
retrospective validation of these criteria was performed in a population of obstetric patients admitted to ICU, using the total maximum SOFA score as the gold standard and showing that the WHO near miss criteria obtained a sensitivity and speciicity of 99.2 and 86.0%, respectively, for the
identiica-tion of organ failure in at least one organ system [15].
he Brazilian Network for Surveillance of Severe Mater-nal Morbidity was a prospective study aimed at identifying potentially life-threatening and maternal near miss cases
[16, 17]. Assuming that a woman sufering from a near
miss event is exactly like one who has died, except for the outcome, criteria would be validated if all maternal deaths were identiied and if the false-positive cases represented exactly the near miss cases. he performance of the WHO near miss criteria was conirmed, with a sensitivity and
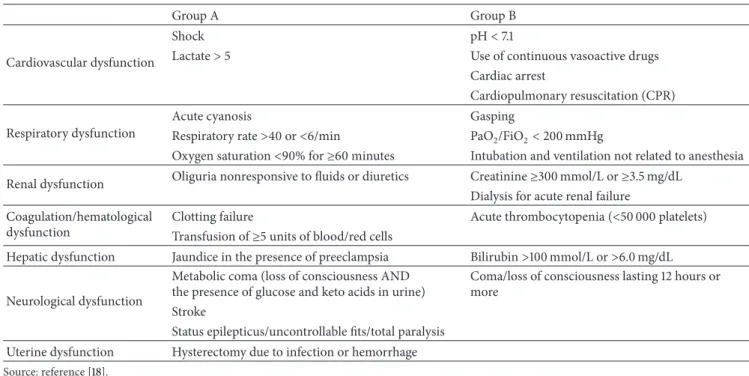
Table 1: he WHO set of severity markers (life-threatening conditions) used in maternal near miss assessments.
Group A Group B
Cardiovascular dysfunction
Shock pH<7.1
Lactate>5 Use of continuous vasoactive drugs
Cardiac arrest
Cardiopulmonary resuscitation (CPR)
Respiratory dysfunction
Acute cyanosis Gasping
Respiratory rate>40 or<6/min PaO2/FiO2<200 mmHg
Oxygen saturation<90% for≥60 minutes Intubation and ventilation not related to anesthesia
Renal dysfunction Oliguria nonresponsive to luids or diuretics Creatinine≥300 mmol/L or≥3.5 mg/dL Dialysis for acute renal failure
Coagulation/hematological dysfunction
Clotting failure Acute thrombocytopenia (<50 000 platelets) Transfusion of≥5 units of blood/red cells
Hepatic dysfunction Jaundice in the presence of preeclampsia Bilirubin>100 mmol/L or>6.0 mg/dL
Neurological dysfunction
Metabolic coma (loss of consciousness AND the presence of glucose and keto acids in urine)
Coma/loss of consciousness lasting 12 hours or more
Stroke
Status epilepticus/uncontrollable its/total paralysis Uterine dysfunction Hysterectomy due to infection or hemorrhage
Source: reference [18].
tool called maternal severity index (MSI) was also developed speciically to predict mortality for the obstetric population. his appears to be a irst step in making a case-mix analysis and a comparison between obstetric services by matching
similar populations [18].
Strategies aimed at strengthening health systems are nec-essary. However, many systems still do not have the capacity to measure and understand their own weaknesses, making it diicult for healthcare policy managers to incorporate
scientiic strategies towards strengthening systems [10]. he
maternal near miss approach may be a tool for assessment of quality of maternal care provided. As a result, standardization and comparison can be made between maternal morbidity groups from diferent locations and over time, identifying
weaknesses [7]. hus, the aim of this study was to simulate
the evaluation of an obstetric health system, through analysis of the performance of care in the Brazilian Network for the Surveillance of Severe Maternal Morbidity, using the maternal near miss criteria approach.
2. Materials and Methods
2.1. Ethics Statement. Research protocol was approved by the Institutional Review Board of the coordinating institution (University of Campinas) on 5 May 2009 (Document CEP 027/2009). he study was approved by the local Institutional Review Board of each participating center and also nationally. Each center was previously consulted regarding this analysis of performance and data publication. Approval was unani-mous. To ensure conidentiality, each center is not identiied and received conidential information on the category it was classiied in order to be able to adopt procedures to improve quality of care provided.
2.2. Study Population. he Brazilian Network for Surveil-lance of Severe Maternal Morbidity was a cross-sectional multicenter study aimed at identifying severe maternal
mor-bidity cases, using the new WHO deinition [8, 16]. From
July 2009 to June 2010, 27 referral hospitals, representing a purposeful sample of the Brazilian health facilities caring for women’s deliveries, made a prospective surveillance to identify severe maternal morbidity/near miss cases.
he study was planned in detail, with preparatory meet-ings to discuss methods and procedures with participants from all centers. In addition to personal and clinical infor-mation of each case of severe maternal morbidity identi-ied, a rigorous system of screening for any of the three
delays in obstetrical care was also implemented [19]. Ater
prospective data collection was completed, a rigorous check-ing system for data consistency was developed. Additional details on method and procedures are in other publications
[16,17].
2.3. Development of a Model for Mortality Prediction. Pre-viously, it was possible to build a model for mortality
prediction, named maternal severity index (MSI) [18]. Briely,
two models for mortality prediction were developed. First, it was conirmed that the number of near miss markers could be related to mortality and this correlation was called maternal severity score (MSS). he WHO near miss
mark-ers are shown in Table 1, distributed as Group A (organ
Instruction:
Enter the mean MSI (%): Enter the observed number of deaths: Enter the population size:
Expected number of deaths: 0
SMR
High Moderate
Low Very low
Low
One Two hree or more Parameters used in the assessment
Grades of performance Very high
High
Precision
Performance assessment
Performance grade: N.A.
Precision of the assessment: N.A. SMR: N.A.
SMR calculator
Intermediate
Enter the required information in the green boxes.
Number of performance grades included in the range
of SMR 95% CI <0.50
>2.00
0.50–0.80
0.81–1.24
1.25–2.00
Figure 1: SMR calculator.
population “B” was obtained considering a probability of 0.05 for type I error, 0.20 for type II error, and a minimum area under the ROC (receiver operating characteristic) curve of 0.80.
he irst model was a univariate analysis including only MSS or the number of severity markers. he second used univariate analyses considering MSS, distal predictors of mortality (such as demographic and obstetric characteris-tics), and near miss criteria as independent variables and the outcome maternal death as the dependent variable. Variables signiicantly correlated with mortality were selected for multivariate analysis. Positive or negative correlation
coeicients (�) were attributed to each variable included
in the model. Calibration and discrimination of models were performed. Model 2 showed the best performance for mortality prediction. herefore, it was chosen to be
the maternal severity index (MSI) [18]. Briely, the SMI is
estimated through an equation which takes into account the MSS (number of life-threatening conditions) and the pres-ence of some associated speciic conditions (life-threatening condition identiied in the irst 24 hours of hospital stay, severe preeclampsia, cancer, any marker of cardiovascular failure, any marker of respiratory failure, and hysterectomy), which are the variables signiicantly correlated with mortality mentioned above. With the SMI thus estimated for each case and the mean SMI for any speciied group, the number of expected deaths can be determined. When the number of observed deaths is compared with the number of expected deaths, the concept of standardized mortality ratio (SMR) is used. To simplify the estimation of SMR, a calculator was
developed (Figure 1).
2.4. Analysis of Performance of Network Centers. he mean MSI for each center was obtained and the standardized
mor-tality ratio (SMR) was calculated for each one (Figure 1). SMR
is the ratio between observed mortality in the population and expected mortality by mortality prediction based on severity of the case expressed by MSI. To allow calculation of SMR for all centers, a value of 0.1 was attributed, when no death was observed or there was no expected death due to the small sample size and/or low complexity of cases in that center.
In the original model, the categorization of performance was based on cutof points selected assuming the normal distribution into ive classes of care and the understanding
that SMR < 0.5; that is, the occurrence of half or less than
the expected number of deaths could correspond to excellent care. hus, the ive categories of performance were deined as
very high, high, intermediate, very low, and low [18].
In this analysis, SMR was calculated from the mean MSI for each of the 27 study centers. Due to the relatively small number of centers and to make analyses more consistent as an exercise to evaluate large systems, the original classiica-tion was modiied, and groups were relocated to two new categories. Categories “very high,” “high,” and “intermediate,”
including SMR < 0.5to 1.24, were reclassiied as “adequate”
care. Categories “low” and “very low,” with SMR of 1.25 to
>2, were recoded as “nonadequate.” hus, this performance
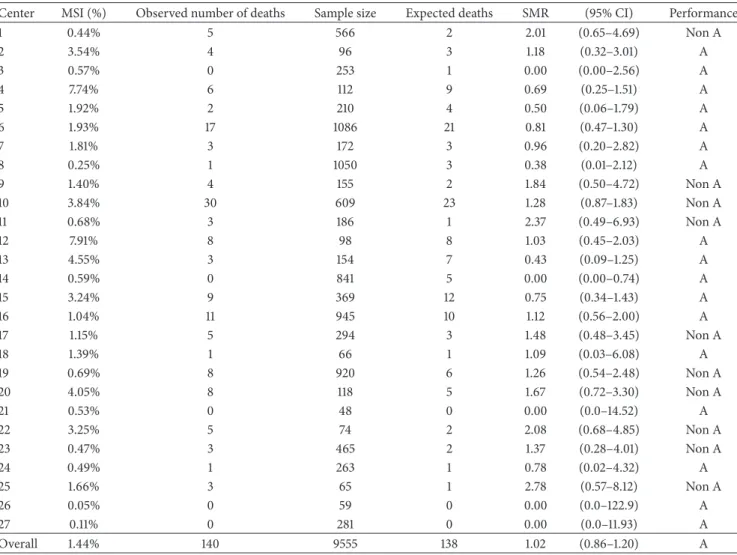
Table 2: Analyses of MSI, SMR, and level of performance for each center of the Brazilian Network for Surveillance of Severe Maternal Morbidity.
Center MSI (%) Observed number of deaths Sample size Expected deaths SMR (95% CI) Performance
1 0.44% 5 566 2 2.01 (0.65–4.69) Non A
2 3.54% 4 96 3 1.18 (0.32–3.01) A
3 0.57% 0 253 1 0.00 (0.00–2.56) A
4 7.74% 6 112 9 0.69 (0.25–1.51) A
5 1.92% 2 210 4 0.50 (0.06–1.79) A
6 1.93% 17 1086 21 0.81 (0.47–1.30) A
7 1.81% 3 172 3 0.96 (0.20–2.82) A
8 0.25% 1 1050 3 0.38 (0.01–2.12) A
9 1.40% 4 155 2 1.84 (0.50–4.72) Non A
10 3.84% 30 609 23 1.28 (0.87–1.83) Non A
11 0.68% 3 186 1 2.37 (0.49–6.93) Non A
12 7.91% 8 98 8 1.03 (0.45–2.03) A
13 4.55% 3 154 7 0.43 (0.09–1.25) A
14 0.59% 0 841 5 0.00 (0.00–0.74) A
15 3.24% 9 369 12 0.75 (0.34–1.43) A
16 1.04% 11 945 10 1.12 (0.56–2.00) A
17 1.15% 5 294 3 1.48 (0.48–3.45) Non A
18 1.39% 1 66 1 1.09 (0.03–6.08) A
19 0.69% 8 920 6 1.26 (0.54–2.48) Non A
20 4.05% 8 118 5 1.67 (0.72–3.30) Non A
21 0.53% 0 48 0 0.00 (0.0–14.52) A
22 3.25% 5 74 2 2.08 (0.68–4.85) Non A
23 0.47% 3 465 2 1.37 (0.28–4.01) Non A
24 0.49% 1 263 1 0.78 (0.02–4.32) A
25 1.66% 3 65 1 2.78 (0.57–8.12) Non A
26 0.05% 0 59 0 0.00 (0.0–122.9) A
27 0.11% 0 281 0 0.00 (0.0–11.93) A
Overall 1.44% 140 9555 138 1.02 (0.86–1.20) A
A: adequate; Non A: nonadequate; MSI: maternal severity index; SMR: standardized mortality ratio.
women received. his includes not only the hospital activi-ties/responsibilities but also those from the woman herself, her family, community, and access to health services.
Furthermore, patient outcomes, their respective indi-cators, and main causes of complication were evaluated for both groups of level of performance. Finally, Poisson multiple regression analysis was performed, using the level of performance as a dependent variable, estimating the prevalence ratio and its respective 95% CI to identify variables independently associated with performance. A 5% statistical signiicance level was used. All measures of efect in the study
design and their respective � values were calculated ater
adjusting for cluster efect.
3. Results
In this period, when these facilities took care of 82,388 deliveries with 82,144 live births (representing a fraction of around 2.8% of all annual live births in the country), 9555 women had severe pregnancy complications, with 770
near miss cases and 140 maternal deaths. In Table 2, the
mean MSI, number of observed deaths, sample size (poten-tially life-threatening and near miss conditions), expected number of deaths, SMR, and, inally, the recategorized level of performance of care are presented for each of the 27 centers, 17 being classiied as having “adequate” and 10 as “nonadequate” performance. Generally, the overall perfor-mance of Network was adequate, since there were only two more maternal deaths than expected due to severity of cases
(SMR= 1.02).
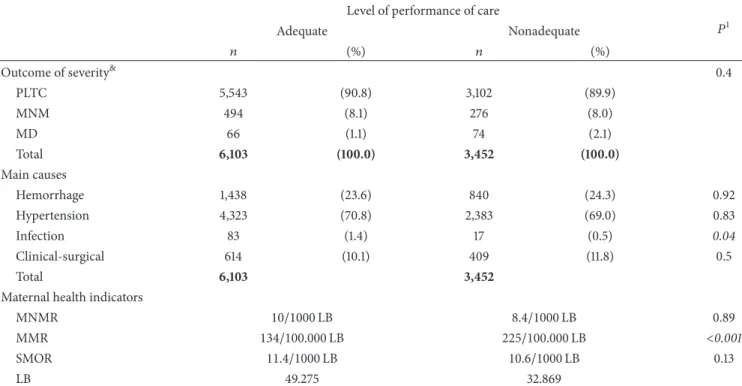
Table 3 shows the distribution of outcomes of severity and of main causes of morbidity, according to the level of performance of the centers. Although diferences were not signiicant, there was proportionally almost twice the propor-tion of deaths among centers classiied as “nonadequate” care. Maternal health indicators also show that the occurrence of maternal near miss was similar between performance groups, but there was an almost twofold increase in the maternal mortality ratio (MMR) in the group with nonadequate care.
Structure indicators according to level of performance
Table 3: Distribution of cases of severe maternal morbidity according to the group of severity, main causes of morbidity, and level of performance of care.
Level of performance of care
�1
Adequate Nonadequate
� (%) � (%)
Outcome of severity&
0.4
PLTC 5,543 (90.8) 3,102 (89.9)
MNM 494 (8.1) 276 (8.0)
MD 66 (1.1) 74 (2.1)
Total 6,103 (100.0) 3,452 (100.0)
Main causes
Hemorrhage 1,438 (23.6) 840 (24.3) 0.92
Hypertension 4,323 (70.8) 2,383 (69.0) 0.83
Infection 83 (1.4) 17 (0.5) 0.04
Clinical-surgical 614 (10.1) 409 (11.8) 0.5
Total 6,103 3,452
Maternal health indicators
MNMR 10/1000LB 8.4/1000LB 0.89
MMR 134/100.000LB 225/100.000LB <0.001
SMOR 11.4/1000LB 10.6/1000LB 0.13
LB 49.275 32.869
LB: live births; MD: maternal death; MMR: maternal mortality ratio; MNM: maternal near miss; PLTC: potentially life-threatening condition; SMOR: severe maternal outcome ratio.
&Comparisons: PLTC×(NM + MD):� = 0.721; (PLTC + NM)×MD:� = 0.123.
1�value adjusted for cluster efect.
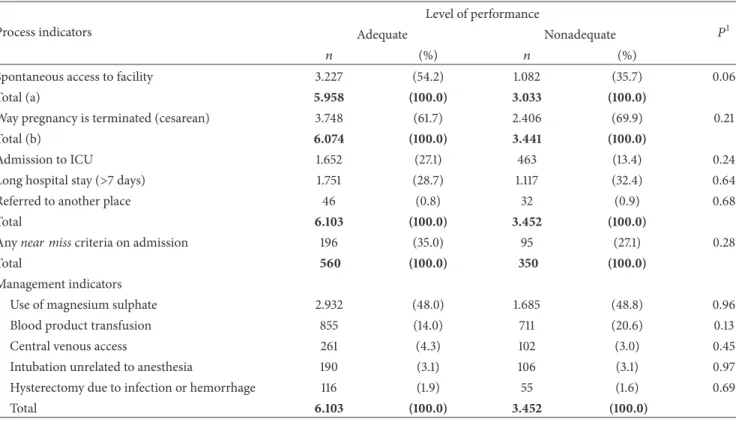
were located with an almost 2.5 higher prevalence in the southeast and south of the country, but this diference was not signiicant. When process and management indicators (Table 5) were analyzed, there was twofold increase in ICU admissions in adequate care centers, but this diference was also not signiicant.
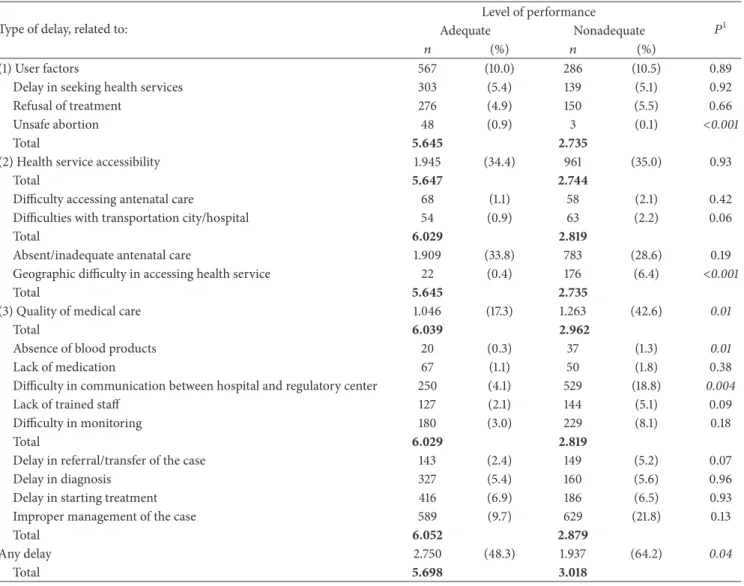
Association between delay in care and the level of
per-formance is shown inTable 6. Generally, both detection of
any type of delay and some speciic categories of delays, particularly those concerning the third delay (related to quality of care), were signiicantly more common in the nonadequate performance group. Considering all the pre-dictive variables included in the multiple regression analysis (Table 7), the use of magnesium sulfate and location of the health center in the south or southeast were the main vari-ables independently associated with adequate performance of care.
4. Discussion
With the use of the MSI and SMR, it was possible to assess the performance of centers from the Brazilian Network for Surveillance of Severe Maternal Morbidity. his was a irst initiative to use the near miss concept as a tool for assessment of case-mix and adequacy of care received in Obstetrics. However, as already stated, this assessment of the quality of obstetrical care is probably more appropriate for a speciic population that “receives” the care than for a speciic health
facility that “provides” the care. his is because the global assessment does not imply only the activities performed at the hospital but also the characteristics of women and their community services and access to health services. If a woman arrives late at the hospital in a very severe almost dying condition, she is more likely to die even if the hospital is tertiary, well equipped, and with a good trained staf. he responsibility for such a death cannot be attributed solely to this hospital. In other words, the care provided by the hospital can be adequate while the care received by the woman can be not adequate.
In the classiication of performance, sample size per center corresponds to the number of cases with potentially life-threatening conditions and threatening life conditions (near miss and maternal death) and not the total number of live births, because only women presenting with some severity indicators were included in the study. Although cal-culation of SMR for all centers was possible ater attributing a value of 0.1 to those that did not present any observed or expected death, these estimates had low accuracy. herefore, the MSI seems limited and less precise for use in populations with a small number of cases, with lower clinical severity (low MSI) and those with no observed death. he lower accuracy of estimates in these cases should increase attention and care for interpreting the performance of these health services.
Table 4: Distribution of study centers according to structure indicators and level of performance of care.
Structure indicator@ Level of performance �1 Adequate Nonadequate
Type of ICU ∗
Obstetric 5 (29) 2 (20) 0.68#
Only general ICU 9 (53) 5 (50) >1#
None 3 (18) 3 (30) 0.64#
Level of complexity >1#
Secondary 3 (18) 2 (20)
Tertiary 14 (82) 8 (80)
Geographic region 0.06#
North, Northeast,
and Center-West 5 (29) 7 (70)
Southeast and South 12 (71) 3 (30)
Level of government ∗
Municipal 2 (12) 2 (20) 0.61#
State 5 (29) 4 (40) 0.68#
Federal 7 (41) 3 (30) 0.69#
Nonpublic 3 (18) 1 (10) >1#
Total 17 (100) 10 (100)
@he following indicators were not taken into account: teaching hospital;
blood bank; neonatal ICU and round the clock anesthetic available, due to the fact that almost all centers had these indicators.
∗Chi-square test not applicable for general comparison.
#Fisher Exact Test.
1�value adjusted for cluster efect.
study, the total number of annual deliveries, and geo-graphic location. hus, the estimated sample size could be achieved, ensuring a broad distribution in national territory. Nevertheless, most of these hospitals were linked to large university institutions or had teaching activities, and this implies that they are mostly referral for healthcare of severe pregnancy complications, with evidence-based protocols and similar standards of care. he relative homogeneity of these facilities may have contributed to the lack of signiicant diferences between levels of performance of care and most variables related to the proile of severity of illness, cause of morbidity, and structure and management indicators, in addition to the limited number of centers participating in the study.
he greater proportion of infectious causes among centers with adequate performance may be perceived as better adequacy to international protocols for the management of
sepsis [20], already widely known among academic medical
services. Referral of these cases to hospitals equipped with a high complexity arsenal is a determining factor for the survival of these patients.
As observed, there was an almost twofold increase in proportion of deaths in centers with nonadequate perfor-mance. However, the prevalence of maternal near miss was
practically the same in both groups of performance. his is in agreement with recent knowledge that severe pregnancy complications occur practically in the same frequency in all countries and regions, regardless of the level of development and availability of resources. In fact, the varying factor is mortality, which is always higher in contexts of lower development and scarce resources, as currently demonstrated
[21,22].
In this study, information on potential delays in obtain-ing care among women suferobtain-ing severe complications was collected. In addition to objective information from medical charts, local researchers made a subjective assessment and searched for the three types of delay in obtaining care
[19]. he presence of any delay in care was signiicantly
related to a worse performance of service. hese results are in agreement with the concept that the main preven-tive factors in decreasing maternal mortality are delays in the care process, from symptom identiication by the patient to the provision of adequate treatment by healthcare
professionals [19]. Globally there was a greater delay in
providing services in nonadequate care centers, mainly due to the absence of blood products and diiculty in estab-lishing communication between services and/or regulatory centers.
hese indings seem to follow a presumptive logic. Sub-jects living in geographic regions with diicult access have the greatest diiculty in seeking medical care, including antenatal followup. Healthcare facilities close to these homes are also probably on the outskirts of large cities and high-complexity hospitals are usually in the center of these cities. In general, this peripheral healthcare equipment does not have an adequate structure to provide immediate care and monitor complications. here is also diiculty in regulating complex cases to large referral centers. Finally, successive delays in providing care are related to a higher number of severe outcomes and deaths.
his hypothesis may corroborate information that health system strengthening may actually have the greatest impact
on improvement of clinical care [10]. For instance, prompt
action of the whole health system for hierarchization of care, according to demand of severity, could ensure a reduction in deaths by improving adequacy of care. hese strategies would go beyond the sole responsibility of the healthcare managers. Most probably, social development actions, civil, and transport infrastructure are necessary to correct deter-mining factors for the health of these more vulnerable populations.
he MSI for mortality prediction follows the same indica-tions and limitaindica-tions of similar models, such as the APACHE and MPM. Use for individual evaluation is limited, since the greatest outcome predictor is individual response to therapy
administered [2]. In addition, waiting to provide speciic
measures only when certain markers of severity emerge is not recommended. Individual clinical care is dynamic and the use of severity scores for decision making may delay healthcare, with poor provision of adequate resources. Most existing scores consider the clinical parameters obtained in the irst 24 hours ater ICU admission and do not assess time,
Table 5: Distribution of cases of severe maternal morbidity according to process and management indicators and level of performance of care.
Process indicators
Level of performance
�1
Adequate Nonadequate
� (%) � (%)
Spontaneous access to facility 3.227 (54.2) 1.082 (35.7) 0.06
Total (a) 5.958 (100.0) 3.033 (100.0)
Way pregnancy is terminated (cesarean) 3.748 (61.7) 2.406 (69.9) 0.21
Total (b) 6.074 (100.0) 3.441 (100.0)
Admission to ICU 1.652 (27.1) 463 (13.4) 0.24
Long hospital stay (>7 days) 1.751 (28.7) 1.117 (32.4) 0.64
Referred to another place 46 (0.8) 32 (0.9) 0.68
Total 6.103 (100.0) 3.452 (100.0)
Anynear misscriteria on admission 196 (35.0) 95 (27.1) 0.28
Total 560 (100.0) 350 (100.0)
Management indicators
Use of magnesium sulphate 2.932 (48.0) 1.685 (48.8) 0.96
Blood product transfusion 855 (14.0) 711 (20.6) 0.13
Central venous access 261 (4.3) 102 (3.0) 0.45
Intubation unrelated to anesthesia 190 (3.1) 106 (3.1) 0.97
Hysterectomy due to infection or hemorrhage 116 (1.9) 55 (1.6) 0.69
Total 6.103 (100.0) 3.452 (100.0)
Missing information for: (a) 564 cases; (b) 40 cases.
1�value adjusted for cluster efect.
using data from the prehospital phase until discharge, using several sources distributed all over the country, which may increase the accuracy of its prediction capacity. However, if the development of the model and the use in the same population could be a limitation of the method, tests in other samples are needed for external validation and in fact it was already performed in a huge sample from the WHO study
[22].
he SMR may be perceived as the evaluation of perfor-mance of a system rather than of a health service alone. In this study, SMR was recategorized as “adequate” and “nonadequate,” the cutof point being the limit between
intermediate and low care from the original classiication [18].
hus a group of centers that actually had SMR above 1 was classiied as providing “adequate” care. Centers that could not prevent any expected death and in some cases had a slight increase in the number of deaths in relation to the expected due to severity of their cases were categorized as having adequate performance. Although this methodological option may have reduced the identiication of variables related to actual excellent care (SMR between 0 and 0.8), it was a strategy adopted as a form of simplifying data analysis and prioritizing identiication of centers with nonadequate per-formance. In the future, with a larger number of participating hospitals and subjects, it is likely that analysis with three categories (e.g., high, intermediate, and low performance) may be a valuable strategy for evaluating all the components of performance individually.
5. Conclusions
In the Brazilian Network for Surveillance of Severe Maternal Morbidity, the near miss approach was used to simulate anal-ysis of an obstetric health system. Ater applying the MSI and SMR, analysis of the performance of services received was possible and its associated factors were assessed. Problems arising from the health system organization were identiied as signiicant, especially those related to accessibility to health services and quality of medical care provided.
he use of this speciic tool for mortality prediction may contribute to the analysis of obstetric health systems and identiication of weaknesses. Furthermore, it may help to strengthen these systems, with an efective reduction in deaths. Nevertheless, new studies in diferent populations should be conducted for external calibration of tools devel-oped in the Brazilian Network.
Ethical Approval
Research protocol was approved by the Institutional Review Board of the coordinating institution on 5 May 2009 (Docu-ment CEP 027/2009).
Conflict of Interests
Table 6: Distribution of cases of severe maternal morbidity according to occurrence of delays in obtaining obstetric care and level of performance of care.
Type of delay, related to:
Level of performance
�1
Adequate Nonadequate
� (%) � (%)
(1) User factors 567 (10.0) 286 (10.5) 0.89
Delay in seeking health services 303 (5.4) 139 (5.1) 0.92
Refusal of treatment 276 (4.9) 150 (5.5) 0.66
Unsafe abortion 48 (0.9) 3 (0.1) <0.001
Total 5.645 2.735
(2) Health service accessibility 1.945 (34.4) 961 (35.0) 0.93
Total 5.647 2.744
Diiculty accessing antenatal care 68 (1.1) 58 (2.1) 0.42
Diiculties with transportation city/hospital 54 (0.9) 63 (2.2) 0.06
Total 6.029 2.819
Absent/inadequate antenatal care 1.909 (33.8) 783 (28.6) 0.19
Geographic diiculty in accessing health service 22 (0.4) 176 (6.4) <0.001
Total 5.645 2.735
(3) Quality of medical care 1.046 (17.3) 1.263 (42.6) 0.01
Total 6.039 2.962
Absence of blood products 20 (0.3) 37 (1.3) 0.01
Lack of medication 67 (1.1) 50 (1.8) 0.38
Diiculty in communication between hospital and regulatory center 250 (4.1) 529 (18.8) 0.004
Lack of trained staf 127 (2.1) 144 (5.1) 0.09
Diiculty in monitoring 180 (3.0) 229 (8.1) 0.18
Total 6.029 2.819
Delay in referral/transfer of the case 143 (2.4) 149 (5.2) 0.07
Delay in diagnosis 327 (5.4) 160 (5.6) 0.96
Delay in starting treatment 416 (6.9) 186 (6.5) 0.93
Improper management of the case 589 (9.7) 629 (21.8) 0.13
Total 6.052 2.879
Any delay 2.750 (48.3) 1.937 (64.2) 0.04
Total 5.698 3.018
1�value adjusted for cluster efect.
Table 7: Variables independently associated with adequate perfor-mance (Poisson multiple analysis1 � = 9555).
Variable PR 95% CI PR �1
Use of magnesium sulfate 1.44 1.04–1.98 0.03 Geographic region (SE, S) 2.21 1.05–4.65 0.04
1�value adjusted for cluster efect; PR: prevalence ratio; SE: Southeast; S:
South.
Author’s Contribution
he idea for the study arose in a group discussion among all the authors. Ater the end of data collection, Samira Maerrawi Haddad, Jose Guilherme Cecatti, Joao Paulo Souza, Mary Angela Parpinelli, and Maria Laura Costa prepared a detailed plan of analysis which was then performed by Maria Helena Sousa. he irst version of the paper was drated by Samira Maerrawi Haddad under supervision of Jose Guilherme Cecatti and then complemented with suggestions made by
the other authors. All authors contributed to the development of the study protocol and approved the inal version of the paper.
Acknowledgments
George N. Chaves, Ione R. Brum, Gloria C. Saint’Ynes, Carlos A. Menezes, Patricia N. Santos, Everardo M. Guanabara, Elson J. Almeida Jr, Joaquim L. Moreira, Maria R. Sousa, Frederico A. Peret, Liv B. Paula, Luiza E. Schmaltz, Cleire Pessoni, Leila Katz, Adriana Bione, Antonio C. Barbosa Lima, Edilberto A. Rocha Filho, Melania M. Amorim, Debora Leite, Ivelyne Radaci, Marilia G. Martins, Frederico Barroso, Fernando C. Oliveira Jr, Denis J. Nascimento, Cl´audio S. Paiva, Moises D. Lima, Djacyr M. Freire, Roger D. Rohlof, Simone M. Rodrigues, Sergio M. Costa, Lucia C. Pitscher, Adriana G. Luz, Daniela Guimaraes, Gustavo Lobato, Marcos Nakamura-Pereira, Eduardo Cordioli, Alessandra Peterossi, Cynthia D. Perez, Jose C. Perac¸oli, Roberto A. Costa, Nelson L. Maia Filho, Jacinta P. Matias, Silvana M. Quintana, Elaine C. Moises, F´atima A. Lotufo, Luiz E. Carvalho, Carla B. Andreucci, M´arcia M. Aquino, Maria H. Ohnuma, Rosiane Mattar, and Felipe F. Campanharo.
References
[1] K. Strand and H. Flaatten, “Severity scoring in the ICU: a review,”Acta Anaesthesiologica Scandinavica, vol. 52, no. 4, pp. 467–478, 2008.
[2] T. L. Higgins, “Quantifying risk and benchmarking perfor-mance in the adult intensive care unit,”Journal of Intensive Care Medicine, vol. 22, no. 3, pp. 141–156, 2007.
[3] S. E. Lapinsky, D. Hallett, N. Collop et al., “Evaluation of stan-dard and modiied severity of illness scores in the obstetric patient,”Journal of Critical Care, vol. 26, no. 5, pp. 535.e1–535.e7, 2011.
[4] J. Raven, J. Hofman, A. Adegoke, and N. van den Broek, “Methodology and tools for quality improvement in maternal and newborn health care,”International Journal of Gynecology & Obstetrics, vol. 114, no. 1, pp. 4–9, 2011.
[5] L. Cochet, R. C. Pattinson, and A. P. Macdonald, “Severe acute maternal morbidity and maternal death audit: a rapid diagnos-tic tool for evaluating maternal care,”South African Medical Journal, vol. 93, no. 9, pp. 700–702, 2003.
[6] L. Say, R. C. Pattinson, and A. M. G¨ulmezoglu, “WHO system-atic review of maternal morbidity and mortality: the prevalence of severe acute maternal morbidity (near miss),”Reproductive Health, vol. 1, article 3, 2004.
[7] WHO,Evaluating the Quality of Care for Severe Pregnancy Com-plications, he WHO Near-Miss Approach for Maternal Health, WHO, Geneva, Switzerland, 2011, http://whqlibdoc.who.int/
publications/2011/9789241502221 eng.pdf.
[8] L. Say, J. P. Souza, and R. C. Pattinson, “Maternal near miss— towards a standard tool for monitoring quality of maternal health care,”Best Practice and Research: Clinical Obstetrics and Gynaecology, vol. 23, no. 3, pp. 287–296, 2009.
[9] WHO,Trends in Maternal Mortality: 1990–2008, World Health Organization, Geneva, Switzerland, 2010, http://whqlibdoc
.who.int/publications/2010/9789241500265 eng.pdf.
[10] WHO, Systems hinking for Health Systems Strengthening, WHO, Geneva, Switzerland, 2009, http://whqlibdoc.who.int/
publications/2009/9789241563895 eng.pdf.
[11] S. Donati, S. Senatore, and A. Ronconi, “Obstetric near-miss cases among women admitted to intensive care units in Italy,” Acta Obstetricia et Gynecologica Scandinavica, vol. 91, no. 4, pp. 452–457, 2012.
[12] J. M. Mhyre, B. T. Bateman, and L. R. Lefert, “Inluence of patient comorbidities on the risk of near-miss maternal morbidity or mortality,”Anesthesiology, vol. 115, no. 5, pp. 963– 972, 2011.
[13] G. D. Mantel, E. Buchmann, H. Rees, and R. C. Pattinson, “Severe acute maternal morbidity: a pilot study of a deinition for a near-miss,”British Journal of Obstetrics and Gynaecology, vol. 105, no. 9, pp. 985–990, 1998.
[14] M. Waterstone, C. Wolfe, and S. Bewley, “Incidence and pre-dictors of severe obstetric morbidity: case-control study,”British Medical Journal, vol. 322, no. 7294, pp. 1089–1093, 2001. [15] J. G. Cecatti, J. P. Souza, A. F. Oliveira Neto et al., “Pre-validation
of the WHO organ dysfunction based criteria for identiication of maternal near miss,”Reproductive Health, vol. 8, no. 1, article 22, 2011.
[16] J. G. Cecatti, J. P. Souza, M. A. Parpinelli et al., “Brazilian net-work for the surveillance of maternal potentially life threatening morbidity and maternal near-miss and a multidimensional evaluation of their long term consequences,” Reproductive Health, vol. 6, no. 1, article 15, 2009.
[17] S. M. Haddad, J. G. Cecatti, M. A. Parpinelli et al., “From planning to practice: building the national network for the surveillance of severe maternal morbidity,”BMC Public Health, vol. 11, article 283, 2011.
[18] J. P. Souza, J. G. Cecatti, S. M. Haddad et al., “he WHO maternal near-miss approach and the maternal severity index model (MSI): tools for assessing the management of severe maternal morbidity,”PLoS ONE, vol. 7, no. 8, Article ID e44129, 2012.
[19] S. haddeus and D. Maine, “Too far to walk: Maternal mortality in context,”Social Science and Medicine, vol. 38, no. 8, pp. 1091– 1110, 1994.
[20] R. P. Dellinger, M. M. Levy, J. M. Carlet et al., “Surviving Sepsis Campaign: international guidelines for management of severe sepsis and septic shock: 2008,”Intensive Care Medicine, vol. 34, no. 1, pp. 17–60, 2008.
[21] D. Maine and A. Rosenield, “he safe motherhood initiative: why has it stalled?”American Journal of Public Health, vol. 89, no. 4, pp. 480–482, 1999.
Submit your manuscripts at
http://www.hindawi.com
Stem Cells
International
Hindawi Publishing Corporation
http://www.hindawi.com Volume 2014
Hindawi Publishing Corporation
http://www.hindawi.com Volume 2014
INFLAMMATION
Hindawi Publishing Corporation
http://www.hindawi.com Volume 2014
Behavioural
Neurology
Endocrinology
International Journal ofHindawi Publishing Corporation
http://www.hindawi.com Volume 2014
Hindawi Publishing Corporation
http://www.hindawi.com Volume 2014
Disease Markers
Hindawi Publishing Corporation
http://www.hindawi.com Volume 2014
BioMed
Research International
Oncology
Journal ofHindawi Publishing Corporation
http://www.hindawi.com Volume 2014
Hindawi Publishing Corporation
http://www.hindawi.com Volume 2014 Oxidative Medicine and Cellular Longevity Hindawi Publishing Corporation
http://www.hindawi.com Volume 2014
PPAR Research
The Scientiic
World Journal
Hindawi Publishing Corporationhttp://www.hindawi.com Volume 2014
Immunology Research
Hindawi Publishing Corporation
http://www.hindawi.com Volume 2014
Journal of
Obesity
Journal ofHindawi Publishing Corporation
http://www.hindawi.com Volume 2014
Hindawi Publishing Corporation
http://www.hindawi.com Volume 2014
Computational and Mathematical Methods in Medicine
Ophthalmology
Journal ofHindawi Publishing Corporation
http://www.hindawi.com Volume 2014
Diabetes Research
Journal ofHindawi Publishing Corporation
http://www.hindawi.com Volume 2014
Hindawi Publishing Corporation
http://www.hindawi.com Volume 2014
Research and Treatment
AIDS
Hindawi Publishing Corporation
http://www.hindawi.com Volume 2014
Gastroenterology Research and Practice
Hindawi Publishing Corporation
http://www.hindawi.com Volume 2014
Parkinson’s
Disease
Evidence-Based Complementary and Alternative Medicine
Volume 2014