Iron Regulation of the Major Virulence
Factors in the AIDS-Associated Pathogen
Cryptococcus neoformans
Won Hee Jung1,2, Anita Sham1,2, Rick White3, James W. Kronstad1,2*1The Michael Smith Laboratories, Department of Microbiology and Immunology, University of British Columbia, Vancouver, British Columbia, Canada,2Faculty of Land and Food Systems, University of British Columbia, Vancouver, British Columbia, Canada,3Department of Statistics, University of British Columbia, Vancouver, British Columbia, Canada
Iron overload is known to exacerbate many infectious diseases, and conversely, iron withholding is an important defense strategy for mammalian hosts. Iron is a critical cue forCryptococcus neoformansbecause the fungus senses iron to regulate elaboration of the polysaccharide capsule that is the major virulence factor during infection. Excess iron exacerbates experimental cryptococcosis and the prevalence of this disease in Sub-Saharan Africa has been associated with nutritional and genetic aspects of iron loading in the background of the HIV/AIDS epidemic. We demonstrate that the iron-responsive transcription factor Cir1 inCr. neoformanscontrols the regulon of genes for iron acquisition such thatcir1mutants are‘‘blind’’to changes in external iron levels. Cir1 also controls the known major virulence factors of the pathogen including the capsule, the formation of the anti-oxidant melanin in the cell wall, and the ability to grow at host body temperature. Thus, the fungus is remarkably tuned to perceive iron as part of the disease process, as confirmed by the avirulence of thecir1mutant; this characteristic of the pathogen may provide opportunities for antifungal treatment.
Citation: Jung WH, Sham A, White R, Kronstad JW (2006) Iron regulation of the major virulence factors in the AIDS-associated pathogenCryptococcus neoformans. PLoS Biol 4(12): e410. DOI: 10.1371/journal.pbio.0040410
Introduction
The competition between host and pathogen for iron is a critical aspect of many infectious diseases including malaria, tuberculosis, and diarrheal diseases [1,2]. The availability of iron in host fluids is maintained at extremely low levels (1018
M) by the iron-binding proteins transferrin (Tf) and lactoferrin (Lf). However, pathogenic microbes require 106
to 107M iron for growth, and they must therefore steal iron
from host proteins by binding ferrated Tf or Lf, elaborating siderophores, or degrading hemoglobin or other iron-containing proteins. Iron overload due to genetic predis-position, therapeutic intervention, or nutritional status is known to increase the risk of infection by many pathogens such as HIV,Plasmodium falciparum, Mycobacterium tuberculosis,
and the fungal pathogenCryptococcus neoformans[1,2].
Cr. neoformans is a basidiomycetous yeast that causes life-threatening meningoencephalitis in immunocompromised patients [3]. The major virulence factors of the two well-characterized varieties neoformans (capsule serotype D) and
grubii (capsule serotype A) include the production of a polysaccharide capsule, the deposition of melanin in the cell wall, and the ability to grow at 378C. Acapsular mutants are avirulent, and the capsule has a variety of immunomodula-tory affects, including inhibition of phagocytosis [4–8]. Capsule size is influenced by iron and CO2levels, growth in
serum, and host tissue location [9–12]. Melanin also influen-ces phagocytosis and mediates resistance to oxidative stress [13]. The phenoloxidase (laccase) for melanin synthesis is required for virulence and is regulated by iron [14–16]. Tolerance to host temperature is also required for virulence, and the role of calcineurin in this phenotype has been well characterized [17–20].
Among fungi, iron transport and regulation are best understood in Saccharomyces cerevisiae [21]. Iron uptake is mediated by a high-affinity iron transport pathway in which ferric iron is reduced to ferrous iron by cell surface reductases (Fre1 and Fre2) and subsequently transported by the high-affinity iron permease/multicopper ferroxidase complex (Ftr1–Fet3). These and other components of the iron regulon are regulated by the transcriptional activators Aft1 and Aft2 [22,23]. Other fungi use transcriptional repressors to regulate the expression of iron-responsive genes [24]. Examples include Fep1 inSchizosaccharomyces pombe,
Sfu1 in Candida albicans,and Urbs1 inUstilago maydis. These proteins possess conserved cysteine-rich regions and two zinc finger motifs characteristic of GATA-type transcription factors in higher eukaryotes. Indeed, Fep1 and Urbs1 bind 59-GATA-39 sequences in the promoters of genes encoding high-affinity iron transporters, as well as siderophore production and transport functions [25–27].Cr.neoformansis thought to acquire iron by both high- and low-affinity iron
Academic Editor:Joseph Heitman, Duke University Medical Center, United States of America
ReceivedAugust 3, 2006;AcceptedSeptember 22, 2006;PublishedNovember 21, 2006
DOI:10.1371/journal.pbio.0040410
Copyright:Ó2006 Jung at al. This is an open-access article distributed under the terms of the Creative Commons Attribution License, which permits unrestricted use, distribution, and reproduction in any medium, provided the original author and source are credited.
Abbreviations:GO, Gene Ontology; Lf, lactoferrin; SAGE, serial analysis of gene expression; Tf, transferrin
uptake systems mediated by cell surface reductases [28]. Nonenzymatic reduction of ferric iron by 3-hydroxylanthra-nilic acid and melanin has also been documented [29]. Genome-wide analysis of the response to low iron conditions using serial analysis of gene expression (SAGE) revealed that orthologs of many of theSa. cerevisiaeiron regulon genes (e.g.,
FTR1, FET3,andFRE1) are regulated by iron inCr. neoformans
[30,31]. However, regulators of iron-responsive genes have not yet been identified forCr. neoformans.
In general, the regulatory mechanisms influencing iron transport and homeostasis are poorly understood in patho-genic fungi. Here we report the discovery of a gene that encodes a major transcriptional regulator of the response to iron in Cr. neoformans. This gene, CIR1 (Cryptococcus iron regulator), shares structural and functional features with other fungal GATA-type transcription factors for iron regulation. For example, mutants lackingCIR1have elevated cell surface reductase activity as well as increased sensitivity to iron and phleomycin. Microarray analysis confirmed that
CIR1 influences the transcription of iron transport and homeostasis functions, as well as genes for calcium and cAMP signaling, and cell wall integrity. Parallel genetic analysis revealed thatCIR1also controls the expression of all known virulence functions including capsule, melanin, and growth at host temperature. A similar link between iron and the expression of virulence factors (e.g., diphtheria toxin) occurs in bacterial pathogens [32,33], but the global association
between iron and virulence inCr. neoformansis remarkable. A
cir1mutant was attenuated for virulence in a murine model of cryptococcosis, thus supporting the idea that iron regulation inCr. neoformans,and perhaps in other fungi, is a promising target for antifungal therapy.
Results
Identification and Mutation of theCryptococcusIron Regulator,CIR1
We initially used the sequences of the known fungal iron regulators Fep1, Urbs1, and Sfu1 to identify a candidate iron regulator,CIR1,in the genomes of serotype D and A strains of
Cr. neoformans[31]. Sequences related to theSa. cerevisiaeAft1 polypeptide were not found. A single copy of CIR1 was identified in the serotype D and A strains, and these genes encoded predicted polypeptides of 963 (serotype D) and 952 (serotype A) amino acids (aa) with 93.4% aa identity. The Cir1 sequence was aligned with the fungal GATA-type iron regulators and found to share a zinc finger motif and a cysteine-rich domain (Figure 1A). However, unlike the other fungal iron regulators that have two zinc finger motifs, Cir1 contained only one zinc finger motif (the C-terminal motif), suggesting it may have different properties compared to other fungal iron regulators. We deleted the entire CIR1
coding region in strains representing the D (strain B3501A) and A (strain H99) serotypes and found that the resultingcir1
Figure 1.Conserved Regions of Cir1 and Iron-Related Phenotypes ofcir1Mutants
(A) Amino acid alignment of Cir1 with other fungal GATA-type iron regulators:Sc. pombeFep1 (AAM29187),Ca. albicansSfu1 (AAM77345) andU. maydis Urbs1 (AAB05617). Only the segments of the alignments containing the highly conserved N- or C-terminal zinc finger motifs (top and bottom alignments, respectively) and the cyteine-rich region are shown (middle alignment). Cir1 only has the C-terminal zinc finger motif.
mutants were viable and had similar doubling times in YPD medium at 308C compared to wild-type cells (unpublished data). The cir1 mutations in each strain were also comple-mented by integration of the wild-type gene of each serotype at the CIR1 locus. The absence of CIR1 transcript in the mutants was confirmed by RT-PCR (Figure 1B).
Cir1Mutants Have Iron-Related Phenotypes
Thecir1mutants were tested for iron-related phenotypes, including cell surface reductase activity, as well as sensitivity to iron and the iron-dependent inhibitor phleomycin. InSc. pombe, loss of the transcriptional repressor Fep1 results in elevated cell surface reductase activity, which appears as a red colony color on media with triphenyltetrazolium chloride (TTC) [26]. As expected, colonies of the cir1
mutants also showed an enhanced red color compared with wild-type strains, indicating higher cell surface reductase activity, presumably due to derepression of reductase gene transcription. The mutants complemented with CIR1 had the wild-type phenotype, indicating that the increased reductase activity was due to deletion ofCIR1 (Figure 1C). Excess iron is potentially damaging because it can catalyze the formation of reactive oxygen species via the Haber-Weiss/Fenton reaction [34]. Additionally, the glycopeptide antibiotic phleomycin causes DNA damage in the presence of ferrous iron and oxygen due to the production of reactive species, and sreA and fep1 mutants of Aspergillus nidulans and Sc. pombe, respectively, showed increased
sensitivity to the drug [26,35–37]. In this regard, we found that thecir1mutants displayed sensitivity to excess iron and to phleomycin, indicating that CIR1 is required for iron homeostasis (Figure 1C). As described below, the cir1
mutants also displayed virulence-related phenotypes, includ-ing poor growth at 37 8C, loss of capsule formation, and altered melanin production. Taken together, these results linked Cir1 to iron-related phenotypes and virulence, thus warranting an examination of the influence ofcir1mutation on transcription.
Cir1 Plays a Major Role in the Transcriptional Regulation of Iron-Responsive Genes
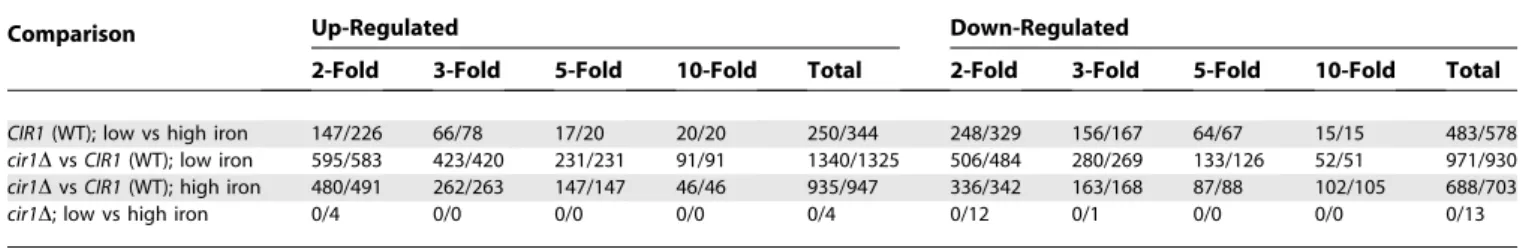
For microarray experiments, wild-type and mutant strains were grown in low- or high-iron medium to analyze the transcriptional changes influenced by iron and by deletion ofCIR1. A loop design was used with microarrays containing 70-mer oligonucleotides for 7,738 genes of the serotype D strain JEC21 (arrays are currently available only for this strain). We found that 733 genes were differentially ex-pressed more than 2-fold in the wild-type strain (based on Q-value statistics). Among these, 483 genes were down-regulated, and 250 genes were up-regulated in low-iron versus high-iron medium, including genes related to iron transport and homeostasis, such as the high-affinity iron permease(FTR1)and the siderophore transporter(SIT1). In general, there was good agreement with the genes found to be regulated by iron in our previous SAGE study [30]. In contrast to the situation with wild-type cells, there were no differentially expressed genes with statistical significance based on q-values in the cir1 mutants in response to iron availability (cir1D; low vs. high iron; Table 1). A less stringent statistical evaluation based on p-values revealed a small number of genes that showed differential expression in the mutant in response to iron. In contrast, the comparisons between the wild-type strain and the cir1 mutant revealed substantial differences in the transcriptomes in both low-iron and high-low-iron conditions. When the wild-type tran-scriptome was compared to that of the cir1 mutant, 2,311 and 1,623 genes were differentially expressed in low-iron and high-iron media, respectively. Overall, these results indicated that Cir1 is a sensor of iron levels for Cr. neoformans and a key regulator of the corresponding tran-scriptional response.
We further analyzed the microarray data based on Gene Ontology (GO) categories for the biological processes of the differentially expressed genes, using the recently developed
Table 1.Number of Genes Differentially Regulated by Iron Availability and/or Cir1
Comparison Up-Regulated Down-Regulated
2-Fold 3-Fold 5-Fold 10-Fold Total 2-Fold 3-Fold 5-Fold 10-Fold Total
CIR1(WT); low vs high iron 147/226 66/78 17/20 20/20 250/344 248/329 156/167 64/67 15/15 483/578
cir1DvsCIR1(WT); low iron 595/583 423/420 231/231 91/91 1340/1325 506/484 280/269 133/126 52/51 971/930 cir1DvsCIR1(WT); high iron 480/491 262/263 147/147 46/46 935/947 336/342 163/168 87/88 102/105 688/703
cir1D; low vs high iron 0/4 0/0 0/0 0/0 0/4 0/12 0/1 0/0 0/0 0/13
The first number in each column is the number of genes calculated by Q-value–based statistics (Q-value less than 0.05); The second number is the number of genes calculated byp-value– based statistics (p-value less than 0.05).
DOI: 10.1371/journal.pbio.0040410.t001
Table 2.The Top Ten GO Terms Identified by Gene Score Re-sampling
GO Term and
Identification Number p-Value
Iron ion transport, GO:0006826 5.3731010
Siderophore transport, GO:0015891 2.6931010
DNA-dependent DNA replication, GO:0006261 1.7931010
DNA metabolism, GO:0006259 4.0431010
DNA repair, GO:0006281 1.943108
Establishment of localization, GO:0051234 2.933106
Regulation of cell cycle, GO:0000074 1.353105
Fatty acid metabolism, GO:0006631 4.723105
External encapsulating structure organization and biogenesis, GO:0045229
1.293104
DNA replication, GO:0006260 2.703104
data-mining tool, ermineJ [38,39]. By using a gene score re-sampling analysis tool with allq-values from the experiments as input scores, we asked which GO categories were most enriched in the differentially expressed genes. The GO terms of iron ion transporter and siderophore transporter were the two most highly ranked groups, indicating that these genes were the most affected by both iron availability and disruption ofCIR1(Table 2). Thus the ermineJ analysis supports the conclusion that Cir1 functions in iron trans-port and homeostasis. Genes related to DNA replication, metabolism, and repair were also among the top-ranked groups; this is consistent with the sensitivity of the cir1
mutants to excess intracellular iron, because transition
metals such as iron are known to provoke the free radical–induced DNA damage [40]. Additionally, genes related to fatty acid metabolism and external encapsulated structure were affected by iron availability and/or disruption of CIR1, indicating (as described further below) that Cir1 has roles in membrane synthesis and cell wall integrity.
Cir1 Regulates Transcript Levels for Genes That Define the Iron Regulon
Differentially regulated genes with GO terms related to iron transport and siderophore transport were extracted from the microarray data and clustered to identify candidate Cir1 targets and patterns of regulation. We found two main clusters of genes with higher transcript levels in response to iron limitation in wild-type cells, a pattern consistent with roles in iron transport (Figure 2A). Cluster I included genes related to reductive iron uptake systems such asFTR1, FET3,
andFRE1. Transcript levels for genes in this cluster were also higher in thecir1mutants, suggesting negative and perhaps direct regulation by Cir1. Interestingly, theLAC1and LAC2
genes encoding laccase for melanin production appeared in cluster I. This result is consistent with a potential role for laccase/melanin in reductive iron metabolism and revealed that Cir1 regulates one of the major virulence factors ofCr. neoformans. Phenotypic confirmation of this result is described below. A separate cluster (II) contained several genes for putative siderophore transporters, includingSIT1,which was recently characterized as a siderophore transporter (K. Tangen, W. Jung, A. Sham, T. Lian, and J. Kronstad, unpublished data). Transcript levels for the genes in cluster II were decreased in the cir1mutant, especially in low-iron medium, thus raising the possibility that Cir1 may function both as a transcriptional repressor and an activator.
The microarray data were confirmed by RNA blot hybrid-ization with selected genes from the serotype D strain B3501A, and we extended the analysis to include the same genes from the serotype A strain H99 for comparison. In general, the expression patterns matched the results from the microarray experiments (Figure 2B). For example, theFTR1
transcript was clearly elevated in thecir1mutant relative to the wild-type or reconstituted strains for both serotypes (Figure 2B). The FRE1 and LAC1 genes showed a similar pattern of regulation, with higher transcript levels in thecir1
mutant. These results support the placement of these genes in cluster I (Figure 2A) and suggest that Cir1 negatively regulates their expression. The hybridization results with SIT1 and
CIG1 (encoding an iron-regulated cell wall protein; [30]) illustrate the pattern for cluster II genes in which loss of Cir1 results in lower transcript levels. We noted that a transcript signal was not found for theFRE1gene from strain H99, and this may indicate a divergence in regulation between the strains or serotypes. It is possible that other ferric reductase genes may be more important and more highly regulated in strain H99 than the one chosen for this analysis. Additionally,
FTR1and LAC1in thecir1mutant of H99 (serotype A), but not in the mutant of B3501A (serotype D), clearly showed differential regulation by iron, implying that other regulators besides Cir1 may control their transcription and that the two serotypes may have different regulatory mechanisms. Overall, these results suggest that Cir1 negatively regulates expression of the reductive iron transport pathway and positively Figure 2.Cir1 Directly Regulates Genes Required for Iron Transport
(A) Cluster analysis of genes required for iron transport show two patterns of differential expression in the cir1 mutant (serotype D), resulting in two main clusters (I and II). Columns represent the log-transformed ratio of the array data from the wild-type strain in low-versus high-iron medium (WT LIM vs. LIMþFe), thecir1mutant versus the wild-type strain in low-iron medium (MT vs. WT LIM), thecir1mutant versus the wild-type strain in high-iron medium (MT vs. WT LIMþFe), and thecir1mutant in low- versus high-iron medium (MT LIM vs. LIMþ Fe).
regulates iron-uptake systems mediated by siderophore transporters inCr. neoformans.
Cir1 Is Required for Elaboration of the Polysaccharide Capsule
The polysaccharide capsule is the major virulence factor of
Cr. neoformans[11,12]. Given that iron limitation results in an enlarged capsule, we evaluated the effect ofCIR1disruption on capsule formation by growing cells in low-iron medium. No capsule was visible on cells of thecir1mutants of both the serotype D and serotype A strains, whereas the wild-type and reconstituted strains displayed large capsules (unpublished data). Capsule formation was also evaluated by growing the cells in the presence of 5% CO2 at 37 8C to mimic the
mammalian host environment. Elevated CO2 is known to
induce capsule formation, but thecir1mutants still showed defective capsule formation under these conditions (Figure 3A). These results demonstrate that Cir1 is necessary for capsule formation, perhaps through the regulation of genes needed for sensing iron and CO2levels, or for the synthesis,
transport, or attachment of capsule components.
The loss of capsule production in the cir1 mutants
prompted us to examine the microarray data for insights into potential targets of Cir1 regulation that might account for this phenotype. We first compiled a list of genes related to signaling pathways and other components known to influence capsule and virulence (Table 3). We then examined the influence of iron and loss of Cir1 on the expression of these genes, with particular attention to targets like theCAPand
CAS genes that are known to influence capsule formation [11,41]. Many of these genes were differentially expressed in the cir1mutants, but the changes were not significant. The
CAS32gene was the exception, with 9.77- and 11.44-fold up-regulation in the cir1 mutants in low-iron and high-iron media, respectively. This gene and otherCASfamily genes are homologs of the CAP64 gene that is required for capsule formation; however, the CAS genes are involved in xylose branching and/or O acetylation of the capsule polysaccharide rather than capsule formation per se [41]. Therefore, it is not clear whether transcriptional changes in these capsule-related genes caused the capsule defect in thecir1mutants.
We also evaluated components of the cAMP pathway that positively regulates both capsule synthesis and melanin production in Cr. neoformans and found that transcripts for Figure 3.Thecir1Mutants Are Defective in Expression of Major Virulence Factors
(A) Strains were grown in low-iron medium (LIM) or RPMI medium at 378C under 5% CO2. Photographs were taken after 24-h incubation and after negative staining using India ink to visualize the capsule. Scale bars denote 10lm. WT, wild type.
(B) Thecir1mutants of the serotype D strain displayed increased sensitivity to SDS and the antifungal drug amphotericin B. Decreased sensitivity was found to miconazole.
(C) Thecir1mutants of both serotype backgrounds displayed a growth defect at 378C; two independently generated mutants show the same phenotype.
(D) Sensitivity of thecir1mutants to FK506 and CaCl2was tested, and mutants in both serotype backgrounds displayed increased sensitivity compared to the wild-type strains.
Table 3.List of Genes Differentially Expressed and Related to Virulence Factor Expression
Function Gene ID Gene Name
TIGR Annotation Fold Changes
WTa, LIM vs. LIMþFe
MTbvs. WT, LIM
MT vs. WT, LIMþFe
MT, LIM vs. LIMþFe
Melanin production 177.m02973 LAC2 Laccase (EC 1.10.3.2) precursor 1.06 10.18 12.04 1.12
177.m03382 LAC1 Diphenol oxidase putative 1.02 11.86 11.57 1.00
183.m01707 CCC2 Copper exporting ATPase putative 3.05 8.82 2.87 1.01
Capsule synthesis 163.m06357 CAP1 Capsular associated protein 1.52 2.54 1.48 1.13
163.m02736 CAP2 CAP1related 1.51 2.67 1.56 1.13
186.m03567 CAP64gene product-related 1.59 1.26 2.24 1.12
181.m08333 CAP60 Capsular associated protein 1.57 2.12 1.34 1.01
181.m08424 CAS31 CAP64gene product-related 1.36 2.48 1.58 1.16
181.m08828 CAP64gene product-related 4.06 2.05 1.60 1.23
179.m00426 CAP64 Capsular associated protein 1.62 2.05 1.22 1.04
181.m08443 CAP59 Capsular associated protein 1.65 2.49 1.53 1.02
183.m01720 CAS1 O-acetyltransferase 2.15 2.09 1.13 1.16
177.m03097 UXS1 UDP-glucuronic acid decarboxylase 2.79 3.65 1.35 1.03
181.m07891 CAS32 Expressed protein 1.15 9.79 11.44 1.01
176.m02213 CAS33 Conserved hypothetical protein 1.28 2.68 3.03 1.13
Phospholipase 179.m00415 Phosphoinositide phospholipase C putative
1.28 1.94 2.36 1.05
164.m02067 PLB1 Lysophospholipase putative 1.17 4.43 3.74 1.02
Cell wall/membrane synthesis
162.m02909 Chitinase putative 1.69 3.80 1.93 1.17
181.m08287 Chitin synthase 6 putative 2.16 5.52 2.26 1.13
167.m05877 Chitin synthase putative 1.43 20.02 11.81 1.19
179.m00005 Chitin synthase putative 2.24 4.94 2.25 1.02
163.m06424 Chitin deacetylase-like mannoproteins MP98
2.87 7.00 2.65 1.08
176.m02168 Cell wall chitin biosynthesis-related protein putative
2.76 4.47 1.48 1.09
180.m00321 Chitin synthase-related 2.32 3.20 1.12 1.23
184.m04559 Chitin synthase 4 putative 1.53 1.89 2.51 1.15
179.m00408 Endo-1,3(4)-b-glucanase putative 1.13 2.11 1.74 1.08
183.m01799 1,3-b-glucanosyltransferase putative 2.64 1.38 2.18 1.14
184.m05026 Exo-b–1,3-glucanase 5.28 3.67 1.34 1.08
177.m03284 a-1,3-glucan synthase putative 1.59 1.89 2.94 1.02
183.m01871 Glucan 1,3b-glucosidase protein putative
1.37 2.63 1.81 1.06
1641.seq.041 b-glucan synthesis-associated protein putative
1.13 12.99 8.15 1.41
184.m04807 Exo-b-1,3-glucanase 4.51 2.89 1.36 1.15
164.m02008 b-glucan synthesis-associated protein putative
1.61 4.51 3.42 1.22
176.m02411 b-1,3 glucan biosynthesis-related protein putative
2.18 2.60 4.62 1.23
179.m00221 C-4 methyl sterol oxidase putative 1.01 1.81 2.23 1.25
181.m08573 C-8 sterol isomerase putative 1.04 2.37 2.50 1.10
162.m02824 Oxysterol-binding protein putative 1.14 2.14 2.19 1.12
179.m00247 Sterol metabolism-related protein putative
1.29 2.16 1.64 1.03
1641.seq.139 Sterol metabolism-related protein putative
1.29 7.31 5.28 1.07
179.m00248 Sterol metabolism-related protein putative
1.16 2.10 1.92 1.06
181.m07816 Sterol 14-demethylase putative, CaERG11homolog
2.44 1.26 1.66 1.17
163.m06278 3-keto sterol reductase putative 2.24 3.27 1.42 1.02
181.m08622 C-5 sterol desaturase putative, CaERG3homolog
1.27 4.61 3.97 1.09
G proteins and GPCRs 181.m07997 Ras guanyl-nucleotide exchange factor putative
2.57 5.09 2.11 1.07
180.m00299 GPR2 GTPase activating protein putative 2.42 4.45 2.18 1.19
185.m02504 GPR4 Expressed protein 1.7 6.4 10.77 1.01
164.m02000 GPR1 Conserved hypothetical protein 1.09 5.07 3.58 1.55
186.m04059 GPR3 Membrane protein putative 1.07 2.25 2.06 1.02
184.m04563 GPR5 Expressed protein 1.28 2.03 1.48 1.07
cAMP pathway 1712.seq.156 cAMP-dependent protein kinase putative
genes encoding adenylate cyclase or the catalytic subunit of PKA showed only subtle differences (Table 3; [42–44]). However, expression of the upstream G protein–coupled receptor (GPCR) Gpr4, which appears to activate Gpa1 in the cAMP pathway [45], was significantly reduced in the cir1
mutants with 6.4- and 10.77-fold down-regulation in low-iron and high-iron conditions, respectively, compared to wild-type cells. Becausegpr4mutants are defective in capsule synthesis, the loss of capsule in thecir1mutants could be due to down-regulation of this upstream receptor of the cAMP pathway. To test this hypothesis, thecir1mutants were grown in low-iron medium containing 10 mM cAMP. This resulted in only slight restoration of capsule formation in thecir1mutants of the serotype A strains (less than 20% of wild-type capsule size; unpublished data), but not in thecir1mutants of the serotype D strains. Therefore, we conclude that the deficiency in capsule synthesis of the cir1 mutants is likely caused by alterations in other pathways in addition to the cAMP pathway.
Melanin production and glucose sensing were shown to be independent of Gpr4, indicating the potential involvement of other receptors [45]. Genes for other GPCRs were also differentially regulated in thecir1mutants, includingGPR1,
which was down-regulated in thecir1mutants in both low-iron and high-low-iron conditions, andGPR2and GPR3,which were up-regulated in the mutants in both conditions. No obvious phenotypes have been associated with these genes, and it is not clear that they influence the phenotypes of the
cir1mutants [45]. Taken together, these data revealed that the
membrane receptors of the cAMP pathway, but not the downstream effectors, were influenced by deletion ofCIR1.
Cir1 Influences Cell Wall Integrity and Membrane Functions
The cell wall is an important interface between Cr. neoformans and the host, and our earlier SAGE analysis of the response to iron limitation identified genes for wall components [30]. We therefore tested the cir1 mutants for sensitivity to agents that challenge cell wall integrity and found reduced growth of thecir1mutant in the serotype D strain background on medium containing SDS (Figure 3B). We also examined the microarray data and found that the transcripts for genes encoding functions for the regulation, synthesis, and modification of chitin and glucan were generally increased in thecir1mutants (Table 3). Components of the Mpk1 (PKC1) MAPK pathway have been shown to regulate cell wall integrity inCr. neoformans[46,47], and our microarray data revealed that the transcript of MPK1 was 3.46-fold up-regulated in the cir1mutant compared to wild type in low-iron medium. We also found a gene for another MAP kinase (162.m02830) with high similarity to Mpk1 (55% identity and 70% similarity) on the same chromosome (Chromosome 9), and the transcript of this gene was significantly higher in the cir1mutants (6.22- and 3.21-fold in low-iron and high-iron conditions, respectively). These results support the idea that cell wall integrity is challenged by loss of Cir1 (Figure 3B) and that the Mpk1 MAP kinase pathway may be over-activated as a consequence.
Compo-Table 3.Continued
Function Gene ID Gene Name
TIGR Annotation Fold Changes
WTa, LIM vs. LIMþFe
MTbvs. WT, LIM
MT vs. WT, LIMþFe
MT, LIM vs. LIMþFe
177.m03207 CAC1 Adenylate cyclase putative 2.11 2.08 1.12 1.10
Calcium signaling pathway
185.m02569 CNA1 Calcineurin A catalytic subunit putative 1.16 2.41 2.05 1.02
184.m04425 Calmodulin dependent protein kinase I (CDPK) putative
1.21 7.63 5.22 1.21
181.m07899 Cyclophilin putative 1.21 2.02 2.55 1.04
163.m02744 FK506-binding protein 39 K Da putative 3.86 3.21 1.32 1.10
181.m07805 Calcium ion transporter putative 1.22 3.47 2.68 1.06
163.m06348 MYO2related 1.55 3.98 6.88 1.09
180.m00421 CDC1putative 1.56 3.47 2.23 1.00
MAPK pathway and mating
162.m02645 MPK1 MAP kinase putative 2.22 3.46 1.30 1.20
186.m03823 MAP kinase phosphatase putative 1.76 2.30 1.31 1.00
162.m02830 MAP kinase putative 1.76 6.22 3.27 1.08
179.m00215 MAP kinase kinase putative 1.79 2.46 1.23 1.11
185.m02529 MKH1 MAP kinase kinase kinase 1.56 2.47 1.85 1.17
167.m05768 CPK1 Mitogen activated protein kinase 1.39 2.32 1.88 1.13
163.m06364 STE11a Ste11aprotein 1.14 2.28 2.42 1.20
180.m00053 SWI10 Mating-type switching protein putative 1.01 2.58 2.67 1.05
186.m03862 Pheromone receptor 1 putative 1.00 2.03 1.80 1.12
Genes listed in the table were selected based on two criteria; (1) 2-fold differential expression in at least one experiment with statistical significance (Q-value less than 0.05), and (2) either having annotation information providing linkage to known pathways related to virulence factor expression, or previously found to play a role in virulence factor expression. Genes that have been characterized experimentally are listed under their designated name based on citations in the text.
a
The wild-type strain.
b
Thecir1mutant.
nents of other MAPK pathways in Cr. neoformans were also examined, and we found that disruption of CIR1 caused increased transcript levels for two components of the mating pathway:CPK1and STE11a(an upstream MPKKK of Cpk1). Taken together, these results suggest that Cir1 may influence the cell wall through more than one mechanism, including the regulation of genes for biosynthetic enzymes and signal-ing components.
The microarray analysis implicated Cir1 in the regulation of genes for ergosterol synthesis, a result consistent with the increased sensitivity of thecir1mutant to the antifungal drug amphotericin B and the decreased sensitivity to miconazole that we observed (Figure 3B). Cir1 may play a role in remodeling sterol composition, perhaps through an influence on the iron-containing enzymes known to be required for sterol and unsaturated fatty acid biosynthesis. Furthermore, the transcript forAFR1, which encodes an ABC transporter protein responsible for azole resistance [48], was 3.2- and 4.64-fold up-regulated in thecir1mutants in low- and high-iron conditions, respectively (unpublished data). This result suggests that Cir1 may also influence anti-fungal resistance through regulation of membrane transporters. We should note, however, that thecir1mutant in strain H99 (serotype A) did not display altered sensitivity to SDS or the antifungal drugs tested, suggesting that there are strain or serotype differences in the influence of Cir1 (unpublished data). A number of phenotypic differences have been reported for
serotype A and D strains, including differences in the phenotypes controlled by signaling pathways [44,49]. Two additional membrane-related genes that showed regulation by Cir1 encoded a putative phospholipase C and a lysophos-pholipase(PLB1). The negative regulation ofPLB1by Cir1 is interesting because this gene is required for full virulence in strain H99 [50]. The PLB1 transcript was elevated 4.43-fold and 3.74-fold in the cir1mutant in low-iron and high-iron conditions, respectively (Table 3). It was previously reported that Plb1 activity is negatively regulated by another zinc finger protein Ste12a in a serotype D strain, and we hypothesize that there might be coordinate regulation with Cir1 [51,52].
Cir1 Links Temperature- and Calcium-Sensitive Growth with Iron Homeostasis
We next examined the ability of thecir1mutants to grow at host temperature, because this is a critical virulence trait. The growth of the cir1 mutants resembled the wild-type and reconstituted strains at 30 8C, but the mutants displayed a marked growth defect at 378C (Figure 3C). Cir1 may directly or indirectly regulate genes related to temperature stress, potentially in conjunction with calcium/calcineurin signaling inCr. neoformans[17–19]. This idea is supported by our array data, which identified differentially expressed genes for the calcineurin catalytic subunit (CNA1) and for the following putative proteins: cyclophilin, FK506-binding protein, calm-odulin dependent protein kinase (CDPK), and a calcium ion transporter (Table 3). Transcript levels of MYO2 and CDC1
were also affected by deletion of CIR1. These genes are interesting because of their relationship with calcium homeostasis inSa. cerevisiaeand becauseMYO2 is a putative downstream target of the calmodulin pathway in Cr. neofor-mans [20,53]. We confirmed that calcium homeostasis was altered in the cir1 mutants, by demonstrating increased sensitivity to exogenous CaCl2and FK506 (Figure 3D). These
results revealed important links between calcium and iron regulation.
Cir1 Negatively Regulates Laccase Expression
As noted earlier, theLAC1andLAC2genes were part of a cluster of genes encoding high-affinity and reductive iron-uptake functions, thus suggesting a possible role for laccase in related activities (Figure 2A). The marked up-regulation of
LAC1 in thecir1 mutant in both low- and high-iron media prompted an analysis of laccase activity under the same conditions. As shown in Figure 4A, laccase activity was indeed increased in thecir1mutants compared to wild-type cells, in agreement with the microarray experiments. We also noticed that the activity of laccase in the serotype A strain (H99) was generally higher than in the serotype D strain (B3501A), further reinforcing the differences between the strains and suggesting a possible contribution of laccase activity to the relatively higher virulence of the H99 strain. We investigated whether the elevated laccase activity in thecir1mutants was affected by the glucose concentration in the medium, because glucose is known to repress expression [14]. Laccase activity appeared to be constitutive in thecir1mutants with regard to glucose concentration (0.1%, 0.5%, and 1.0%; Figure 4B). As expected, the wild-type and reconstituted strains displayed derepression of laccase activity only in media containing 0.1% glucose. Similarly, constitutive de-repression of laccase Figure 4.Cir1 Negatively Regulates Laccase Activity
(A) Strains were grown in LIM and LIMþFe under the same conditions used for the microarray experiments (0.5% glucose), and laccase activity was measured as described in Materials and Methods. WT, wild type. (B) Strains were grown in LIM containing different concentrations of glucose as indicated, and laccase activity was measured. All experiments were repeated three times, and averages are indicated with a bar (standard deviation).
(C) Laccase activity of the wild-type, mutant, and reconstituted strains was compared by growing 1.03105cells on DOPA plates with different concentrations of glucose as indicated. Photographs were taken after 3 d of incubation at 308C.
in the cir1 mutants was observed on DOPA medium with different glucose concentrations (Figure 4C). Finally, we noted a higher transcript level for the gene encoding the copper transporter Ccc2 in the cir1 mutant, indicating negative regulation by Cir1 (Table 3). Ccc2 is required for melanization inCr. neoformans,possibly through an influence on intracellular copper concentration [54]; this role for Ccc2 may also contribute to the increased laccase activity of the
cir1mutant. We conclude that Cir1 is a negative regulator of laccase expression and that Cir1 is required for the influence of glucose on laccase expression.
Loss of Cir1 Abolishes Virulence
The accumulation of virulence-related phenotypes forcir1
mutants strongly suggested a defect in virulence, and we tested this prediction in the mouse inhalation model of cryptococcosis. We tested thecir1mutant in the serotype A strain H99 because this background displays the highest virulence, and we found that the mutant was avirulent. In contrast, mice infected with the parental or reconstituted strains succumbed to infection by approximately 20 d (Figure 5). These results strongly support our hypothesis that Cir1 is a key regulator of virulence gene expression, and demonstrate the importance of iron regulation for cryptococcosis.
Discussion
The mechanisms by which fungal pathogens sense the mammalian host environment and regulate virulence factor expression are poorly understood. To address this issue, we identified Cir1 as a candidate iron-responsive transcription factor in Cr. neoformans, and characterized phenotypic and transcriptional changes resulting from deletion of the gene. Remarkably, we found that Cir1 regulates the majority of iron-responsive genes and influences all of the major known virulence factors (summarized in Figure 6). Specifically, the transcript levels for 733 genes changed in wild-type cells in response to iron concentration. Of these, 250 were up-regulated in low-iron versus high-iron medium, and deletion of CIR1 largely eliminated the response of this group of genes. Key iron-related genes that were negatively regulated
by Cir1 included components of the reductive uptake system (i.e.,FRE1, FTR1,andFET3). Orthologs of some of these genes are also negatively regulated by Sfu1 in Ca. albicans and by Fep1 in Sc. pombe [26,27,55]. Candidate siderophore trans-porter genes are also negatively regulated by Fep1 and Sfu1 [27,55] but, in contrast, these functions appeared to be positively regulated by Cir1 suggesting that the protein may function both as a repressor and an activator to regulate different iron transport systems. Lan et al. also found that Sfu1 has both positive and negative regulatory functions, and interestingly, some of the positively regulated functions included cell-surface components [55]. Structural differences between Cir1 (e.g., single zinc finger motif) and the other fungal iron regulators (two zinc finger motifs) may account for variation in regulatory capabilities.
The positive influence of Cir1 may result from downstream regulators that transcriptionally or post-transcriptionally control the genes for siderophore transporters and other functions. InSa. cerevisiae,the iron regulators Aft1 and Aft2 control expression of Cth2, which in turn enhances mRNA decay for transcripts of genes of the TCA cycle as well as sterol and heme biosynthesis [56]. This study and work in bacteria and mammalian cells reveal that post-transcriptional regulation is an important component of the cellular response to iron deprivation [57,58]. Although additional levels of iron regulation have not yet been identified inCr. neoformans,we hypothesize that the positive and negative roles of Cir1 might allow modulation of iron acquisition systems in response to different iron sources available in the host or the environment. It is interesting to note that Cir1 shares regulatory features with the iron-responsive transcription factors such as Fur (Ferric uptake regulator) in bacterial pathogens [32,33]. One feature in common is that Fur can exert both positive and negative regulation, as demonstrated in Escherichia coli, Helicobacter pylori, Neisseria meningitides,and
Vibrio cholerae [59–63]. Moreover, bacterial Fur proteins not only influence iron uptake/homeostasis, but also several other cellular processes including pyrimidine metabolism, methio-nine biosynthesis [64], nonfermentable carbon source uti-lization [65], acidic tolerance [66], oxidative stress [60], chemotaxis [67], and virulence factor (e.g., shiga toxin and diphtheria toxin) expression [68]. The diversity of these processes is reminiscent of the features of Cir1 regulation revealed by our expression studies (Figure 6).
Our analysis of Cir1 revealed a link between iron regulation and melanin production, an important virulence trait in Cr. neoformans [13,69–71]. The neurotropism of Cr. neoformansmay result in part from the ability of the fungus to produce protective melanin from catecholamines in the brain [14]. A recent study demonstrated that laccase is expressed early in murine infection (until 24 h) and decreases thereafter as the fungal burden rises [72]. The same study showed that laccase is released from the cell wall in vivo, and suggested a role for laccase as an antioxidant or an iron scavenger. Lui et al. also proposed iron-related functions for laccase, based on the similarities of the copper-containing regions of laccase and Fet3 [73]. The enzyme does possess strong ferrous iron oxidase activity in the absence of substrates, and this activity may protect cells from hydroxyl radicals generated from host macrophages and neutrophils, and potentially contribute to iron transport [73]. Our observations support a role for laccase in iron metabolism, because LAC1 and LAC2 were Figure 5.Thecir1Mutants Are Attenuated for Virulence
Ten female A/Jcr mice were infected intranasally with the wild-type, serotype A strain H99 (filled circle []), a serotype Acir1mutant strain (open triangle [D]) or a reconstituted strain (open circle [*]). The survival
of the mice is shown versus time in days. The assay was repeated twice with two independently generated mutants, and a representative result is shown.
identified as targets of Cir1 with expression patterns similar to genes of the reductive iron transport pathway (e.g.,FTR1
and FET3). We speculate that laccase oxidation of ferrous iron may be important during infection in addition to the enzyme’s role in melanin production. The fact that laccase is expressed only during very early stages of infection would be consistent with a role in iron acquisition and in protection of fungal cells from hydroxyl radical attack from host cells during the initial adaptation to the host environment. Additionally, we found putative Cir1 binding sites (GATA motif) in the promoter region ofLAC1 (unpublished data), and interestingly, regions containing these motifs were previously proposed to bind to negative regulatory proteins [74]. Up-regulation of the copper transporter Ccc2 in thecir1
mutant may increase intracellular copper concentration and partly contribute to higher laccase activity, because copper is known to induce transcription ofLAC1[54,75].
The cell wall plays a key role in the virulence of Cr. neoformans as the site of melanin deposition and capsule attachment [11,12,76]. We found that Cir1 and iron may influence cell wall remodeling and capsule formation by at least two mechanisms. First, the transcription of genes related to cell wall functions, including chitin synthases anda -1,3-glucan synthase, was altered in the cir1 mutants, and the mutants have defects in cell wall integrity. Additionally, Cir1 influences expression of the MAP kinase of the cell wall integrity pathway (MPK1). Capsule polysaccharide attach-ment to the cell surface requires a-1,3-glucan [76] and deletion ofCIR1 may alter glucan composition to influence attachment. A second mechanism may involve Cir1 regu-lation of the cAMP pathway that controls capsule and melanin formation [43]. We found that the transcript for Gpr4 is positively controlled by Cir1, and Xue et al. have shown that the capsule size of thegpr4mutants is reduced by 30% compared to the wild type [45]. In this study, exogenously added cAMP partially restored capsule on cells
of thecir1mutants in the serotype A, but not the serotype D background. Together, these results suggest that Cir1 interacts with the cAMP pathway, but that the protein regulates other capsule-related functions. That is, the mechanisms for biosynthesis and assembly of the capsule are undoubtedly complex, and the capsule defect in cir1
mutants likely is due to additional mechanisms. For example, changes in the redox status on the cell surface of the mutants could contribute to poor capsule assembly or attachment. Surface changes would be consistent with the higher levels of cell surface ferric reductase and laccase activity displayed by the mutants.
We found that loss ofCIR1influences the transcript levels for components involved in calcium signaling (e.g., calcineur-in), and an extensive body of elegant work connects these functions to virulence and the stress response in Cr. neofor-mans[77,78]. Additionally, Kraus et al. showed that inactiva-tion of calcineurin causes an Mpk1-dependent increase in transcript level for theFKS1gene encoding a component of
b-1,3-glucan synthase [46]. Our phenotypic analysis revealed thatcir1mutants showed increased sensitivity to CaCl2and
FK506, as well as a growth defect at 378C, implying that Cir1 and calcium signaling components influence common targets. Connections between iron and calcium homeostasis could occur at a number of levels. For example, the up-regulation of a calcium transporter or a putative Ca2þ
/calmodulin-depend-ent protein kinase (type II) in thecir1mutant (Table 3) could influence sensitivity to calcium. The kinase is one of the downstream regulatory proteins activated by Ca2þ/calmodulin along with calcineurin. It is also possible that elevated intracellular iron in thecir1mutants might directly influence the activity of calcineurin because this protein contains a Fe-Zn dinuclear metal center at its active site that is required for full activity [79].
Defects in host iron homeostasis exacerbate many bacte-rial, fungal, and parasitic infections [1,2,80]. For fungi, iron Figure 6.Cir1 Is a Central Regulator of the Iron Regulon, Virulence Factor Expression, and Virulence-Associated Signaling Pathways
A schematic of the functions controlled by Cir1 is shown to indicate positive and negative regulation, and interconnections between signalling pathways and downstream target functions. Red arrows indicate positive regulation by Cir1, and blue blunt arrows indicate negative regulation by Cir1. The genes beneath each functional box are downstream targets of Cir1 as experimentally determined by the present study and as listed in Table 3. Gene names are listed for those that have already been characterized; TIGR gene identifiers are used for the other genes.
overload increases the mortality of mice infected with Ca. albicans, and elevated iron was found in patients with vulvovaginal candidosis [81,82]. Similarly, iron overload and chelation therapy with deferoxamine both enhance zygomy-coses, thus illustrating the importance of a balance in iron availability [83]. Iron overload and other host factors such as smoking also exacerbate cryptococcal meningoencephalitis, perhaps by stimulating fungal growth and perturbing macro-phage-mediated anticryptococcal defenses [84–86]. Our analysis of Cir1 reveals the underlying importance of iron sensing in the expression of virulence factors leading to cryptococcosis. These finding could have therapeutic value because the prevalence of cryptococcosis in sub-Saharan Africa may be associated with nutritional and genetic aspects of iron overloading in the background of the HIV/AIDS epidemic [87,88]. An understanding of the regulation ofCr. neoformansvirulence could have considerable impact because cryptococcosis is responsible for 13%–44% of all deaths of HIV-infected patients in sub-Saharan Africa [89].
Materials and Methods
Strains and growth conditions.Strains (Table S1) were grown in yeast extract, bacto-peptone, and 2.0% glucose (YPD; Becton, Dickinson and Company, Franklin Lakes, New Jersey, United States) medium or yeast nitrogen base (YNB, Becton, Dickinson and Company) with 2.0% glucose. Low-iron medium (LIM) was prepared as described [9]. Iron-replete medium (LIMþFe) contained 100lM of ethylenediaminetetraacetic acid ferric-sodium salt (FeEDTA; Sigma, St. Louis, Missouri, United States).
Isolation of CIR1 and mutant construction. The CIR1 genes in strains B3501A and H99 were identified by searching for homologs of
Sc. pombeFep1 in the serotype D genome database (TIGRCryptococcus neoformansGenome Project [http://www.tigr.org/tdb/e2k1/cna1/]) or the serotype A genome database (Broad InstituteCryptococcus neoformans
Database [http://www.broad.mit.edu/annotation/fungi/cryptococ-cus_neoformans/index.html]), respectively. The cDNAs ofCIR1from B3501A and H99 were amplified by RT-PCR, cloned into pCR2.1 (Invitrogen, Carlsbad, California, United States), and sequenced.
To constructcir1mutants, the entire locus ofCIR1in both B3501A (3,606 base pairs [bp]) and H99 (3,576 bp) was replaced by a disruption cassette containing the nourseothricin acetyltransferase gene(NAT)and 59and 39flanking sequences ofCIR1were included for homologous recombination. The primers J2FEP-5F and J2FEP-5R, and J2FEP-3F and J2FEP3R were used to amplify the 59upstream (911 to11) and the 39downstream regions (þ3,608 toþ4,655) of B3501ACIR1,respectively (Table S1). The primers H9FEP-5F and H9FEP-5R (1,024 to33), and H9FEP-3F and H9FEP-3R (þ3,805 to þ4,806) were used to amplify the 59upstream and the 39downstream region of H99CIR1, respectively (Table S1). Amplified 59 and 39
flanking regions from B3501ACIR1and H99CIR1were digested with XhoI and ApaI, and, SpeI and SacI, respectively, and ligated to pCH233 containing theNATgene to generate plasmids pWH008 and pWH016. Disruption cassettes from the plasmids were amplified by PCR using primers J2FEP-5F and J2-FEP3R, and H9FEP-5F and H9FEP-3R, and biolistically transformed into wild-type strains as described previously [90]. Positive transformants were identified by PCR and confirmed by Southern blot analysis (Figure S1). At least two independent mutants in each strain were used throughout the study. To construct reconstituted strains, primers F-Xb and J2CIR-R-Nt, and H9CIR-F-Xb and H9CIR-R-Nt were used to amplify the wild-typeCIR1genes from B3501A and H99, respectively (Table S1). These fragments were digested with XbaI and NotI and cloned to pCH233 to construct pWH020 and pWH021. The SacI- and SpeI-digested fragments from pWH008 and pWH016 were then cloned into pJAF to construct pWH023 and pWH024 containing the neomycin-resistant marker(NEO)and the 39downstream regions of
CIR1 of B3501A and H99, respectively. The NEO-CIR1 39 region fusion fragments were released by digestion with NotI and KpnI, and were cloned into pWH020 and pWH021 digested with the same enzymes, respectively. The resulting plasmids pWH031 and pWH034 were digested with XbaI and transformed into thecir1mutants of B3501A and H99, respectively. Positive transformants containing the wild-typeCIR1gene at its authentic locus were identified by PCR.
Phenotypic analysis. The overlay assay with TTC (Sigma) to evaluate cell surface reductase activity was performed as described previously [91,92]. To assess strain sensitivity to iron-restricted or to iron-overload conditions, 1.0 3104 cells were spotted onto YPD
medium (containing 0.75 mM ferrozine) with or without 200 lM FeEDTA and were grown at 308C for 2 d. Phleomycin sensitivity was performed by spotting 1.03104cells onto YPD medium containing 0.25-lg/ml phleomycin. For other plate assays, 10-fold serial dilutions of cells were spotted onto YPD plates containing chemicals as indicated, with incubation at 308C for 2 to 3 d. To assess capsule formation, cells were grown in YNB medium at 30 8C overnight, washed twice with low-iron water, and diluted to 5.03106cells/ml in
LIM or RPMI medium (Invitrogen). Cells were then grown for 24 h at 308C or 378C under 5% CO2.
Laccase assay.Cells were grown in YNB overnight at 308C, pelleted and then washed three times with LIM, diluted to 1.03107cells/ml in 50 ml of LIM with 0.1%, 0.5%, or 1.0% glucose, and incubated for 12 h at 308C. After incubation, 1.03107cells were withdrawn from each culture and then washed three times with LIM. Cells were then incubated in 10 mM L-DOPA (Sigma) for 30 min (B3501A) or 10 min (H99) at 30 8C. A shorter incubation time was applied for H99 because the significantly stronger melanin formation of the serotype Acir1mutants causes precipitation of melanin in the reaction tubes and interferes proper OD readings. Cells were pelleted at the end of the incubation and the absorbance (A475) of the supernatant was
measured. The enzyme activity was calculated as A475of 0.001¼1 unit
of laccase. DOPA medium was used for plate melanin assays as described [93,94].
RNA hybridization and microarray experiments.Thecir1mutant B3CIR1#572 and the parent strain B3501A were used for microarray analysis. Three biological replicates for each strain were grown in 50 ml of YNB overnight at 308C, followed by growth in LIM at the same temperature for an additional 12 h. The latter step was added in order to eliminate any iron carryover from the rich medium. Cultures were harvested and then washed twice with LIM. Cell numbers were determined, and cells were transferred to 50-ml LIM or LIMþFe (final density of 1.03107cells/ml). Cells were grown at 308C for
another 12 h, harvested, and lyophilized for RNA extractions. Cell densities at the time of harvest were 5.03107cells/ml (wild type in
LIM), 1.03108cells/ml (wild type in LIMþFe), 1.03107cells/ml (cir1D
in LIM), and 1.53107cells/ml (cir1Din LIMþFe). Trizol (Invitrogen)
was used for total RNA extractions following the manufacturer’s recommendations. RNA was analyzed with the Agilent 2100 Bio-analyzer (Agilent Technologies, Santa Clara, California, United States) and cDNA was synthesized from 5 lg of total RNA by SuperScriptII Reverse Transcript Enzyme (Invitrogen). The 3DNA Array 350 kit (Genisphere, Hatfield, Pennsylvania, United States) was used to label cDNA with Cy3 or Cy5 for hybridization to 70-mer microarrays (http://genome.wustl.edu/activity/ma/cneoformans/).
RNA blot analysis was performed as described by Sambrook et al. with 5lg of total RNA from each strain [95]. Hybridization probes were designed for the genes from each serotype, and DNA fragments were amplified separately by PCR with the primers listed in Table S2. A Strip-EZ DNA kit (Ambion, Austin, Texas, United States) was used for probe labeling, and the membrane was exposed to a Phosphor Screen (Amersham Bioscience, Piscataway, New Jersey, United States) for 12 h and scanned using a Storm 860 Gel and Blot imaging system (Amersham).
Microarray hybridization, statistical analysis, and data mining.The following loop design, which consists of four nodes and paths including dye-swap, was adopted for this study: wild type (LIM) $
wild type (LIMþFe), wild type (LIM)$cir1D(LIM), wild type (LIMþ
Fe)$cir1D(LIMþFe), andcir1D(LIM)$cir1D(LIMþFe). A total of 24 arrays were used for the experiment. After hybridization, arrays were scanned immediately using the PerkinElmer ScanArray Express (PerkinElmer, Wellesley, California, United States). Each channel was background corrected by subtracting the lowest 10% of foreground signal intensity. The two channels of each array were normalized to each other by Huber’s variance stabilization algorithm,vsn[96]. A linear mixed effects model was applied to the normalized data in each channel. A fixed effect was included for each array, for the dye by gene interaction, and for each combination of iron availability and/or deletion of CIR1. Random effects were included for within-array variability (each gene appeared twice on each array), technical variability (each replicate culture was hybridized four times), and biological variability (12 replicate cultures were employed). The changes in wild type (LIM) versus wild type (LIMþFe), wild type (LIM) versuscir1D(LIM), wild type (LIMþFe) versuscir1D(LIMþFe), and
errors and p-values based on Student t statistics; q-values were computed to adjust for the false discovery rate.
The microarray data mining tool ermineJ was used to analyze the microarray dataset based on GO terms [39]. Theq-values from the microarray data were used as input scores and gene score resampling analysis (GSA) was applied. For clustering, genes with GO terms (cellular process) related to iron transport and homeostasis, and that were more than 2-fold differentially expressed in at least one experiment (with a statistically significant q-value less than 0.05), were extracted from the microarray data. The signal ratio of these genes was then log-transformed, clustered by Cluster 3.0 (average linkage) [97], and visualized by Java Tree View 1.0.12 [98].
Virulence assay. Thirty female A/Jcr mice (4 to 6 wk old) were obtained from Jackson Laboratories (Bar Harbor, Maine, United States). TheCr. neoformanscells for inoculation were grown in YPD medium overnight at 308C, washed twice with PBS, counted with a haemocytometer, and resuspended at 1.03106cells/ml in PBS. Mice were weighed and then anesthetized with ketamine and xylazine in saline. Mice were secured on a thread by their superior incisors, 50ll of the cell suspension (5.03104cells) was intranasally instilled, and
the mice were left on the thread for 10 min. The status of the mice was monitored twice per day post-inoculation. The protocol for the virulence assays (protocol A99–0252) conformed to regulatory standards and was approved by the University of British Columbia (UBC) Committee on Animal Care.
Supporting Information
Figure S1.Disruption of Wild TypeCIR1Was Confirmed by Southern Blot Analysis
Restriction maps of genomic regions containing a wild-type or a disruptedCIR1allele are shown. Genomic DNAs of serotype D and serotype A strains were digested with BamHI/HindIII and XhoI/ HindIII, respectively, and hybridized with the probes indicated. (A) Lane 1 represents serotype D wild-type strain B3501A. Lanes 2 and 3 represent thecir1 mutant strains B3CIR572 and B3CIR672, respectively.
(B) Lane 1 represents serotype A wild-type strain H99. Lanes 2 and 3 represent thecir1mutant strains H9CIR4 and H9CIR24, respectively.
Found at DOI: 10.1371/journal.pbio.0040410.sg001 (1.2 MB TIF).
Table S1.Strains and Primers Used in This Study
Found at DOI: 10.1371/journal.pbio.0040410.st001 (34 KB DOC).
Table S2.Primers Used for RNA Blot Analysis
Found at DOI: 10.1371/journal.pbio.0040410.st002 (27 KB DOC).
Accession Numbers
Cloned CIR1 cDNAs of Cr. neoformans serotype D (B3501A) and serotype A (H99) were sequenced, and the results were submitted to GenBank (http://www.ncbi.nlm.nih.gov/Genbank) under accession numbers DQ631833 and DQ631834, respectively. The microarray data was submitted to Gene Expression Omnibus (GEO; http://www. ncbi.nlm.nih.gov/geo/) under accession number GSE5341. TIGR gene identifiers were used throughout the text based on the format of the microarray annotation file. The corresponding GenBank identifiers can be found at the TIGR database: http://www.tigr.org/tdb/e2k1/cna1/.
Acknowledgments
We thank Colleen Nelson, Nadine Tomlinson, and Ann Haegert at the Prostate Centre at Vancouver General Hospital for advice and technical assistance with the microarray experiments. We also thank Paul Pavlidis at the UBC Bioinformatics Centre for help with the ermineJ analysis, and Mack Yuen of the Michael Smith Laboratories for help with submission of the microarray data.
Author contributions.WHJ and JWK conceived and designed the experiments. WHJ performed the experiments. WHJ and JWK analyzed the data. WHJ and JWK wrote the paper. AS performed the virulence assays. RW analyzed the microarray data.
Funding. This work was supported by the National Institute of Allergy and Infectious Disease (R01 AI053721) and by the Canadian Institutes of Health Research. JWK is a Burroughs Wellcome Fund Scholar in Molecular Pathogenic Mycology.
Competing interests.The authors have declared that no competing interests exist.
References
1. Weinberg ED (1999) Iron loading and disease surveillance. Emerg Infect Dis 5: 346–352.
2. Schaible UE, Kaufmann SH (2004) Iron and microbial infection. Nat Rev Microbiol 2: 946–953.
3. Mitchell TG, Perfect JR (1995) Cryptococcosis in the era of AIDS—100 years after the discovery ofCryptococcus neoformans. Clin Microbiol Rev 8: 515–548.
4. Kozel TR (1977) Non-encapsulated variant ofCryptococcus neoformans.II. Surface receptors for cryptococcal polysaccharide and their role in inhibition of phagocytosis by polysaccharide. Infect Immun 16: 99–106. 5. Chang YC, Penoyer LA, Kwon-Chung KJ (1996) The second capsule gene of
Cryptococcus neoformans,CAP64, is essential for virulence. Infect Immun 64: 1977–1983.
6. Kwon-Chung KJ, Rhodes JC (1986) Encapsulation and melanin formation as indicators of virulence inCryptococcus neoformans. Infect Immun 51: 218–223. 7. Chang YC, Kwon-Chung KJ (1998) Isolation of the third capsule-associated gene, CAP60, required for virulence in Cryptococcus neoformans. Infect Immun 66: 2230–2236.
8. Chang YC, Kwon-Chung KJ (1999) Isolation, characterization, and local-ization of a capsule-associated gene, CAP10, of Cryptococcus neoformans. J Bacteriol 181: 5636–5643.
9. Vartivarian SE, Anaissie EJ, Cowart RE, Sprigg HA, Tingler MJ, et al. (1993) Regulation of cryptococcal capsular polysaccharide by iron. J Infect Dis 167: 186–190.
10. Zaragoza O, Fries BC, Casadevall A (2003) Induction of capsule growth in
Cryptococcus neoformansby mammalian serum and CO(2). Infect Immun 71: 6155–6164.
11. Bose I, Reese AJ, Ory JJ, Janbon G, Doering TL (2003) A yeast under cover: The capsule ofCryptococcus neoformans. Eukaryot Cell 2: 655–663. 12. Janbon G (2004)Cryptococcus neoformanscapsule biosynthesis and regulation.
FEMS Yeast Res 4: 765–771.
13. Gomez BL, Nosanchuk JD (2003) Melanin and fungi. Curr Opin Infect Dis 16: 91–96.
14. Polacheck I, Hearing VJ, Kwon-Chung KJ (1982) Biochemical studies of phenoloxidase and utilization of catecholamines inCryptococcus neoformans. J Bacteriol 150: 1212–1220.
15. Salas SD, Bennett JE, Kwon-Chung KJ, Perfect JR, Williamson PR (1996) Effect of the laccase gene CNLAC1, on virulence ofCryptococcus neoformans. J Exp Med 184: 377–386.
16. Jacobson ES, Compton GM (1996) Discordant regulation of phenoloxidase and capsular polysaccharide inCryptococcus neoformans. J Med Vet Mycol 34: 289–291.
17. Fox DS, Cruz MC, Sia RA, Ke H, Cox GM, et al. (2001) Calcineurin regulatory subunit is essential for virulence and mediates interactions with FKBP12-FK506 inCryptococcus neoformans. Mol Microbiol 39: 835–849. 18. Cruz MC, Fox DS, Heitman J (2001) Calcineurin is required for hyphal
elongation during mating and haploid fruiting inCryptococcus neoformans. EMBO J 20: 1020–1032.
19. Odom A, Muir S, Lim E, Toffaletti DL, Perfect J, et al. (1997) Calcineurin is required for virulence ofCryptococcus neoformans. EMBO J 16: 2576–2589. 20. Kraus PR, Nichols CB, Heitman J (2005) Calcium- and
calcineurin-independent roles for calmodulin inCryptococcus neoformansmorphogenesis and high-temperature growth. Eukaryot Cell 4: 1079–1087.
21. Kosman DJ (2003) Molecular mechanisms of iron uptake in fungi. Mol Microbiol 47: 1185–1197.
22. Yamaguchi-Iwai Y, Dancis A, Klausner RD (1995) AFT1: A mediator of iron regulated transcriptional control inSaccharomyces cerevisiae. EMBO J 14: 1231–1239.
23. Blaiseau PL, Lesuisse E, Camadro JM (2001) Aft2p, a novel iron-regulated transcription activator that modulates, with Aft1p, intracellular iron use and resistance to oxidative stress in yeast. J Biol Chem 276: 34221–34226. 24. Haas H (2003) Molecular genetics of fungal siderophore biosynthesis and uptake: The role of siderophores in iron uptake and storage. Appl Microbiol Biotechnol 62: 316–330.
25. An Z, Mei B, Yuan WM, Leong SA (1997) The distal GATA sequences of the sid1 promoter ofUstilago maydismediate iron repression of siderophore production and interact directly with Urbs1, a GATA family transcription factor. EMBO J 16: 1742–1750.
26. Pelletier B, Beaudoin J, Mukai Y, Labbe S (2002) Fep1, an iron sensor regulating iron transporter gene expression inSchizosaccharomyces pombe. J Biol Chem 277: 22950–22958.
27. Pelletier B, Beaudoin J, Philpott CC, Labbe S (2003) Fep1 represses expression of the fission yeastSchizosaccharomyces pombesiderophore-iron transport system. Nucleic Acids Res 31: 4332–4344.
28. Jacobson ES, Goodner AP, Nyhus KJ (1998) Ferrous iron uptake in
Cryptococcus neoformans. Infect Immun 66: 4169–4175.
29. Nyhus KJ, Wilborn AT, Jacobson ES (1997) Ferric iron reduction by
Cryptococcus neoformans. Infect Immun 65: 434–438.