ACPD
13, 24635–24674, 2013A case study into the measurement of ship
emissions
C. D. Cappa et al.
Title Page
Abstract Introduction
Conclusions References
Tables Figures
◭ ◮
◭ ◮
Back Close
Full Screen / Esc
Printer-friendly Version Interactive Discussion
Discussion
P
a
per
|
D
iscussion
P
a
per
|
Discussion
P
a
per
|
Discuss
ion
P
a
per
|
Atmos. Chem. Phys. Discuss., 13, 24635–24674, 2013 www.atmos-chem-phys-discuss.net/13/24635/2013/ doi:10.5194/acpd-13-24635-2013
© Author(s) 2013. CC Attribution 3.0 License.
Atmospheric Chemistry and Physics
Open Access
Discussions
Geoscientific Geoscientific
Geoscientific Geoscientific
This discussion paper is/has been under review for the journal Atmospheric Chemistry and Physics (ACP). Please refer to the corresponding final paper in ACP if available.
A case study into the measurement of
ship emissions from plume intercepts of
the NOAA Ship
Miller Freeman
C. D. Cappa1, E. J. Williams2,3, D. A. Lack2,3, G. M. Buffaloe1, D. Coffman7, K. L. Hayden5, S. C. Herndon4, B. M. Lerner2,3, S-M. Li5, P. Massoli4,
R. McLaren6, I. Nuaaman5,6, T. B. Onasch4, and P. K. Quinn7
1
Department of Civil and Environmental Engineering, University of California, Davis, California 95616, USA
2
NOAA Earth System Research Laboratory, Boulder, CO, 80305, USA
3
Cooperative Institute for Research in Environmental Sciences, University of Colorado, Boulder, Colorado, 80305, USA
4
Aerodyne Research, Inc., Billerica, Massachusetts, 01821, USA
5
Air Quality Research Division, Environment Canada, 4905 Dufferin St., Toronto, M3H5T4, Canada
6
Centre for Atmospheric Chemistry, York University, 4700 Keele St., Toronto, M3J1P3, Canada
7
ACPD
13, 24635–24674, 2013A case study into the measurement of ship
emissions
C. D. Cappa et al.
Title Page
Abstract Introduction
Conclusions References
Tables Figures
◭ ◮
◭ ◮
Back Close
Full Screen / Esc
Printer-friendly Version Interactive Discussion
Discussion
P
a
per
|
D
iscussion
P
a
per
|
Discussion
P
a
per
|
Discuss
ion
P
a
per
|
Received: 15 August 2013 – Accepted: 31 August 2013 – Published: 23 September 2013
Correspondence to: C. D. Cappa ([email protected])
ACPD
13, 24635–24674, 2013A case study into the measurement of ship
emissions
C. D. Cappa et al.
Title Page
Abstract Introduction
Conclusions References
Tables Figures
◭ ◮
◭ ◮
Back Close
Full Screen / Esc
Printer-friendly Version Interactive Discussion
Discussion
P
a
per
|
D
iscussion
P
a
per
|
Discussion
P
a
per
|
Discuss
ion
P
a
per
|
Abstract
Emissions factors (EFs) for gas and sub-micron particle-phase species were measured in intercepted plumes as a function of vessel speed from an underway research vessel,
the NOAA ShipMiller Freeman, operating a medium-speed diesel engine on low-sulfur
marine gas oil. For many of the particle-phase species, EFs were determined using
5
multiple measurement methodologies, allowing for an assessment of how well EFs
from different techniques agree. The total sub-micron PM (PM1) was dominated by
particulate black carbon (BC) and particulate organic matter (POM), with an average POM / BC ratio of 1.3. Consideration of the POM / BC ratios observed here with liter-ature studies suggests that laboratory and in-stack measurement methods may
over-10
estimate primary POM EFs relative to those observed in emitted plumes. Comparison
of four different methods for black carbon measurement indicates that careful attention
must be paid to instrument limitations and biases when assessing EFBC. Particulate
sulfate (SO24−) EFs were extremely small and the particles emitted by Miller Freeman
were inefficient as cloud condensation nuclei (CCN), even at high super saturations,
15
consistent with the use of very low sulfur fuel and the overall small emitted particle sizes. All measurement methodologies consistently demonstrate that the measured
EFs (fuel mass basis) for PM1mass, BC and POM decreased as the ship slowed.
Par-ticle number EFs were approximately constant across the speed change, with a shift towards smaller particles being emitted at slower speeds. Emissions factors for
gas-20
phase CO and formaldehyde (HCHO) both increased as the vessel slowed, while EFs
for NOxdecreased and SO2EFs were approximately constant.
1 Introduction
Emissions of particulate matter (PM) and trace gases from ships operating in the open ocean as well as in coastal and inland waterway areas have significant impacts on air
25
ACPD
13, 24635–24674, 2013A case study into the measurement of ship
emissions
C. D. Cappa et al.
Title Page
Abstract Introduction
Conclusions References
Tables Figures
◭ ◮
◭ ◮
Back Close
Full Screen / Esc
Printer-friendly Version Interactive Discussion
Discussion
P
a
per
|
D
iscussion
P
a
per
|
Discussion
P
a
per
|
Discuss
ion
P
a
per
|
these impacts requires use of detailed emissions inventories and the specification of emission factors (EFs) to determine the spatial distribution of emissions. Emission fac-tors for ships are commonly determined from (i) direct stack sampling of in-use ships, (ii) interception of emitted plumes from in use ships or (iii) from test engines in
labo-ratories. Various studies indicate that EFs for total PM and different PM species can
5
be highly variable between different ships. This variability reflects real differences in
ship operation and the resulting emissions, but may also reflect differences between
the measurement or sampling methodologies employed between different studies.
De-tailed characterization of the emissions from a single ship using multiple measurement techniques for a given species can facilitate understanding of the role that
methodolog-10
ical differences play in determining measured EFs.
In addition, changes in engine load, which often correspond to changes in vessel speed, are known (Lloyd’s Register Engineering Services, 1995) to have a large
in-fluence on the overall efficiency of the combustion process, with fuel economy (Fecon;
e.g. km kg-fuel−1) often increasing with decreasing speed and engine load. This
in-15
crease in fuel efficiency generally translates to a decrease in emissions for a given
pollutant, however the magnitude of the change is modified by the specific response of the emission factor for that pollutant to the change in speed (Lack et al., 2011). Such
efficiency gains have motivated consideration and implementation of speed restrictions
(or a fuel tax aimed at speed reduction) near some coastal and port regions or along
20
shipping routes (Corbett et al., 2009; Buhaug et al., 2009). Most such efforts are aimed
at decreasing emissions from large ocean going vessels. However, the operation of smaller crafts near coastal regions and inland waterways also contributes to local pol-lution (Corbett and Fischbeck, 2000), and thus the dependence of their emissions on vessel speed must also be understood so that appropriate pollution control strategies
25
ACPD
13, 24635–24674, 2013A case study into the measurement of ship
emissions
C. D. Cappa et al.
Title Page
Abstract Introduction
Conclusions References
Tables Figures
◭ ◮
◭ ◮
Back Close
Full Screen / Esc
Printer-friendly Version Interactive Discussion
Discussion
P
a
per
|
D
iscussion
P
a
per
|
Discussion
P
a
per
|
Discuss
ion
P
a
per
|
and thus it is necessary to characterize emissions factors and their speed dependence for both newer and older vessels. Development of next-generation emissions inven-tories will result from such higher resolution assessments of the dependence of and variations in engine load distributions, fleet age and emission factor with engine load, engine age and vessel speed (Wang and Minjares, 2013).
5
Here, we report measurements of both PM and gas-phase EF values for a series of
plumes emitted by the NOAA ShipMiller Freeman, which was in transit within regulated
waters offthe coast of Santa Barbara, CA and intercepted during the 2010 CalNex field
campaign (Ryerson et al., 2013). Regulated waters correspond to the region within 24 nautical miles of the CA baseline where, as of 1 July 2009, ocean going vessels were
10
required to utilize fuels with≤1.5 % sulfur (California Air Resources Board, 2011). (The
fuel sulfur requirement has since been reduced to≤1 %, as of August 2012 and will
fur-ther decrease to≤0.1 % in 2014.) The PM measurements were made using a suite of
different measurement techniques, some of which overlap in terms of the specific PM
species measured. In addition, the intercepted plumes were emitted while theMiller
15
Freemanoperated at 4 different but constant speeds, and thus enables an assessment
of the influence of vessel speed on the emissions from vessels of this type. TheMiller
Freemanis a 65.5 m (215 ft) fisheries and oceanographic research vessel with a
cruis-ing speed of 11 knots, runncruis-ing a scruis-ingle 1.64 MW geared medium-speed diesel (MSD) main engine from General Electric with a rated power of 2.2 khp and with a controllable
20
pitch propeller (NOAA, 2010). TheMiller Freemanis an older vessel, launched in 1967,
that was decommissioned in 2013. During the plume intercepts theMiller Freemanwas
operating on a mix of, “ultra-low sulfur diesel from California mixed with standard
ma-rine diesel from Washington [state]” (Field Operations Officer, personal communication,
2010.). Fuel samples were not available for off-line analyses, but as we show later the
25
ACPD
13, 24635–24674, 2013A case study into the measurement of ship
emissions
C. D. Cappa et al.
Title Page
Abstract Introduction
Conclusions References
Tables Figures
◭ ◮
◭ ◮
Back Close
Full Screen / Esc
Printer-friendly Version Interactive Discussion
Discussion
P
a
per
|
D
iscussion
P
a
per
|
Discussion
P
a
per
|
Discuss
ion
P
a
per
|
The measurements reported here therefore provide a case study allowing for
as-sessment of how well different measurement techniques agree in terms of the derived
EFs and for the influence of vessel speed on older, smaller MSD vessels operating on LSF, which are an important class of vessels that operate in near-coastal and in-land waterways. For example, plumes were encountered for a number of other MSD
5
vessels with build years ranging from 1952 to 2006 during CalNex, with most of these being pre-1990 vessels. This is generally consistent with the average age (as of 2010) of “other” vessels (i.e. exclusive of container, bulk, cargo and tanker vessels) in the world merchant fleet being 25 yr (United Nations Conference on Trade and
Develop-ment, 2011) and with 43 % of such vessels (i.e. passenger, offshore, service and tugs)
10
in 2011 being older than 25 yr (Equasis, 2012). Further, larger ocean going vessels are increasingly having to switch to LSFs from the commonly used high-sulfur heavy fuel oil (HFO, or bunker fuel) during operation near coasts (US EPA, 2010; Califor-nia Air Resources Board, 2011). (Although there were plumes from many other ships intercepted during CalNex, not all instruments were operating at all times under
con-15
ditions that allow for determination of EFs, and thus we restrict this study to the ship for which the most comprehensive measurements are available.) The results here are compared with literature results from test rig, in-stack and plume studies to place them in the broader context that is necessary for development of next-generation emissions inventories.
20
2 Experimental
Emissions factors for PM and trace gases (CO, SO2, HCHO and NOx) were
mea-sured using the plume intercept method (also known as the “sniffer” method), wherein
concentrations of the pollutants are measured in a plume that is intercepted
down-wind of the vessel of interest, here the Miller Freeman. One benefit of the plume
in-25
ACPD
13, 24635–24674, 2013A case study into the measurement of ship
emissions
C. D. Cappa et al.
Title Page
Abstract Introduction
Conclusions References
Tables Figures
◭ ◮
◭ ◮
Back Close
Full Screen / Esc
Printer-friendly Version Interactive Discussion
Discussion
P
a
per
|
D
iscussion
P
a
per
|
Discussion
P
a
per
|
Discuss
ion
P
a
per
|
for each plume and the plume must be identifiable above background concentrations. Gas-phase and PM measurements were made onboard the NOAA-sponsored Woods
Hole R/V Atlantis as part of the CalNex field campaign (Ryerson et al., 2013). The
emissions plume fromMiller Freemanwas intercepted on five occasions on May 19,
2010, withMiller Freemantraveling at four different speeds: 2.9 knots, 6.9 knots (twice),
5
10.2 knots and 12 knots. The coordinated effort between the ships allowed for
mea-surements to be made in plumes that were emitted whenMiller Freemanwas traveling
at a constant speed. Plumes fromMiller Freemanwere identified by combining the
rel-ative ship positions with the local wind direction and wind speed data measured from
Atlantis. Using these data, local back trajectories fromAtlantiswere computed by
sim-10
ple vector analysis to determine the location of and speed at whichMiller Freemanwas
cruising at the time the pollutants were emitted and to estimate the age of each plume encountered. Separation distances between the ships were from 200 to 900 meters;
plume travel times were from 1 to 5 min (Table 1). Engine load (Fload) information is not
directly available from theMiller Freeman. For marine vessels engine load is often
es-15
timated from the vessel speed (u) using a cubic power law relationship (the so-called
propeller law), where Fload= (uactual/umax)
3
(Corbett et al., 2009). However, because
theMiller Freemanoperated a controllable pitch propeller, as opposed to a fixed pitch
propeller, the power law is likely not appropriate. Nonetheless, estimated engine load values from the propeller law are reported here for reference. We assume that the
20
maximum speed encountered here, 12 knots, corresponds toumax; theFloadvalues are
then 1.4 %, 19 %, 61 % and 100 %, respectively. This lowestFload value is lower than
typical values under idling conditions, indicating a likely failure of the propeller law for this vessel. The encounter occurred during late afternoon when the temperature was
between 11.9◦C and 12.2◦C and the relative humidity was between 88 % and 93 %
25
(although particles were dried before sampling).
Gas-phase measurements included CO2, NOx, CO, SO2and HCHO with
uncertain-ties of±0.25 ppmv,±20 %,±4.1 % and±15 % and±9 % (Williams et al., 2009).
ACPD
13, 24635–24674, 2013A case study into the measurement of ship
emissions
C. D. Cappa et al.
Title Page
Abstract Introduction
Conclusions References
Tables Figures
◭ ◮
◭ ◮
Back Close
Full Screen / Esc
Printer-friendly Version Interactive Discussion
Discussion
P
a
per
|
D
iscussion
P
a
per
|
Discussion
P
a
per
|
Discuss
ion
P
a
per
|
mass spectrometer (HR-AMS) for measurement of particulate SO24−, NO−3, NH+4, Cl−
and OM (Canagaratna et al., 2007), a Droplet Measurement Technologies single par-ticle soot photometer (SP2) for refractory BC (rBC) parpar-ticle mass and number con-centrations and size distributions (Schwarz et al., 2006), an Aerodyne Soot-Particle
AMS (SP-AMS) for refractory BC particle mass and OM and SO24−, NO−3, NH+4 and Cl−
5
rBC coating mass concentrations (Onasch et al., 2012), TSI 3025A (CN > 3 nm) and 3010 (CN > 12 nm) condensation particle counters for particle number concentrations, a cloud condensation nuclei (CCN) counter (DMT, Inc.) (Roberts and Nenes, 2005), a photo-acoustic spectrometer (PAS, operating at 532 nm and 405 nm) for light ab-sorption (Lack et al., 2012), one three-wavelength particle soot abab-sorption photometer
10
(PSAP, at 450, 530 and 700 nm) for light absorption (Virkkula et al., 2005), a cavity ring-down spectrometer (CRD, at 532 nm) for light extinction and optical hygroscopicity mea-surements (Langridge et al., 2011) and a scanning mobility particle sizer (SMPS, TSI, Inc.) for particle size distribution measurement operating with a scan time of 2.5 min
. For the HR-AMS, a collection efficiency (CE) of 1.0 has been assumed; this means
15
that the EFs determined from this instrument are lower limits. While the CE for HR-AMS
is mostly caused by particle bounce on the vaporizer (Huffman et al., 2005; Matthew
et al., 2008), the CE in the SP-AMS is primarily a function of the degree of overlap between the particle and laser beams and the laser power profile in the overlapping
region (Onasch et al., 2012). For the SP-AMS, a CE for BC of 0.2±40 % is used while
20
a CE=0.4±100 % is used for non-BC components that are internally mixed with BC
(see Supplement). Note that the precision of the measusred BC and non-BC species concentrations is substantially better than the above uncertainties indicate, which ac-count for measurement accuracy. The SP2 was calibrated using fullerene soot parti-cles, which have been shown to give a similar response as diesel soot (Laborde et al.,
25
2012). The SP2 measured particles with volume equivalent diameters (dp,VED) between
60 nm and 300 nm. The SP2 rBC concentrations were corrected for the measured
par-ticle detection efficiency of 0.7 for particles with dp,VED> 100 nm. Fordp,VED≤100 nm,
ACPD
13, 24635–24674, 2013A case study into the measurement of ship
emissions
C. D. Cappa et al.
Title Page
Abstract Introduction
Conclusions References
Tables Figures
◭ ◮
◭ ◮
Back Close
Full Screen / Esc
Printer-friendly Version Interactive Discussion
Discussion
P
a
per
|
D
iscussion
P
a
per
|
Discussion
P
a
per
|
Discuss
ion
P
a
per
|
in instrument sensitivity (see Supplement; Schwarz et al., 2010; Liggio et al., 2012). Overall uncertainties for the particle measurement instrumentation are estimated to
be+35 %/−15 % (HR-AMS),+100/−20 % (SP2),±40 % (SP-AMS, BC),±100 %
(SP-AMS; non-BC),±5 % (CN),±10 % (CCN),±7 % (PAS, 532 nm),±15 % (PAS, 405 nm),
±20 % (PSAP) and ±1 % (CRD), when signals are well above their detection limits.
5
Plume-specific detection limits, given as DL=3σ/√N, were assessed, whereσis the
standard deviation observed during the background periods just before/after the plume
andNis the number of data points across an individual plume. Typical values ofNwere
around 70 points per plume, except for CCN (see Supplement). Absolute EF values are only reported when the in-plume signals were above the detection limit.
10
Particle-phase EFs were determined using an area-ratio approach, where the background-subtracted area under the ship plume (i.e. plotted as concentration vs. time) for the pollutant of interest is divided by the similarly-calculated area under the
CO2plume. The ratio gives the EF after appropriate unit conversion and multiplication
by the mass fraction of carbon in the fuel, which was assumed to be 0.865 (Lack et al.,
15
2009; Williams et al., 2009). Specifically,
EFX= AX,bgd
ACO2,bgd
·ffuel (1)
whereAX,bgdis the background-subtracted concentration of species X, integrated over
the entire plume,ACO2, bgd is the same for CO2 and ffuel is the conversion factor
be-tween CO2 (in ppmv) and fuel consumed (kg-fuel). The area-ratio approach is
inde-20
pendent of the time-resolution of the instrumentation (which differs between different
instruments) and has been used in other studies for calculating emission ratios of ship emissions (McLaren et al., 2012). Importantly, in the plume intercept method dilution
is naturally accounted for because the pollutant of interest is ratioed to CO2
concen-trations, and CO2 is non-reactive within the plume. Gas-phase EFs were determined
25
ACPD
13, 24635–24674, 2013A case study into the measurement of ship
emissions
C. D. Cappa et al.
Title Page
Abstract Introduction
Conclusions References
Tables Figures
◭ ◮
◭ ◮
Back Close
Full Screen / Esc
Printer-friendly Version Interactive Discussion
Discussion
P
a
per
|
D
iscussion
P
a
per
|
Discussion
P
a
per
|
Discuss
ion
P
a
per
|
results (Williams et al., 2009). Although fuel carbon is also emitted as CO, combustion
related hydrocarbons and particulate carbon, the majority of carbon is emitted as CO2
(> 99 %, based on the derived EFs), and thus the determination of the various EFs
us-ing only CO2will lead to negligible biases. Given our method of determination, the EFs
reported are related to the mass of fuel consumed, with units of emissions of X per kg
5
of fuel (where emissions of X can be in grams, particles, etc.).
Conversion of the optical property measurements to mass EFs requires specification
of the mass absorption or mass extinction efficiency (MAE or MEE). Specifically,
divi-sion of the measured extinction coefficient by the MEE yields the mass concentration of
PM1, while division of the measured absorption coefficient by the MAE yields the mass
10
concentration of equivalent black carbon (eBC; Petzold et al., 2013). Here, we use
MAE = 10.2 m2g−1 (405 nm), 9.2 m2g−1 (450 nm), 7.75 m2g−1 (532 nm), 7.5 m2g−1
(550 nm) and 5.9 m2g−1 (700 nm), and MEE = 4 m2g−1 (532 nm). The MAE values
were specified based on that reported by Bond and Bergstrom (2006) at 550 nm and
extrapolated to other wavelengths assuming a 1/λdependence. The MEE values are
15
from Hand and Malm (2007). The uncertainty in the conversion for MAE is ∼ ±15 %,
while for MEE it is estimated as at least±30 % based on the difference in the MEE
be-tween different particle components. Final uncertainties in the EFs were determined for
each encounter for each instrument as the larger of the instrument uncertainty or the propagated standard deviation measured during the background (non-plume) period
20
ACPD
13, 24635–24674, 2013A case study into the measurement of ship
emissions
C. D. Cappa et al.
Title Page
Abstract Introduction
Conclusions References
Tables Figures
◭ ◮
◭ ◮
Back Close
Full Screen / Esc
Printer-friendly Version Interactive Discussion
Discussion
P
a
per
|
D
iscussion
P
a
per
|
Discussion
P
a
per
|
Discuss
ion
P
a
per
|
3 Results and discussion
3.1 Particle phase emissions
3.1.1 Mass emission factors
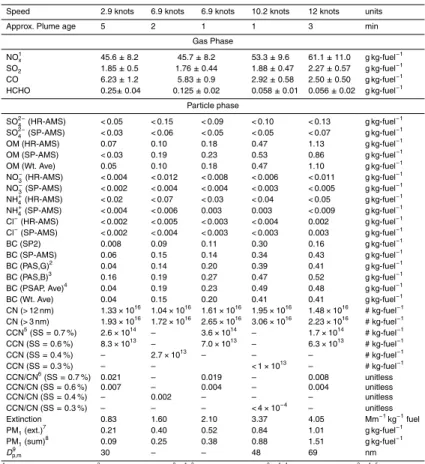
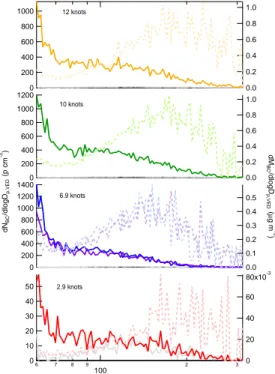
Emissions factors determined for all PM species that were measured are reported in Table 1 and shown in Fig. 1. The results are provided for each of the 5 plumes that
5
were intercepted, which correspond to different vessel speeds at time of emission.
The EF for PM1 mass was determined either as the uncertainty-weighted sum of the
chemically-specific measurements that were above detection limits (i.e. EFPM
1,Sum =
EFBC + EFPOM, where EFSO4 has been excluded because it is below the detection
limit for all intercepts) or from the measurement of total light extinction (EFPM1,Ext).
10
Overall, the two methodologies agree within uncertainties for each intercept, although
for the three slowest speed intercepts the EFPM1,Sum< EFPM1,Ext with the opposite true
for the two highest speed intercepts. This may reflect speed-dependent variations in the POM / BC ratio (discussed further below), which can influence the MEE used to convert
light extinction to PM1mass. On average, the two methods agreed to within 18 %. It is
15
also evident that the EFPM1 increases substantially with vessel speed (Fig. 1).
The EFPM
1 is dominated by contributions from POM and BC, with all other measured
species, in particular SO24−, contributing negligibly (Fig. 1). The EF for POM was
deter-mined from two independent instruments, the HR-AMS and the SP-AMS. Both methods
determine POM concentrations via mass spectrometry, but they differ in their specific
20
operation and, importantly, the SP-AMS as operated during CalNex was only sensitive to POM that existed in BC-containing particles while the HR-AMS measures POM in all particles. The two methods are highly consistent in their general dependence on
ves-sel speed (Fig. 1), and the measured EFPOM values agreed on average to within 16 %
despite the substantial uncertainty on the SP-AMS EFPOM. This consistency in
behav-25
av-ACPD
13, 24635–24674, 2013A case study into the measurement of ship
emissions
C. D. Cappa et al.
Title Page
Abstract Introduction
Conclusions References
Tables Figures
◭ ◮
◭ ◮
Back Close
Full Screen / Esc
Printer-friendly Version Interactive Discussion
Discussion
P
a
per
|
D
iscussion
P
a
per
|
Discussion
P
a
per
|
Discuss
ion
P
a
per
|
erage EFPOM (0.39±0.44 g kg−
1
fuel) across all engine speeds is somewhat less than
the multi-ship MSD average (0.65±0.44 g kg−1fuel) from Lack et al. (2009), although
it is important to note that nearly all of the MSD vessels sampled by Lack et al. were
tug boats, which likely have a different emissions profile than a research vessel such
as theMiller Freeman. As with the EFPM
1, the EFPOM increases with vessel speed.
5
The EFBC was determined using four independent methods, two that measured
equivalent BC (eBC) by light absorption measurement (PAS and PSAP), one that mea-sured the laser induced incandescence by rBC-containing particles (SP2) and one that measured the rBC concentration via mass spectrometry (SP-AMS) (Petzold et al.,
2013). There is good agreement in the EFBCvalues determined between the two
ab-10
sorption based methods and the SP-AMS, while the SP2 gave systematically lower
values. The good agreement of the PAS and PSAP derived EFBCvalues indicates that
positive biases that can be associated with PSAP measurements (Cappa et al., 2008; Lack et al., 2008a) are not significant for the plume particles, most likely because of
the relatively large BC content. That the SP2-derived EFBCis systematically lower than
15
that determined using the other methods suggests that a substantial fraction of the
BC mass exists in particles with volume equivalent diametersdp,VED< 60 nm. This is
addressed further in Sect. 3.1.4. This suggests that the SP2 may not be suitable for
accurate determination of EFBCfor fresh ship emissions, although can provide a lower
limit. The weighted average EFBC (0.23 ±0.15 g kg−1 fuel) across all engine speeds
20
forMiller Freemanis on the low end of the multi-ship average (0.97±0.66 g kg−1fuel)
determined by Lack et al. (2009) for vessels operating MSD engines. Again, this
dif-ference may reflect the difference between theMiller Freemanand the predominately
tug boats sampled by Lack et al. (2009). As with the EFPOM, the EFBCare observed to
increase with vessel speed, although somewhat less steeply.
25
The EFSO
4measurements from the HR-AMS and SP-AMS were below the detection
limit at all speeds, and indicate that the SO4 contribution to the total particle mass is
small, consistent with the use of low sulfur fuel. EFSO4 can also be estimated from
the measured EFSO
ACPD
13, 24635–24674, 2013A case study into the measurement of ship
emissions
C. D. Cappa et al.
Title Page
Abstract Introduction
Conclusions References
Tables Figures
◭ ◮
◭ ◮
Back Close
Full Screen / Esc
Printer-friendly Version Interactive Discussion
Discussion
P
a
per
|
D
iscussion
P
a
per
|
Discussion
P
a
per
|
Discuss
ion
P
a
per
|
conversion of SO2 to p-SO4 in ship plumes from MSD vessels on the timescales
con-sidered here (a few minutes) is∼1–2 % (Lack et al., 2009). This yields EFSO4=0.02–
0.04 g kg−1fuel, consistent with the directly measured EFSO4 being below the
plume-specific detection limits of the HR-AMS and SP-AMS (Table 1). As with p-SO24−, EFs
for particulate NO−3, NH+4 and Cl− were at or below the detection limits.
5
3.1.2 The POM / BC ratio
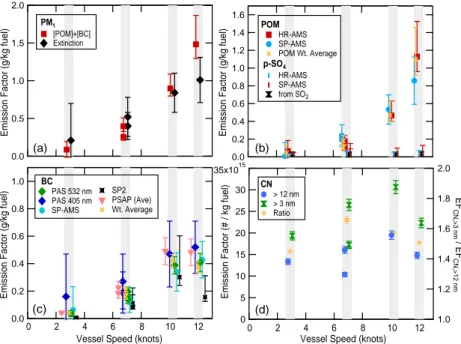
The average particle composition calculated from the weighted average EFPOM and
EFBC, assuming only BC and POM contribute significantly to PM, is 53(±14) % POM
and 47(±14) % BC, or POM / BC = 1.34 (±0.9) (Fig. 2). The uncertainty on the 2.9
knot plume is large. If this plume is excluded, the fraction of the PM1 mass that is
10
POM is observed to increase slightly as vessel speed increases, with POM / BC rang-ing from 0.6 (6.9 knots) to 3.0 (12 knots), with an average of 1.41. This is a result of
the EFBCincreasing less steeply with ship speed than EFPOM (Fig. 1); this may be due
to increased oil consumption at higher speeds. The average and range of POM/BC ob-served here are consistent with both the low-sulfur and the all-vessels plume intercepts
15
results from Lack et al. (2009) (POM / BC=0.8 and 1.48, respectively), the plume
in-tercepts results from Lack et al. (2011) for theMargrethe Maersk(POM / BC=1.3–2.6)
and with two of the in-stack measurements: Jayaram et al. (2011) (POC / EC=0.7–1.4)
and Kasper et al. (2007) (POC / EC∼0.7–3). (We assume that POM / BC and POC / EC
are sufficiently similar in magnitude such that they can be compared. Consider that the
20
POM / POC ratio for ship emissions was measured to be∼1.2 (Murphy et al., 2009).)
The POM / BC ratio observed here (and in the above cited studies) is, however, sub-stantially smaller than all other in stack or test rig studies, including results reported by
Petzold and co-workers for a test rig MSD operating on MGO (POM / EC=3.6–8.7 and
POM / BC=6.9–77) (Petzold et al., 2011a) or heavy fuel oil (HFO) (POM / EC=3.8–
25
8.8 and POM / BC=5.2–28) (Petzold et al., 2010), by Khan and co-workers for a slow
ACPD
13, 24635–24674, 2013A case study into the measurement of ship
emissions
C. D. Cappa et al.
Title Page
Abstract Introduction
Conclusions References
Tables Figures
◭ ◮
◭ ◮
Back Close
Full Screen / Esc
Printer-friendly Version Interactive Discussion
Discussion
P
a
per
|
D
iscussion
P
a
per
|
Discussion
P
a
per
|
Discuss
ion
P
a
per
|
3–15) (Khan et al., 2012b) vessel operating on MGO, by Agrawal and co-workers for a
few SSD vessels operating on HFO (POC / EC=8–33) (Agrawal et al., 2008a,b, 2010)
or an auxiliary engine operating on MGO (POC / EC=3–10) (Agrawal et al., 2008b).
Murphy et al. (2009) report EFs from a single SSD vessel operating on HFO using both in stack and plume intercept methods and find values larger than those observed here,
5
although with the in stack POC / EC (=25) nearly twice as large as the plume intercept
POM / BC (=13).
Plume intercept studies (this work; Lack et al., 2009, 2011; Murphy et al., 2009) measure the POM / BC ratio for emitted particles at atmospherically relevant dilutions while studies that utilize test-rigs or that sample directly from the ship stack will sample
10
at varying dilution factors that depend on the exact methodology employed. Thus, one
possible reason for the difference between our results and some of the literature could
be that the results depend on the methodology used, with ambient methods (i.e. plume sampling) typically giving lower POM / BC than direct sampling (e.g. in stack) measure-ment methods, likely due to the relatively rapid dilution experienced by a plume a few
15
minutes downwind of emissions (Petzold et al., 2008) and consequent evaporation of semi-volatile POM species. Evaporation of POM may be greater in plume intercept studies compared with direct sampling, depending on the level of dilution used during sampling and the resultant POM concentrations. This suggestion is consistent with ob-servations that have shown the dilution ratio used during sampling from diesel engines
20
can have a profound influence on the amount of organic carbon measured and the POC / EC ratio (Lipsky and Robinson, 2006; Fujitani et al., 2012). Consider also that Murphy et al. (2009) found the POM / BC from plume intercepts to be about half that of the POC / EC measured via in stack sampling for emissions from the same vessel.
Given that EFBC is independent of dilution (since BC is non-volatile) while EFOM can
25
be highly sensitive to dilution, our results, combined with literature results (e.g. Lack et al. (2009, 2011) and Murphy et al., 2009), indicate a potential for laboratory test rig and stack sampling methods to overestimate POM emission factors from ships and
ACPD
13, 24635–24674, 2013A case study into the measurement of ship
emissions
C. D. Cappa et al.
Title Page
Abstract Introduction
Conclusions References
Tables Figures
◭ ◮
◭ ◮
Back Close
Full Screen / Esc
Printer-friendly Version Interactive Discussion
Discussion
P
a
per
|
D
iscussion
P
a
per
|
Discussion
P
a
per
|
Discuss
ion
P
a
per
|
the Jayaram et al. (2011) stack-sampling and Kasper et al. (2007) test rig studies give
a similarly low POC / EC ratio.) Alternatively, it is possible that the difference between
our LSF results and the literature studies that used HFO could result from typically greater use of lubricating oil with HFO, which could translate to greater emissions of POM. However, this does not seem likely because the ensemble results from Lack et
5
al. (2009), which include vessels with a variety of ages and types, suggest relatively
small differences in the POM / BC ratio between ships operating on LSFs vs. HFO or
between different engine types.
We note that this discussion is limited to primary POM emissions; the loss of POM due to evaporation leads to the production of gas-phase organic matter, which can
10
photochemically react in the atmosphere on timescales longer than the plume transit times encountered here to produce secondary POM. Thus, it may be that POM is only temporarily lost, although the likelihood of re-condensation is dependent upon a variety of parameters, such as the concentration of gas-phase oxidants, temperature, relative humidity, dilution, etc. In addition to evaporation considerations, there may be
15
substantial differences (and large uncertainties) in the BC and EC measurements made
using different techniques (Petzold et al., 2011b) that can also contribute to differences
in reported POM / BC.
3.1.3 Particle number and size
Observed particle number concentration EFs (EFCN) for theMiller Freemanvaried from
20
1–3×10¹⁶ particles kg−1 fuel (Table 1). The average EFCN for all particles with
diam-eters > 3 nm were larger than for all particles with diamdiam-eters > 12 nm (2.3(±0.5)×1016
vs. 1.5(±0.3)×1016 particles kg−1fuel, respectively). The EFCNexhibited no particular
dependence on vessel speed, both for EFCN,>3 nmand EFCN,>12 nm(Fig. 1).
It was possible to determine mobility diameter size distributions associated with the
25
ACPD
13, 24635–24674, 2013A case study into the measurement of ship
emissions
C. D. Cappa et al.
Title Page
Abstract Introduction
Conclusions References
Tables Figures
◭ ◮
◭ ◮
Back Close
Full Screen / Esc
Printer-friendly Version Interactive Discussion
Discussion
P
a
per
|
D
iscussion
P
a
per
|
Discussion
P
a
per
|
Discuss
ion
P
a
per
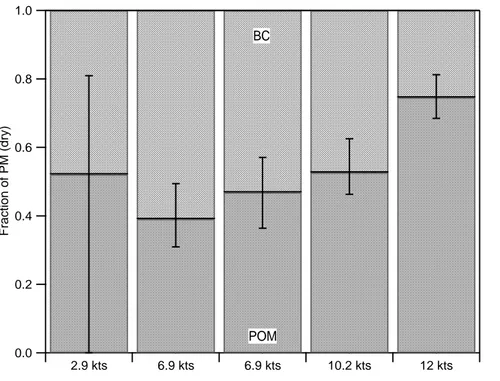
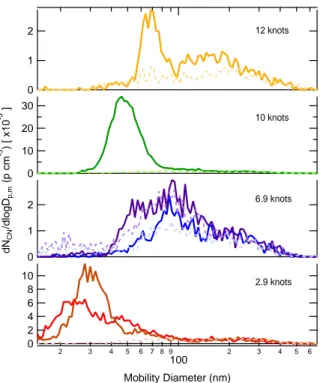
|
the narrowness of the plumes in time and the relative timing and long scan time of the SMPS, the plume-specific size distribution could not be resolved from the background
(Fig. 3). The median number-weighted mobility diameter (dp,m) measured did exhibit
some dependence on vessel speed, increasing from∼30 nm at 2.9 knots, to 48 nm at
10 knots, to 69 nm at 12 knots. This observation is consistent with the observation that
5
EFPM1 increased with vessel speed while EFCNwas speed independent (Fig. 1).
In addition to mobility size distributions, the SP2 was used to determine volume equivalent diameter number and mass-weighted size distributions for the rBC
compo-nent of the particles from 60 nm <dp,VED< 300 nm (the detection limits of this SP2). For
non-spherical, fractal-like particlesdp,VED<dp,m(DeCarlo et al., 2004). The SP2
mea-10
sures rBC size distributions with much higher time resolution than the SMPS making it possible to determine unique plume-specific size distributions for each intercept. The
rBC number-weighted size distributions for the different plumes (Fig. 4) indicate that
there is one mode that peaks atdp,VED ∼100 nm and a second, much higher
concen-tration mode that maximizes at some diameter < 60 nm. (It is important to note that
15
the exact shape of the distributions below 100 nm is highly dependent upon the
size-dependent detection efficiency correction applied; see Supplement for further details.)
This is consistent with the rBC number concentrations in the plumes, as measured
by the SP2, being only ∼1 % of the total CN and with the observation that most of
the particles existed withdp,m< 100 nm (Fig. 3). This also provides a rationale for the
20
systematically smaller EFBCvalues from the SP2 compared to the other measurement
techniques.
Particle coagulation can strongly influence the measured EFCN, the extent to which
depends both on how rapidly and by how much the sample is diluted. Plume intercept
observations have shown there can be a rapid shift in the ratio between EFCN,>5 nm
25
and EFCN,>10 nmwith distance downwind of the target vessel (Lack et al., 2009; Petzold
et al., 2008). For the plumes intercepted here there is some correspondence between
the measured EFCN and plume age, consistent with these previous observations and
ACPD
13, 24635–24674, 2013A case study into the measurement of ship
emissions
C. D. Cappa et al.
Title Page
Abstract Introduction
Conclusions References
Tables Figures
◭ ◮
◭ ◮
Back Close
Full Screen / Esc
Printer-friendly Version Interactive Discussion
Discussion
P
a
per
|
D
iscussion
P
a
per
|
Discussion
P
a
per
|
Discuss
ion
P
a
per
|
the number concentration of particles in ship plumes. Given this, we suggest that the plume intercept method may be generally able to provide a more robust estimate of the
absolute EFCNmost relevant to the atmosphere since it allows for determination of the
EFs upon atmospherically relevant dilution factors and time-scales. However, in stack and test rig studies may allow for a more straightforward measure of the influence of
5
operating parameters (e.g. fuel type, speed/engine load) on the EFCN because they
can be conducted at constant dilution factors.
Comparing with literature plume intercept studies, both the EFCN and the peak sizes
of the particle size distributions measured here are similar to that observed by Lack et al. (2011) 2.5–7.5 min downwind for an ocean going vessel operating an SSD on
10
HFO or MGO (EFCN,>4nm=1.0–1.4×10¹⁶per kg fuel anddp,m=65–35 nm). They also
found that EFCN was approximately constant while particle size increased with vessel
speed for this vessel, although this occurred concurrent with a switch from operation
on HFO to MGO making it difficult to separate fuel quality (i.e. sulfur content) from
vessel speed effects. The EFCN here are also similar to the average observed by
Pet-15
zold et al. (2008) from an SSD vessel operating on HFO at 85 % of max power when
plume age > 16 min (EFCN,>1 3nm=1.4×10¹⁶ per kg fuel). The Miller Freeman EFCN
are somewhat larger than the ensemble average measurements of Lack et al. (2009)
for MSD and SSD vessels operating on either LSF and HFO (EFCN,>5 nm=1.25×10
16
per kg fuel and EFCN,>13 nm=0.7×10
16
per kg fuel). Petzold et al. (2008) also report
20
one measured size distribution for whichdp,m∼75 nm, although they emphasized that
the size distribution may rapidly shift as a plume is increasingly diluted downwind. Considering in stack and test rig studies, Khan et al. (2012a) observed a very slight
increase in dp,m with vessel speed at low speed ratios/loads for an SSD vessel
op-erating on MGO. Kasper et al. (2007) observed a general, although not monotonic,
25
increase in particle size with engine load for a SSD test rig operating on MDO, and
that EFCN was relatively constant for allFload > 1 %. In contrast, Petzold et al. (2010),
using HFO with an MSD test rig, observed a relatively continuous increase in EFCN
ACPD
13, 24635–24674, 2013A case study into the measurement of ship
emissions
C. D. Cappa et al.
Title Page
Abstract Introduction
Conclusions References
Tables Figures
◭ ◮
◭ ◮
Back Close
Full Screen / Esc
Printer-friendly Version Interactive Discussion
Discussion
P
a
per
|
D
iscussion
P
a
per
|
Discussion
P
a
per
|
Discuss
ion
P
a
per
|
atFload=100 % before/after the engine had warmed up). However, in a separate study
Petzold et al. (2011a) observed that EFCNdecreased with test rig engine load for HFO
operation, and that belowFload=100 % the dependence of EFCN on engine load was
ambiguous for the same engine operating on various biofuels. Khan et al. (2012a) ob-served a strongly bimodal size distribution when a SSD vessel operated on HFO, but
5
an approximately monomodal distribution when the same vessel operated on MGO. Additionally, they observed particle diameters were typically larger for HFO operation. Comparison of these various studies suggests that, in general, HFO operation tends to produce larger particles compared with LSF operation, consistent with the greater
contribution of p-SO24−to the total PM1mass when HFO is utilized.
10
3.1.4 Cloud condensation nuclei
The above discussion illustrates that fuel type plays a strong role in determining the emitted particle size distribution. Developing clearer understanding of the impacts of
vessel operating parameters, such as fuel type or speed, on EFCN and particle size
is critical to understanding sources of new particles to the atmosphere, and their
po-15
tential to ultimately act as cloud condensation nuclei (CCN). Understanding the size dependence of emitted particles is important because the emitted size will determine the probability that a given emitted particle will survive to grow into the CCN active size range (Pierce and Adams, 2007).
Direct measurements of the EFCCNwere made for all particles with aerodynamic
di-20
ameters less than 1 µm at super saturations (SS) ranging from 0.3–0.7 %. The CCN instrument operated in a mode wherein the SS was varied with time, and thus the measurements are not consistent across all of the plumes encountered. This makes
it difficult to generalize the relationship between CCN number and vessel speed from
these measurements. The best coverage was obtained for total sub-micrometer
par-25
ticles when SS =0.6 % and 0.7 %. The fraction of total CN that were CCN active at
ACPD
13, 24635–24674, 2013A case study into the measurement of ship
emissions
C. D. Cappa et al.
Title Page
Abstract Introduction
Conclusions References
Tables Figures
◭ ◮
◭ ◮
Back Close
Full Screen / Esc
Printer-friendly Version Interactive Discussion
Discussion
P
a
per
|
D
iscussion
P
a
per
|
Discussion
P
a
per
|
Discuss
ion
P
a
per
|
SS, 0.44 %, for a variety of vessels operating on higher sulfur fuel (CCN / CN=0.42)
or on fuel with < 0.5 % sulfur (CCN / CN=0.07). They are also lower than observations
at SS=0.3 % for a single vessel as it operated on fuel with high sulfur content (∼3 %;
CCN / CN=0.4), but are similar to observations for that same vessel operating on fuel
with lower sulfur content (∼0.2 %; CCN / CN=0.007) (Lack et al., 2011); Miller
Free-5
manwas operating on fuel with sulfur content of∼0.1 % (see Sect. 3.2). It should be
noted, however, that the higher SS used here should lead to overall higher CCN / CN, all other things being equal, which suggests that the CCN activity of the particles
emit-ted byMiller Freemanwas even lower than that observed by Lack et al. (2011) and is
consistent with the p-SO24−being a smaller fraction of the total PM in this study.
10
Our results indicate that directly emitted particles act inefficiently as CCN even at
high super saturations (SS=0.7 %). Additionally, there is less gas-phase sulfur emitted
(Sect. 3.2) that could ultimately lead to downwind growth of the emitted particles. It is evident that the use of LSFs leads to substantially reduced emissions of both direct and potential CCN relative to higher sulfur fuels. As has been previously noted (Lauer
15
et al., 2009; Lack et al., 2011), this reduction in CCN associated with shifts towards low sulfur fuels has substantial implications for the likelihood of ship track formation and the
currently net cooling effect of PM emitted by ships – and thus for future regulation of
the sulfur content of fuel used by ships. However, this climate impact must be balanced with the net benefits to air quality that derive from reductions in the emitted PM (Arneth
20
et al., 2009). It is also important to note that since the low sulfur fuel in use byMiller
Freeman had a sulfur content of only ∼0.1 % these results are most applicable to
vessels operating in sulfur emissions control areas in near shore environments around California or the North and Baltic Seas. Sulfur content for fuels in use by vessels on the high seas is currently limited by the IMO only to 3.5 %, and it has been suggested
25
ACPD
13, 24635–24674, 2013A case study into the measurement of ship
emissions
C. D. Cappa et al.
Title Page
Abstract Introduction
Conclusions References
Tables Figures
◭ ◮
◭ ◮
Back Close
Full Screen / Esc
Printer-friendly Version Interactive Discussion
Discussion
P
a
per
|
D
iscussion
P
a
per
|
Discussion
P
a
per
|
Discuss
ion
P
a
per
|
3.1.5 Influence of vessel speed on emission
Opportunities to measure emissions from individual in-operation vessels, especially as a function of vessel speed, are rare and, as such, only a handful of case-studies are available (Agrawal et al., 2008a,b, 2010; Jayaram et al., 2011; Khan et al., 2012a,b; Lack et al., 2011). This is particularly true for measurements of
compositionally-5
resolved PM emissions and for inter-comparisons of different techniques measuring
the same pollutant.
Although decreased absolute emissions are expected as a result of the fuel economy increase as a vessel slows, there is not yet a clear understanding of how changes to vessel speed influences fuel-based emissions factors (EFs), i.e. the amount of pollutant
10
emitted per kg fuel burned, although various studies using either laboratory test-rigs or in use stack sampling have provided insights (Agrawal et al., 2008a,b, 2010; Jayaram et al., 2011; Khan et al., 2012a, b; Petzold et al., 2008, 2010, 2011a). If EFs vary with
vessel speed, then they may either enhance or decrease the effect of the increased
fuel economy on the actual emissions (EX) because:
15
EX= EFX
Fecon
×D (2)
where EFX is the emission factor for pollutant X (in amount of X per kg fuel), D is the
total distance travelled andEX is the absolute emissions; both EFX and Feconmay be
vessel speed dependent.
For theMiller Freemanthe EFPOMand EFBCboth increase with vessel speed (Fig. 1).
20
Since the emitted PM1 is dominated by POM and BC, EFPM1 also increases with
ves-sel speed. There have been a few previous measurements of vesves-sel speed effects (or
more commonly, engine load effects) on EFBCfor individual ships as measured in-stack
(Agrawal et al., 2008a,b, 2010; Jayaram et al., 2011; Khan et al., 2008, 2012a,b), for individual test rigs (Petzold et al., 2008, 2010, 2011a; Kasper et al., 2007; Sarvi and
25
ACPD
13, 24635–24674, 2013A case study into the measurement of ship
emissions
C. D. Cappa et al.
Title Page
Abstract Introduction
Conclusions References
Tables Figures
◭ ◮
◭ ◮
Back Close
Full Screen / Esc
Printer-friendly Version Interactive Discussion
Discussion
P
a
per
|
D
iscussion
P
a
per
|
Discussion
P
a
per
|
Discuss
ion
P
a
per
|
plume intercept method (Lack et al., 2008b). (Note that some of these studies
actu-ally report EFEC, where EC is elemental carbon. EC is similar to, but not identical to
BC, as both are defined based on the measurement method used. We assume here
that EFBC is interchangeable with EFEC. See Petzold et al. (2013) for an extensive
discussion.) These studies encompass slow, medium and high-speed diesel engines
5
(SSD, MSD and HSD, respectively) of various types and a variety of different fuel types,
including HFO, MGO, MDO and various biofuels. Most of the studies were done on
vessels/engines substantially newer than theMiller Freeman. Propeller type was not
reported for any of the in-stack studies, although for the in-stack studies that investi-gated larger ocean going vessels it is likely that they operated fixed pitch propellers.
10
(Propeller type does not apply to test-rig studies.) These differences present some
challenges in making comparisons between different studies, including between the
current study and the literature results. Nonetheless, it is instructional to consider the dependence observed here in the context of the literature results to gain insights into
how differences in operation influence emissions, and absolute values can be
com-15
pared independent of the actual speed dependence. We assume that for the literature studies the propeller law provides a reasonable method by which the ship speed (or po-tential ship speed, in the case of test-rig studies) can be estimated, or more specifically the ratio between the operating speed and the maximum speed (referred to here as the speed ratio). Therefore, the engine load values reported for the literature in-stack and
20
test-rig studies have been converted to speed ratio values using the propeller law.
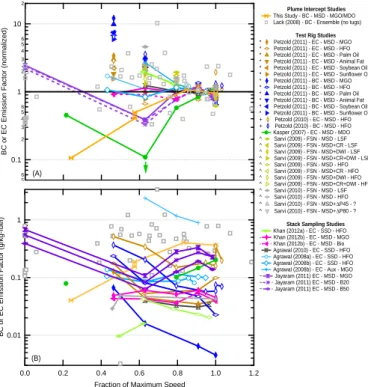
Adopting the approach of Lack and Corbett (2012) we present literature EFBC (and
EFEC) vs. speed ratio (either directly measured or estimated from the propeller law),
and where either the absolute values of EFBC are considered (Fig. 5b) or where the
EFBCvalues have been normalized to 95 % of their maximum speed (equivalent to 85 %
25
load from the propeller law; Fig. 5a). It is important to compare EFs in the same units
(here g kg-fuel−1), and thus the literature results have been converted to g kg-fuel−1
from g kW−1h−1, as necessary (see Supplement for details of this conversion). It is
de-ACPD
13, 24635–24674, 2013A case study into the measurement of ship
emissions
C. D. Cappa et al.
Title Page
Abstract Introduction
Conclusions References
Tables Figures
◭ ◮
◭ ◮
Back Close
Full Screen / Esc
Printer-friendly Version Interactive Discussion
Discussion
P
a
per
|
D
iscussion
P
a
per
|
Discussion
P
a
per
|
Discuss
ion
P
a
per
|
pendence of EFBCon speed and it is difficult to develop generalized results, although it
is clear that theMiller Freemanexhibits substantially different behavior than most other
engines/vessels considered. This may be due to differences in propeller type between
theMiller Freemanand other vessels. The absolute EFBCvalues at higher speed ratios
for theMiller Freemanare somewhat larger than most of the other individual ship
stud-5
ies, although are within the multi-ship range of values observed by Lack et al. (2009) and are comparable to observations for other vessels encountered during CalNex
(Buf-faloe et al., 2013). At lower speed ratios theMiller Freeman EFBC are well within the
range of the individual ship studies.
Considering the literature results all together, there appears to be no clear distinction
10
between studies that utilize SSD vs. MSD engines, or between those that use HFO vs. LSF. There does appear to be some small distinction between the majority of test rig studies and the majority of stack sampling studies; most test rig studies (with the
exception of Kasper et al., 2007) indicate a decrease in EFBC with increasing speed
ratio while most stack sampling studies (with the exception of Jayaram et al., 2011)
15
suggest flat or slightly decreasing EFBCwith speed ratio.
The present work is the only plume-intercept study that involved a single ship and is most consistent with the Kasper et al. (2007) lab study and the Jayaram et al. (2011) stack sampling study (with the exception of the lowest speed ratio, which for Jayaram et al. was for “idle” while in ours was slow travel). The reason for the apparent similarity
20
of the current work with these particular studies is not clear because they had used the same, or very similar, sampling methodologies as the other stack sampling and test rig studies. This may simply be an indication of the study-to-study variability. The ensemble study of Lack et al. (2008b), in which EFs were determined from plume intercepts from multiple ships (excluding tugs), with each ship typically sampled at one
25
single speed, does not suggest a clear dependence of EFBCon speed; this may simply
reflect that the ship-to-ship variability is larger than any vessel speed/engine load effect
ACPD
13, 24635–24674, 2013A case study into the measurement of ship
emissions
C. D. Cappa et al.
Title Page
Abstract Introduction
Conclusions References
Tables Figures
◭ ◮
◭ ◮
Back Close
Full Screen / Esc
Printer-friendly Version Interactive Discussion
Discussion
P
a
per
|
D
iscussion
P
a
per
|
Discussion
P
a
per
|
Discuss
ion
P
a
per
|
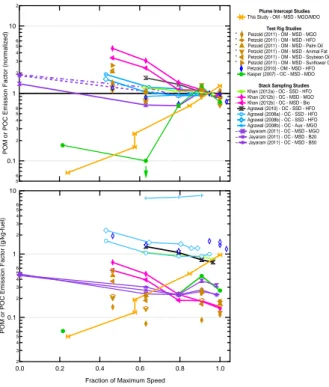
Literature results for EFPOM(or EFPOC, where POC is particulate organic carbon,
i.e. POM excluding the mass of non-C atoms) as a function of speed ratio are shown
normalized to 85 % (Fig. 6a) or as absolute values (Fig. 6b). As with EFBC, there is
a great deal of scatter in the EFPOM/speed relationships, although with most literature
studies suggesting an increase or being relatively flat in the EFPOMat low speed ratios,
5
different than the current study. This may reflect differences in engine/vessel operating
conditions. Our results are again most consistent with the test-rig MGO results from
Kasper et al. (2007), who observed an increase in EFPOM with estimated speed. Also
as with EFBC, there is a great deal of scatter between the various studies in terms of
the absolute EFPOM values. As discussed in Sect. 3.1.2, EFPOM measurements may
10
be influenced by the extent of dilution during sampling, although it is not clear how this
might influence observations of the EFPOM/speed dependence.
Despite the large number of points in Figs. 5 and 6, only a handful of different engines
have actually been tested, which leaves an open question of the general dependence
of EFBC and EFPOM on vessel speed (and engine load), or whether generalizations
15
can even be determined. We suggest more plume intercept studies targeting individ-ual vessels would be beneficial, although coordinating such studies for measurement
of emissions from individual vessels (as in this study) is extremely difficult, requiring
multiple platforms. Additionally, use of a variety of instrumentation to measure BC (or EC) is suggested.
20
3.2 Gas phase emissions
EFs for gas-phase species are shown in Fig. 7 and given in Table 1. EFCO decreased
with increasing vessel speed by approximately a factor of 3 over the range
consid-ered here. In contrast, EFNO
x increased with increasing vessel speed by approximately
20 %. These results are expected since higher speed operation would likely have
re-25
ACPD
13, 24635–24674, 2013A case study into the measurement of ship
emissions
C. D. Cappa et al.
Title Page
Abstract Introduction
Conclusions References
Tables Figures
◭ ◮
◭ ◮
Back Close
Full Screen / Esc
Printer-friendly Version Interactive Discussion
Discussion
P
a
per
|
D
iscussion
P
a
per
|
Discussion
P
a
per
|
Discuss
ion
P
a
per
|
this would likely accentuate the NOx increase but have minimal influence on CO. The
EFHCHO are inversely correlated with Fload. For all but the lowest speed plume, the
relationship between EFCO and EFHCHO is consistent with previous observations from
Williams et al. (2009). Our observations of EFNO
x and EFCOexhibit the opposite
depen-dence of that observed by Khan et al. (2012a) for operation of a SSD engine on MGO,
5
although agree with their observations when the ship operated on HFO. For
compari-son, Agrawal et al. (2010) found little dependence of CO or NOx EFs on engine load
for a SSD container ship operating on HFO. The reason for these differences is
un-clear, but could be related to engine or propeller type. Our results for CO suggest that,
for smaller vessels such as the Miller Freeman, the decrease in absolute emissions
10
from increased fuel economy at reduced speeds may be offset to some extent by an
increase in EFCO, whereas the decrease in EFNOx may enhance emissions reductions.
The values of EFSO2were independent of vessel speed. We would not expect EFSO2
to depend strongly on engine load since it is primarily dependent on the sulfur content of the fuel. This is similar behavior as observed by Khan et al. (2012a). The low value
15
of EFSO2 confirms that Miller Freemanwas indeed burning low sulfur fuel, which we
estimate to be 0.097±0.011 % S by weight based upon the average EFSO
2, a negligible
EF for p-SO24− and the assumption that SO3emissions are very small.
4 Implications
Our results provide a useful case study of the dependence of PM and trace gas
emis-20
sions factors on vessel speed as measured from a real-world MSD vessel, representa-tive of many harbor craft vessels operating on low-sulfur fuel. The observed increase in PM mass EFs with vessel speed suggests that slower speed operation of these vessel types may lead to substantially lower emissions, especially since slower speed oper-ation also corresponds to (typically) better fuel economy. One aspect not considered
25
ACPD
13, 24635–24674, 2013A case study into the measurement of ship
emissions
C. D. Cappa et al.
Title Page
Abstract Introduction
Conclusions References
Tables Figures
◭ ◮
◭ ◮
Back Close
Full Screen / Esc
Printer-friendly Version Interactive Discussion
Discussion
P
a
per
|
D
iscussion
P
a
per
|
Discussion
P
a
per
|
Discuss
ion
P
a
per
|
EFs respond to rapid acceleration; we suggest such measurements would be useful in future studies.
More broadly, comparison with literature results demonstrates that challenges exist in developing a generalized EF/speed (or engine load) relationship, in particular for PM emissions, because results from individual studies may depend on the measurement
5
methodology used: plume intercept (this study and others, Lack et al., 2008b, 2009, 2011; Petzold et al., 2008) versus in-use stack sampling (Agrawal et al., 2008a, 2010; Jayaram et al., 2011; Khan et al., 2012a,b; Murphy et al., 2009) versus test rig sampling (Petzold et al., 2010, 2011a; Sarvi et al., 2009; Sarvi and Zevenhoven, 2010; Kasper et al., 2007). This is true even if the current study is excluded. Also, it is clear that there is
10
a great deal of variability in the absolute emissions between different vessels, perhaps
not surprising given the variety of different engine types and ages considered in the
various studies (Table S1). Methodological limitations, along with the limited number of
different vessels or engines for which measurements have been made, makes it diffi
-cult to establish whether engine type or fuel type affects the EF/speed relationship.
Al-15
though logistically more challenging, we suggest that plume intercept studies, which al-low for measurement of EFs under actual atmospheric dilution conditions, may provide for EFs that are most relevant to the actual atmosphere, and thus to emission inventory development. We additionally suggest that, whenever possible, multiple measurement techniques be employed, especially for BC (or EC). Our measurement of BC EFs at
at-20
mospheric relevant dilution levels using multiple methodologies (e.g. photo-acoustics, filter-based absorption, laser induced incandescence and aerosol mass spectrometry) suggest that the SP2 underestimates BC emissions relative to other methods, likely due to methodological limitations. We suggest that, barring additional improvements in field-deployable laser induced incandescence methods (e.g. Chan et al., 2011), that
25
light absorption techniques may provide the most robust and accurate determination of
EFBC. Further consideration of the influence of vessel speed and engine load on other
ACPD
13, 24635–24674, 2013A case study into the measurement of ship
emissions
C. D. Cappa et al.
Title Page
Abstract Introduction
Conclusions References
Tables Figures
◭ ◮
◭ ◮
Back Close
Full Screen / Esc
Printer-friendly Version Interactive Discussion
Discussion
P
a
per
|
D
iscussion
P
a
per
|
Discussion
P
a
per
|
Discuss
ion
P
a
per
|
Supplementary material related to this article is available online at http://www.atmos-chem-phys-discuss.net/13/24635/2013/
acpd-13-24635-2013-supplement.pdf.
Acknowledgements. The authors thank the crews of the R/VAtlantisand the Miller Freeman,
especially the Field Operations Officer on theMiller FreemanLT Patrick Murphy, without all of
5
whom this study would not have been possible. This work was supported in part by the US Environmental Protection Agency under a STAR research assistance agreement (RD834558), the NOAA Climate Program (including NA09OAR4310124 and NA09AR4310125), the Cali-fornia Air Resources Board, the Canadian Federal Government (PERD Project C12.007) and NSERC. It has not been formally reviewed by the any of the funding agencies. The views
ex-10
pressed in this document are solely those of the authors, and the funding agencies do not endorse any products or commercial services mentioned in this publication.
References
Agrawal, H., Malloy, Q. G. J., Welch, W. A., Wayne Miller, J., and Cocker III, D. R.: In-use gaseous and particulate matter emissions from a modern ocean going container vessel,
15
Atmos. Environ., 42, 5504–5510, doi:10.1016/j.atmosenv.2008.02.053, 2008a.
Agrawal, H., Welch, W. A., Miller, J. W., and Cocker III, D. R.: Emission measurements from a crude oil tanker at sea, Environ. Sci. Technol., 42, 7098–7103, doi:10.1021/es703102y, 2008b.
Agrawal, H., Welch, W. A., Henningsen, S., Miller, J. W., and Cocker III, D. R.: Emissions from
20
main propulsion engine on container ship at sea, J. Geophys. Res.-Atmos., 115, D23205, doi:10.1029/2009jd013346, 2010.
Arneth, A., Unger, N., Kulmala, M., and Andreae, M. O.: Clean the Air, Heat the Planet?, Sci-ence, 326, 672–673, doi:10.1126/science.1181568, 2009.
Bond, T. C. and Bergstrom, R. W.: Light absorption by carbonaceous particles: An investigative
25