Comparative Physiological and Proteomic
Analysis Reveals the Leaf Response to
Cadmium-Induced Stress in Poplar (
Populus
yunnanensis
)
Yunqiang Yang1,2,3☯, Xiong Li1,2,3,6☯, Shihai Yang4,6, Yanli Zhou1,2,3,6, Chao Dong1,2,3,6, Jian Ren5, Xudong Sun1,2,3*, Yongping Yang1,2,3*
1Key Laboratory for Plant Diversity and Biogeography of East Asia, Kunming Institute of Botany, Chinese Academy of Science, Kunming, 650204, China,2Plant Germplasm and Genomics Center, Kunming Institute of Botany, Chinese Academy of Sciences, Kunming, 650201, China,3Institute of Tibetan Plateau Research at Kunming, Kunming Institute of Botany, Chinese Academy of Sciences, Kunming, 650201, China,4Key Laboratory of Tibetan Environment Changes and Land Surface Processes, Institute of Tibetan Plateau Research, Chinese Academy of Sciences, Beijing, 100085, China,5Department of Grassland Science, Yunnan Agricultural University, Kunming, 650201, China,6University of Chinese Academy of Sciences, Beijing, 100049, China
☯These authors contributed equally to this work.
*[email protected](XS);[email protected](YPY)
Abstract
Excess amounts of heavy metals are important environmental pollutants with significant ecological and nutritional effects. Cdmium (Cd) is of particular concern because of its wide-spread occurrence and high toxicity. We conducted physiological and proteomic analyses to improve our understanding of the responses ofPopulus yunnanensisto Cd stress. The plantlets experienced two apparent stages in their response to Cd stress. During the first stage, transiently induced defense-response molecules, photosynthesis- and energy-asso-ciated proteins, antioxidant enzymes and heat shock proteins (HSPs) accumulated to enhance protein stability and establish a new cellular homeostasis. This activity explains why plant photosynthetic capability during this period barely changed. During the second stage, a decline of ribulose-1, 5-bisphosphate carboxylase (RuBisCO) and HSP levels led to imbalance of the plant photosynthetic system. Additionally, the expression of Mitogen-activated protein kinase 3 (MPK3), Mitogen-Mitogen-activated protein kinase 6 (MPK6) and a homeobox-leucine zipper protein was higher in the second stage. Higher expression of caf-feoyl-CoA O-methyltransferase (CCoAOMT) may regulate plant cell wall synthesis for greater Cd storage. These genes may be candidates for further research and use in genetic manipulation of poplar tolerance to Cd stress.
OPEN ACCESS
Citation:Yang Y, Li X, Yang S, Zhou Y, Dong C, Ren J, et al. (2015) Comparative Physiological and Proteomic Analysis Reveals the Leaf Response to Cadmium-Induced Stress in Poplar (Populus yunnanensis). PLoS ONE 10(9): e0137396. doi:10.1371/journal.pone.0137396
Editor:Wei Wang, Henan Agricultural Univerisity, CHINA
Received:December 4, 2014
Accepted:August 17, 2015
Published:September 8, 2015
Copyright:© 2015 Yang et al. This is an open access article distributed under the terms of the Creative Commons Attribution License, which permits unrestricted use, distribution, and reproduction in any medium, provided the original author and source are credited.
Data Availability Statement:All relevant data are within the paper and its Supporting Information files.
Funding:This work was financially supported by the National Natural Science Foundation of China (NSFC) (No. 41271058), the Major State Basic Research Development Program of China (Nos. 2010CB951704), and the National Science Foundation of China (No. 31260167).
Introduction
Heavy metals constitute an important and worrying form of environmental pollution primarily caused by the increased mining and industrial activities in the 19thand early 20thcenturies [1–
3]. Fifty-three of the ninety naturally occurring elements are heavy metals [4]. Among heavy metals, Cd is of particular concern because of its widespread occurrence and high toxicity. A problem in some agricultural soils in China is the uptake of Cd by rice (Oryza sativa) and other crops grown on the acidic red soils of southern China [5,6]. The concentration of Cd in these soils exceeds the World Health Organization’s recommendations (0.2 ppm) [7]. Forest soils are more susceptible to Cd because they are often acidic, poorly buffered and exposed to atmo-spheric heavy-metal pollution [6].
Cd enters plants through the root system and is quickly transported to the stem via the xylem and finally stored in leaf epidermal cells [8–10]. Cd stress in plant leaves harms photo-synthesis and chlorophyll metabolism by disrupting the electron transport chain, aggregation of pigment protein complexes of the photosystems [8]. Cd also might affect directly chloroplast replication and cell division in the leaf to damage numerous cellular structures and membranes [9,10]. This impairs nutrient distribution and accelerates apoptosis and necrosis in leaves. Additionally, Cd can alter the uptake of minerals by plants through its effects on soil mineral availability, or by reducing the soil microbe population [1]. In general, Cd has been shown to interfere with the uptake, transport and use of Ca2+, Mg2+, P, K+and water by plants [2]. It has been reported that Cd toxicity can indirectly lead to the production of reactive oxygen species (ROS), such as the superoxide anion (O2−), and hydrogen peroxide (H2O2) by interfering with
the antioxidant defence system to cause oxidative damage to plants [11].
To reduce its damage, cadmium can be detoxified by phytochelatins, a class of glutathione-derived peptides containing repeating units of Glu and Cys that function by binding metal ions and transporting them to the vacuole [12,13]. Plant cells can also stimulate the activity of anti-oxidant enzymes such as superoxide dismutase (SOD; EC 1.15.1.1), catalase (CAT; EC 1.11.1.6),L-ascorbate peroxidase (APX; EC 1.11.1.11), glutathione reductase (GR; EC 1.6.4.2),
dehydroascorbate reductase (DHAR; EC 1.8.5.1) and monodehydroascorbate reductase (MDHAR; EC 1.6.5.4) to neutralize the harmful effects of ROS release. Additionally, Cd induces genes encoding enzymes for the biosynthesis of phenylpropanoids, trehalose, poly-amines and tryptophan, which have been identified as critical factors for resistance to various stresses [14,15]. Cd increases the expression of genes for dehydration-related aquaporin iso-forms and pathogenesis-related proteins, and for proteins involved in remobilizing carbon from other energy sources [16,17].
Yunnan poplar (Populus yunnanensisDode) is distributed in the high altitude areas of southwestern China. It plays an important role in forestry production, afforestation, and envi-ronmental conservation because of its fast growth rate, high biomass, and large populations. It is also one of the woody plants most commonly used in stress resistance studies because of its outstanding tolerance to harsh environmental conditions, including heavy metals, cold, drought, salinity, acid rain, elevated CO2, warming, drought and UV-B [18–21]. Previous stud-ies have shown that stress-related proteins like heat shock proteins, proteinases and pathogene-sis-related proteins are increased in poplar in response to Cd treatment [22]. However, because of the growing Cd content in the soils of southern China, more evidence of the effects of Cd on
Materials and Methods
Ethics statement
Plant samples were collected in the Kunming suburbs, China, but not the authority responsible for a national park, protected area of land or private land. We declare that no specific permis-sions were required for these locations/activities. We confirm that the field studies did not involve endangered or protected species. There will be no conflict of ethics and interest.
Poplar seedling growth and Cd treatment
Yunnan poplar (Populus yunnanensis) cuttings were obtained every 10 days as three repeat experiments during the March to April 2014 from male plants in the Kunming suburbs (N 25° 08017.60@, E 102° 44036.28@), Yunnan Province, Southeastern China. After surviving in the field for 30 d, rooting plants that averaged 7–9 leaves were transplanted into 1/4 Hoagland’s nutrient solution (pH 5.5) in growth chambers under controlled conditions (23°C and 16 h light/8 h dark, 200μmol photons m−2s−1light intensity, relative humidity 75–80%). When
plants reached the desired size (18–20 leaves), CdCl2was added to the culture solution to a final concentration of 100μM. The fifth leaf from the apex of each seedling was harvested for
physiological and proteomic analysis after 0 (control), 4, 8 and 12 d of treatment.
Chlorophyll fluorescence analyses
Chlorophyll fluorescence was measured with a Pulse-Amplitude-Modulation (PAM) Chloro-phyll Fluorometer (Heinz-Walz GmbH, Effeltrich, Germany) as previously described [23]. Briefly, plants were dark-adapted for 30 min to measure the maximum quantum yield of pho-tosystem II (PSII). Fv/Fm and electron transport rate (ETR) was recorded during a saturating photon pulse (4000μmol m−2s−1) using a whole leaf.
Protein extraction
Leaves collected from treatedP.yunnanensiswere homogenized to a fine powder in a mortar with liquid nitrogen. Approximately 1.0 g of plant sample from a part of powder of 30 individ-uals with equivalent quantity was used for protein isolation. Total soluble proteins were extracted on ice in acetone containing 10% (w/v) trichloroacetic acid (TCA) and 0.07% (w/v) dithiothreitol (DTT). The samples were kept at−20°C for 4 h and centrifuged at 25,000gfor 30
min at 4°C. The pellets were washed with acetone containing 0.07% (w/v) DTT at−20°C for 30
min and then centrifuged (25,000g, 20 min, 4°C) three times. Following a further centrifuga-tion, each pellet was vacuum-dried and dissolved in urea buffer comprising 8-M urea, 20 mM DTT, 4% 3-[(3-Cholamidopropyl) dimethylammonio] propanesulfonate, and 2% ampholyte (pH 4–7). The solution was vigorously vortex-mixed for 1 h at room temperature, centrifuged at 20°C for 20 min at 25,000g, and the supernatant was collected for 2-DE experiments.
Two-dimensional electrophoresis and image analysis
A total of 900μg of proteins extracted from each sample were used for 2-DE. First dimensional
and 3 W/gel for 1 h and then 15 W/gel using a PROTEAN II XL Cell (Bio-Rad). Gels were stained with Coomassie Brilliant Blue R-250, and then scanned using a GS-800 calibrated den-sitometer (Bio-Rad). The digitized protein spots on 2-D maps were quantitatively analyzed using PDQuest 2D analysis software (Bio-Rad) on the basis of their relative volumes. The opti-mized parameters were as follows: partial threshold, 4; saliency, 2.0; minimum area, 50. To ver-ify the autodetected results, all spots were manually quantified by determining the ratio of the volume of each detected spot to the total volume of all spots on the gels.
Protein identification for mass spectrometry analyses and functional
classification
Protein spots corresponding to expression changes greater than 1.5 fold were manually excised from the gels, and in-gel trypsin digestion was conducted as described by Wanget al., with minor modifications [24]. Specifically, spots were destained with 50 mM NH4HCO3for 1 h at 40°C, and reduced with 30% (v/v) acetonitrile (ACN) in 50 mM ammonium bicarbonate prior to DTT and iodoacetamide alkylation. The gels were then minced, air-dried, and rehydrated in 12.5 ng/μL sequencing-grade modified trypsin (Promega, Fitchburg, WI, USA) in 25 mM
NH4HCO3at 37°C for 16 h. The peptides were extracted three times with 0.1% (v/v) trifluoroa-cetic acid (TFA) and 50% (v/v) ACN, and MS analysis was conducted using a 4800 Plus Matrix-Assisted Laser Desorption/Ionization-Tandem Time of Flight (MALDI-TOF/
TOF-MS) Proteomics Analyzer (Applied Biosystems, Bedford, MA, USA). MS acquisition and processing parameters were set to reflector positive mode and an 800–3500 Da acquisition mass range, respectively. The laser frequency was 50Hz, and 700 laser points were collected for each sample signal. For secondary MS analysis, four to six ion peaks with signal-to-noise ratios exceeding 100 were selected from each sample as precursors. TOF/TOF signal data for each precursor were then was accumulated with 2000 laser points. The primary and secondary mass spectra were transferred to Excel files and submitted to MASCOT (http://www.matrixscience. com) for protein identification, applying the following parameters: NCBI nr database, other green plants as the taxonomy parameter, no molecular weight restriction, one missed trypsin cleavage allowed, iodoacetamide-treated cysteine, oxidation of methionine, a peptide tolerance of 100 ppm, and an MS/MS tolerance of 0.25 kDa. Protein identifications were validated manu-ally with at least three peptides matched, keratin contamination was removed, and the
MOWSE threshold was set over 60 (P<0.05). According to the MASCOT probability analysis, only significant hits were accepted for the identification of a protein sample. When peptides matched multiple proteins, the protein with the highest score was selected. The proteins were assigned Gene Ontology (GO) annotations by the Blast2GO software, and grouped according to their putative molecular functions [25].
Antioxidant enzyme activity measurement
at 12,000gfor 10 min at 4°C, and then the supernatant was centrifuged at 21,000gfor 15 min at 4°C. The resultant supernatant was collected for determination of antioxidant enzyme activi-ties, and stored at−80°C for further analyses. CAT activity was determined by monitoring the
decomposition of H2O2at 240 nm. The reaction mixture contained 50 mM potassium phos-phate buffer (pH 7.0) and enzyme extract in a 1 mL volume. The reaction was initiated by add-ing 10 mM H2O2. One unit of catalase is defined as the amount of enzyme that liberates half of the peroxide oxygen from 10 mM H2O2solution in 60 s at 25°C. APX activity was determined by the decrease of absorbance at 290 nm. The reaction mixture contained 50 mM sodium phos-phate buffer (pH 7.0), 1mM ascorbate, 2.5 mM H2O2and a suitable volume of enzyme extract. GR activity was determined by the oxidation of NADPH at 340 nm. The reaction mixture was composed of 50 mM Tris-HCl buffer (pH 7.0), 5 mM MgCl2, 0.2 mM NADPH, 0.5 mM gluta-thione (oxidized form, GSSG) and an appropriate volume of enzyme extract in a 1 mL volume. The reaction was initiated by the addition of NADPH at 25°C. One unit of SOD is defined as the amount of enzyme that causes a 50% decrease in the SOD inhibitable NBT reduction. The reaction mixture (3 mL) was composed of 50 mM sodium phosphate buffer (pH 7.8), 13 mM methionine, 75μM nitroblue tetrazolium (NBT), 16.7μM riboflavin and an appropriate
vol-ume of enzyme extract. The reaction was initiated by light illumination.
In situ
H
2O
2, O
2−and malondialdehyde (MDA) detection
Thein situdetection of H2O2and O2−was performed using a previously reported method [23].
H2O2was monitored with 1mg/mL of diaminobenzidine. O2−in the leaves was detected by
NBT reduction at specific time points. The MDA content was determined as described by Duanet al. [27]. Approximately 0.5 g of fresh leaf tissue was homogenized in 10 mL of 10% TCA and centrifuged at 12,000gfor 10 min. Then, 2 mL of 0.6% thiobarbituric acid in 10% TCA was added to a 2 mL aliquot of the supernatant. The mixture was heated in boiling water for 30 min and then quickly cooled in an ice bath. After centrifugation at 10,000gfor 10 min, the absorbance of the supernatant at 450, 532, and 600 nm was determined. The MDA concen-tration was estimated using the formula: C (nmol/mL) = 6.45 (A532−A600)−0.56A450. The MDA concentration was expressed as n mol g−1FW.
Western blotting
Proteins were extracted as described above, and 20μg of proteins were separated by SDS-PAGE
using 12% (w/v) polyacrylamide slab gels. Electrophoresis was performed at 15°C and 80V for 30 min and then 120V using a PROTEAN1II XL Cell. Following electrophoresis, the proteins were electrotransferred to polyvinylidene difluoride (PVDF) membranes at 20 V for 25 min using a Trans-Blot SD (Bio-Rad). After transfer, the membranes were blocked in 5% dried milk for 1 h at room temperature (23–25°C) and incubated with the primary antibody, which was diluted to 1:3000 for anti-CCoAOMT, 1:1000 for anti-HSP70, 1:3000 for anti-HSP18.2, and 1:3000 for anti-MPK3 and anti-MPK6, at room temperature for 1 h, and with horseradish per-oxidase (HPR)-conjugated secondary antibody for 1 h at room temperature. The antibodies against plant were obtained from Agrisera (Agrisera, Vannas, Sweden). The chemilumines-cence signals were detected using an ECL kit (GE, Evansville, IN, USA).
Results
Photosynthesis changes during Cd treatment
discerned. The highest negative effects occurred after 12 d of Cd treatment, whereas these parameters were not significant after 4 d (Fig 1b). Estimation of the PSII maximum efficiency by fluorescence images of Fv/Fm indicated that Cd reduced the Fv/Fm values of the samples (Fig 1a and 1b). The Fv/Fm values of samples treated for 8 and 12 d were lower, respectively, compared with the controls (0 d) (P<0.05). Additionally, Cd decreased the ETR after 8 and 12 d of treatment (Fig 1c). When plants were stressed by Cd, ETR descended more rapidly and to greater degrees from 4 h to 8 h than from 0 h to 4 h. These results suggest the Cd decreases the photosynthetic activity ofP.yunnanensiswith the prolongation of Cd stress time, especially after 4 days of treatment.
Dynamic changes of protein level Cd treatment
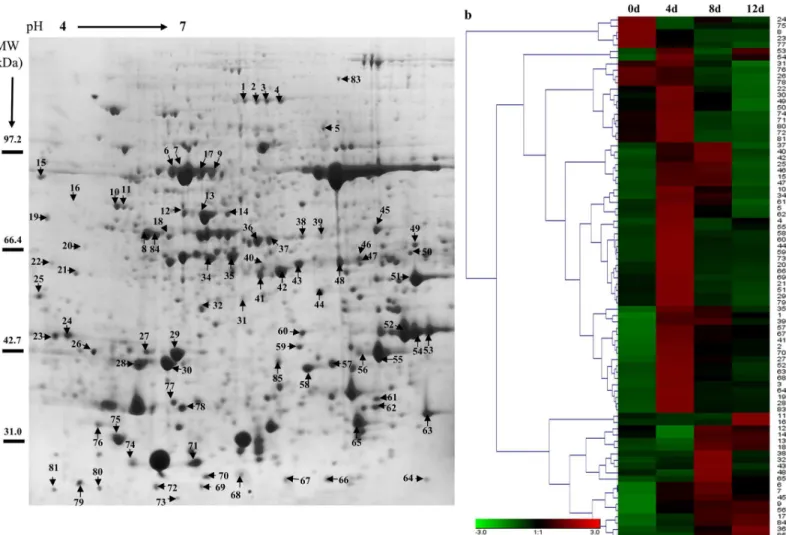
To evaluate the expression patterns of proteins in poplar cells following Cd treatment, the total proteins of leaves sampled at 0, 4, 8 and 12 d were extracted and separated by 2-DE (Fig 2aand
S1 Fig). More than 600 protein spots were reproducibly detected within each treatment. Eighty-three differentially expressed proteins (at least 1.5-fold, P<0.05) were detected using PDQuest 7.1 (Bio-Rad), and the expression levels of proteins in different treatments were shown and analyzed by Genesis 1.7 software (Fig 2b).Fig 3ashows the protein changes with cadmium treatment at different time intervals. We found that the numbers of up-regulated Fig 1. Effects of Cd on photosynthetic capability of leaves ofPopulus yunnanensis(a).The effects of Cd treatment on the Fv/Fm ratio (b) and ETR (c) in leaves after 0, 4, 8 and 12 d of treatment. Images were obtained (up), and photosynthetic capabilities were recorded by Fv/Fm imaging using a PAM chlorophyll fluorometer (down) at the indicated times. Images captured under white light were used as controls. The pseudocolor code depicted at the bottom of the images ranges from 0 (red) to 1.0 (purple). Values reflect means±SEs of at three independent experiments (n= 30/experiment). Different symbols above the bars indicate significant differences (Tukey’s test,P<0.05).
proteins decreased and down-regulated proteins increased after prolonged cadmium treat-ment. Forty proteins were found in the intersection of up-regulated proteins and eight proteins were found in the intersection of down-regulated proteins among 4 d/0 d, 8 d/0 d and 12 d/0 d (Fig 3b). These results demonstrated that some proteins expression levels first increased and then decreased inP.yunnanensisin response to cadmium stress, such as spots 74, 62, 79, and 10 (Table 1andS1 Fig).
Eighty-three differentially expressed proteins were isolated and detected by MALDI-TOF/ TOF-MS analysis and identified by screening against the NCBI nr protein database (Table 1
andS1 Table). The proteins were classified into nine functional categories: response to stress (26%), material metabolite (21%), photosynthesis and energy metabolite (14%), DNA and ion binding (13%), antioxidant activity (13%), protein kinase (8%), and predicted protein (4%) (Fig 3c). Within each of the GO categories, the dominant subcategory was“response to stress”, and included heat shock proteins (spots 64, 74, 10, 12, 14 and 72), a 14-3-3 protein (spot 58), CCoAOMT (spots 67 and 62) and NBS-LRR resistance gene-like protein (spot 3). These results demonstrated that processes involving all of these proteins were important in the response to Fig 2. Protein expression patterns in the total proteins of poplar leaves exposed to Cd.2-DE maps showing protein profiles of poplar leaves untreated (a). Proteins were extracted from leaves and separated by isoelectric focusing on an IPG strip of pH 4–7 (left–right), followed by SDS-PAGE on a 12% gel. (b) Hierarchical cluster analysis based on protein expression levels was performed with Genesis 1.7 software. Colors correspond to the log-transformed values of protein as shown in the bar at the bottom of the figure.
Cd stress inP.yunnanensis. Additionally, antioxidant proteins (spots 1, 48, 69, 56, 61, 22 and 57), protein kinases and transcription factors (spots 74, 84, 85 and 25) accounted for nearly 22% of all differentially-expressed proteins (Table 1andFig 3c).
To identify key metabolic processes that were affected by Cd, Eighty-three proteins that were identified were further mapped in MapMan. The result revealed that most of the Cd-responsive proteins (27 proteins) involved in biotic stress signaling were activated (Fig 3d,S2 FigandS2 Table). In the“response to stress”category, heat shock proteins (HSPs), as well as proteins implicated in cell wall metabolism such as CCoAOMT (spots 67 and 62), were highly overexpressed (Fig 3dandTable 1). Several protein kinases involved in biotic stress, such as MPK3 and MPK6 (spots 84 and 85), were also activated (Fig 3dandTable 1). These data sug-gest that Cd induced responses similar to the hypersensitive response upon plant-pathogen interaction and that these responses may have also invoked the activation of cell wall metabolism.
Fig 3. Results of comparative proteomics analyses of different treatments.(a) Number of identified proteins showing changes in expression at each treatment time. (b) Venn diagram showing the overlap of up- and down-regulated proteins among 4 d/0 d, 8 d/0 d, and 12 d/0 d. (c) Functional classification of differentially expressed proteins in poplar leaves after Cd treatment. (b) Proteins involved in biotic stress according to MapMan in leaves after 4 d of
treatment. Details of the mapped proteins were shown in theS2 Table. Positive fold change values (red) indicate up-regulation, whereas negative fold change values (blue) indicate down-regulation. Gray circle mean the protein that is not mapped in the pathway.
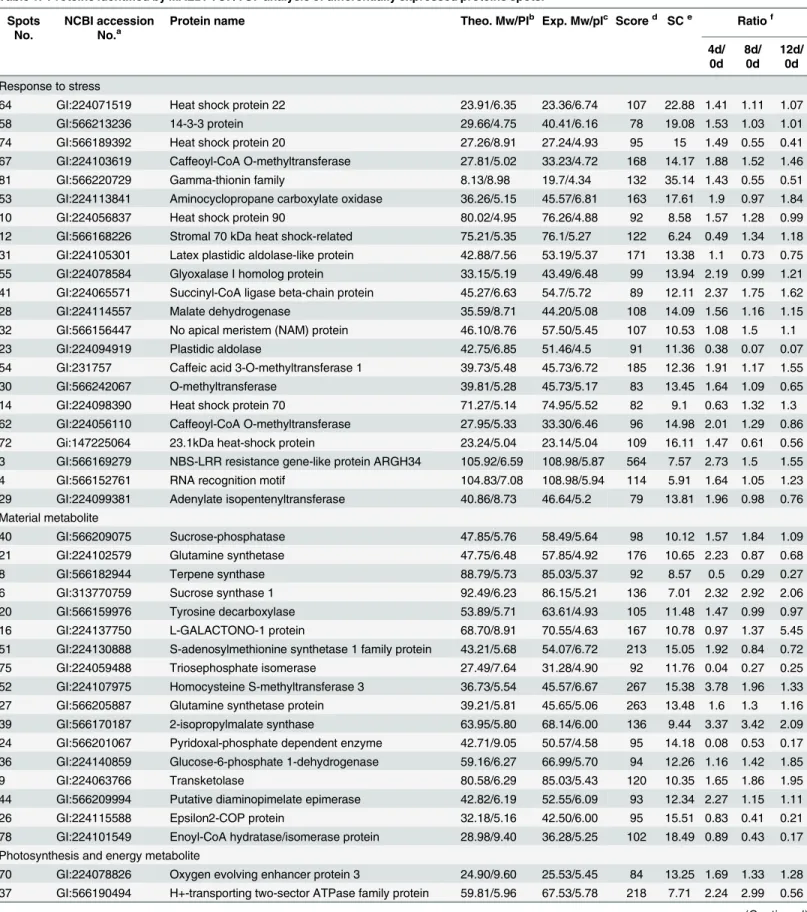
Table 1. Proteins identified by MALDI-TOF/TOF analysis of differentially expressed proteins spots.
Spots No.
NCBI accession No.a
Protein name Theo. Mw/PIb Exp. Mw/pIc Scored SCe Ratiof
4d/ 0d
8d/ 0d
12d/ 0d
Response to stress
64 GI:224071519 Heat shock protein 22 23.91/6.35 23.36/6.74 107 22.88 1.41 1.11 1.07
58 GI:566213236 14-3-3 protein 29.66/4.75 40.41/6.16 78 19.08 1.53 1.03 1.01
74 GI:566189392 Heat shock protein 20 27.26/8.91 27.24/4.93 95 15 1.49 0.55 0.41
67 GI:224103619 Caffeoyl-CoA O-methyltransferase 27.81/5.02 33.23/4.72 168 14.17 1.88 1.52 1.46
81 GI:566220729 Gamma-thionin family 8.13/8.98 19.7/4.34 132 35.14 1.43 0.55 0.51
53 GI:224113841 Aminocyclopropane carboxylate oxidase 36.26/5.15 45.57/6.81 163 17.61 1.9 0.97 1.84
10 GI:224056837 Heat shock protein 90 80.02/4.95 76.26/4.88 92 8.58 1.57 1.28 0.99
12 GI:566168226 Stromal 70 kDa heat shock-related 75.21/5.35 76.1/5.27 122 6.24 0.49 1.34 1.18 31 GI:224105301 Latex plastidic aldolase-like protein 42.88/7.56 53.19/5.37 171 13.38 1.1 0.73 0.75 55 GI:224078584 Glyoxalase I homolog protein 33.15/5.19 43.49/6.48 99 13.94 2.19 0.99 1.21 41 GI:224065571 Succinyl-CoA ligase beta-chain protein 45.27/6.63 54.7/5.72 89 12.11 2.37 1.75 1.62
28 GI:224114557 Malate dehydrogenase 35.59/8.71 44.20/5.08 108 14.09 1.56 1.16 1.15
32 GI:566156447 No apical meristem (NAM) protein 46.10/8.76 57.50/5.45 107 10.53 1.08 1.5 1.1
23 GI:224094919 Plastidic aldolase 42.75/6.85 51.46/4.5 91 11.36 0.38 0.07 0.07
54 GI:231757 Caffeic acid 3-O-methyltransferase 1 39.73/5.48 45.73/6.72 185 12.36 1.91 1.17 1.55
30 GI:566242067 O-methyltransferase 39.81/5.28 45.73/5.17 83 13.45 1.64 1.09 0.65
14 GI:224098390 Heat shock protein 70 71.27/5.14 74.95/5.52 82 9.1 0.63 1.32 1.3
62 GI:224056110 Caffeoyl-CoA O-methyltransferase 27.95/5.33 33.30/6.46 96 14.98 2.01 1.29 0.86 72 Gi:147225064 23.1kDa heat-shock protein 23.24/5.04 23.14/5.04 109 16.11 1.47 0.61 0.56 3 GI:566169279 NBS-LRR resistance gene-like protein ARGH34 105.92/6.59 108.98/5.87 564 7.57 2.73 1.5 1.55
4 GI:566152761 RNA recognition motif 104.83/7.08 108.98/5.94 114 5.91 1.64 1.05 1.23
29 GI:224099381 Adenylate isopentenyltransferase 40.86/8.73 46.64/5.2 79 13.81 1.96 0.98 0.76 Material metabolite
40 GI:566209075 Sucrose-phosphatase 47.85/5.76 58.49/5.64 98 10.12 1.57 1.84 1.09
21 GI:224102579 Glutamine synthetase 47.75/6.48 57.85/4.92 176 10.65 2.23 0.87 0.68
8 GI:566182944 Terpene synthase 88.79/5.73 85.03/5.37 92 8.57 0.5 0.29 0.27
6 GI:313770759 Sucrose synthase 1 92.49/6.23 86.15/5.21 136 7.01 2.32 2.92 2.06
20 GI:566159976 Tyrosine decarboxylase 53.89/5.71 63.61/4.93 105 11.48 1.47 0.99 0.97
16 GI:224137750 L-GALACTONO-1 protein 68.70/8.91 70.55/4.63 167 10.78 0.97 1.37 5.45
51 GI:224130888 S-adenosylmethionine synthetase 1 family protein 43.21/5.68 54.07/6.72 213 15.05 1.92 0.84 0.72 75 GI:224059488 Triosephosphate isomerase 27.49/7.64 31.28/4.90 92 11.76 0.04 0.27 0.25 52 GI:224107975 Homocysteine S-methyltransferase 3 36.73/5.54 45.57/6.67 267 15.38 3.78 1.96 1.33 27 GI:566205887 Glutamine synthetase protein 39.21/5.81 45.65/5.06 263 13.48 1.6 1.3 1.16 39 GI:566170187 2-isopropylmalate synthase 63.95/5.80 68.14/6.00 136 9.44 3.37 3.42 2.09 24 GI:566201067 Pyridoxal-phosphate dependent enzyme 42.71/9.05 50.57/4.58 95 14.18 0.08 0.53 0.17 36 GI:224140859 Glucose-6-phosphate 1-dehydrogenase 59.16/6.27 66.99/5.70 94 12.26 1.16 1.42 1.85
9 GI:224063766 Transketolase 80.58/6.29 85.03/5.43 120 10.35 1.65 1.86 1.95
44 GI:566209994 Putative diaminopimelate epimerase 42.82/6.19 52.55/6.09 93 12.34 2.27 1.15 1.11
26 GI:224115588 Epsilon2-COP protein 32.18/5.16 42.50/6.00 95 15.51 0.83 0.41 0.21
78 GI:224101549 Enoyl-CoA hydratase/isomerase protein 28.98/9.40 36.28/5.25 102 18.49 0.89 0.43 0.17 Photosynthesis and energy metabolite
70 GI:224078826 Oxygen evolving enhancer protein 3 24.90/9.60 25.53/5.45 84 13.25 1.69 1.33 1.28 37 GI:566190494 H+-transporting two-sector ATPase family protein 59.81/5.96 67.53/5.78 218 7.71 2.24 2.99 0.56
Table 1. (Continued)
Spots No.
NCBI accession No.a
Protein name Theo. Mw/PIb Exp. Mw/pIc Scored SCe Ratiof
4d/ 0d
8d/ 0d
12d/ 0d
38 GI:224099437 H+-transporting two-sector ATPase 59.97/5.91 68.04/5.93 84 8.94 0.99 1.6 1.04
66 GI:566192331 Thioredoxin-like 8 22.57/8.93 20.80/5.85 91 15.23 1.24 0.99 0.97
79 GI:283558285 Ribulose-1,5-bisphosphate carboxylase/oxygenase large subunit
16.31/5.46 20.22/4.64 86 23.13 1.51 0.97 0.85
68 GI:566171611 Ribulose bisphosphate carboxylase small chain 1A 20.39/8.65 20.47/5.36 120 19.34 1.41 1.16 1.09 63 GI:224083006 Chlorophyll a-b binding protein 2 28.09/5.29 34.02/6.79 85 13.26 1.73 1.23 1.1 35 GI:566192956 Coproporphyrinogen III oxidase 53.69/9.49 63.34/5.53 113 8.84 1.71 1.5 1.19 43 GI:224086078 Glyceraldehyde-3-phosphate dehydrogenase 48.17/6.76 58.61/5.99 132 9.73 1.3 2.86 1.1
60 GI:566180403 Chain A protein 40.47/8.71 46.20/5.97 107 12.67 1.99 1.14 1.06
34 GI:110227064 ATP synthase CF1 alpha chain 55.32/5.20 63.8/5.40 210 8.88 2.49 2.01 1.02 49 GI:566182581 Ribulose bisphosphate carboxylase/oxygenase
activase
51.94/5.26 61.55/6.61 146 8.42 1.55 1.03 0.55
DNA and ion binding
77 GI:224129938 Beta-expansin 4 precursor 29.03/5.82 37.26/5.22 105 15.33 0.52 0.25 0.1
13 GI:566212846 FtsH protease 73.18/5.67 75.11/5.41 176 7.55 0.9 1.36 1.32
5 GI:566157986 Zincfinger protein 100.79/6.48 100.38/6.08 186 5.57 2.25 1.26 0.68
73 GI:566175689 Calcium-binding protein 21.82/4.66 20.79/5.14 103 19.19 2.12 1.11 1.08
59 GI:224066943 Annexin 1 protein 35.97/6.15 44.32/5.95 190 13.92 2.39 1.16 1.14
19 GI:224124888 Ent-kaurenoic acid oxidase 56.98/8.99 65.61/4.58 165 9.13 2.06 1.27 1.24 80 GI:75330796 Putative calcium-binding protein 17.18/3.99 20.26/4.53 176 20.52 1.34 0.78 0.7 18 GI:566156245 Histone acetyltransferase 61.99/6.11 68.11/5.22 118 8.63 0.87 2.19 1.91
65 GI:224116496 MADS-box protein 27.27/9.50 30.69/6.32 104 14.11 1.23 2.46 1.59
42 GI:566167194 Glycerate dehydrogenase 48.80/6.11 58.88/5.86 89 8.97 1.77 2.32 0.97
45 GI:1346485 NADP-dependent malic enzyme 65.18/6.32 68.64/6.29 70 7.1 3.91 4.86 3.83
Antioxdant activity
1 GI:566169059 Cellulose synthase 6 122.48/6.65 109.29/5.65 104 5.81 2.34 2.15 1.81
48 GI:566173508 Catalase 2 48.76/6.21 58.88/6.28 99 11.71 0.79 1.82 1.03
69 GI:566159172 Glutathione S-transferase 23.21/6.23 22.59/5.32 176 19.25 1.78 0.86 0.85
56 GI:224087140 Peroxidase 34.94/5.98 43.52/6.35 89 15.58 2.2 2.67 2.72
61 GI:566183212 Peroxiredoxin 28.30/7.15 34.97/6.46 168 14.45 1.54 1.28 0.84
22 GI:566175737 Monodehydroascorbate reductase 47.050/6.51 57.55/4.56 178 10.6 1.73 0.79 0.32
57 GI:566170791 L-ascorbate peroxidase 31.51/7.06 40.62/4.54 125 16.72 3.62 2.6 2.4
Protein kinase
2 GI:566188866 Pyruvate phosphate dikinase 106.60/5.57 108.98/5.73 93 6.89 4.1 2.46 2.31 15 GI:566169617 NIMA-related protein kinase 69.60/9.51 72.7/4.35 82 6.94 2.16 2.12 0.98 17 GI:566196799 Mitogen-activated protein kinase 66.87/6.17 69.37/4.98 101 9.83 1.6 2.72 2.96
71 GI:224121954 Adenylate kinase 26.77/8.24 26.6/5.29 103 16.26 1.57 0.61 0.4
47 GI:224109060 Phosphoglycerate kinase 50.21/8.25 59.38/6.36 104 9.36 2.14 2.09 0.87
84 GI:566185071 Mitogen-activated protein kinase 6 64.12/8.79 65.44/6.43 105 11.21 1.24 1.53 1.66 85 GI:224130362 Mitogen-activated protein kinase 3 42.75/5.76 40.14/5.46 267 12.63 1 1.58 2.01
46 GI:224143653 Hexokinase 1 53.09/5.65 62.15/6.36 103 11.04 1.77 1.85 0.97
25 GI:224081987 Transcription factor bHLH 40.43/5.09 45.79/4.51 169 12.6 1.65 1.73 0.88 11 GI:566205899 homeobox-leucine zipper protein 77.74/6.33 76.23/4.93 173 8.77 0.85 0.81 2.23 50 GI:224131376 Heat shock transcription factor 50.78/5.82 59.9/6.63 142 10.16 1.54 1.03 0.52
Changes in ROS and MDA contents
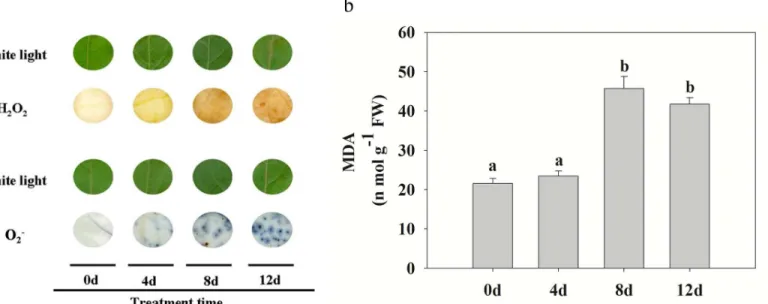
To determine whether CdCl2induced H2O2accumulation, the levels of H2O2and MDA inP.
yunnanensisleaves were determined. Compared with the control, H2O2and O2−, which reflect levels of cellular oxidation, both gradually accumulated when plants were exposed to Cd stress treatment (Fig 4a). MDA, as an end product of lipid peroxidation, was also increased by the Cd treatment. No significant differences were recorded in the MDA levels ofP.yunnanensisfrom Table 1. (Continued)
Spots No.
NCBI accession No.a
Protein name Theo. Mw/PIb Exp. Mw/pIc Scored SCe Ratiof
4d/ 0d
8d/ 0d
12d/ 0d
Predicted protein
7 GI:566150698 Hypothetical protein 88.89/5.45 85.03/5.27 123 8.31 1.94 2.37 1.75
76 GI:566185140 Hypothetical protein 20.87/9.55 20.61/5.63 97 17.35 0.84 0.38 0.26
83 GI:566201677 Hypothetical protein 128.15/5.82 129.14/6.36 105 6.76 6.99 2.84 2.58
a, Database accession numbers according to NCBInr. b, Experimental Mw/pI.
c, Theoretical Mw/pI.
d, The Mascot search score against the database of NCBInr. e, Sequences coverage.
f, protein spots showed a significant change in abundance (fold change) by a factor>1.5-fold compared to the control analyzed.
doi:10.1371/journal.pone.0137396.t001
Fig 4. Effect of Cd stress on ROS accumulation and MDA in poplar leaves.(a)In situdetection of changes in leaf ROS (H2O2and O2−) levels at different
times under Cd treatment. Images were obtained using a scanner at the indicated times. Images captured under white light were used as controls. The strong or weak of brown (H2O2) and blue (O2−) reflects the accumulation level of ROS products. (b) MDA content at different times under Cd treatment. Data
represent the means of three replicate experiments (n= 30/experiment). Means labeled with different letters are significantly different according to Tukey’s test (P<0.05). The raw data are provided inS3 Table.
0 to 4 d of treatment, but as shown inFig 4b, MDA levels increased rapidly from 4 to 8 d of treatment.
Changes in antioxidant enzyme activities
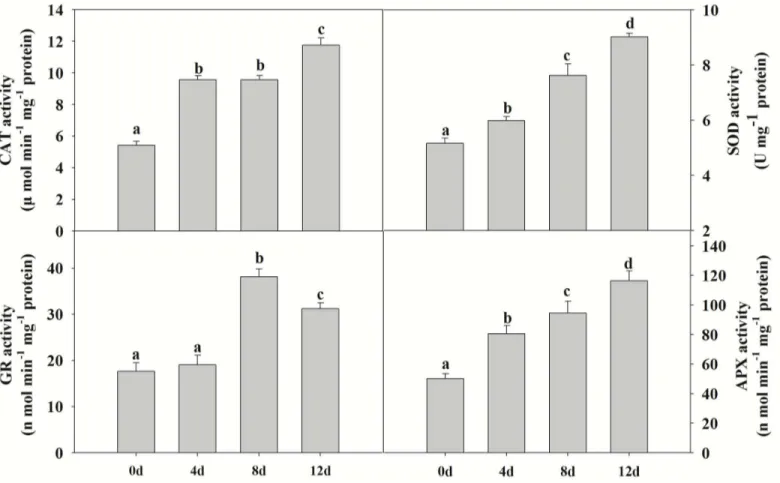
Environmental stress inhibits the growth and photosynthetic abilities of plants because of the breakdown of the balance between antioxidant defense and ROS production, which can lead to damage of proteins, membrane lipids and other cellular components [28]. The proteomic results (above) indicated that increasing Cd stress promotes the accumulation of antioxidant enzymes such as APX and CAT (Table 1, spots 57 and 48), and thus the capacity to reduce toxic levels of ROS. Thus, we measured the activities of CAT, APX, GR and SOD in leaves ofP.
yunnanensis. Significant increases in APX, CAT and SOD activities were observed with increasing Cd stress duration (Fig 5). GR activities increased markedly from 4 to 8d stress, and then decreased slightly after 12 d stress (Fig 5).
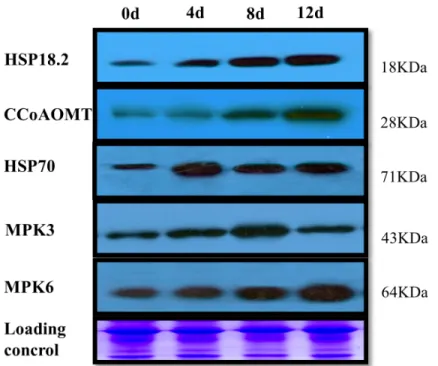
Western blot analysis of up-regulated proteins
The proteomic analysis also revealed that defense-related protein and kinase levels increased in response to Cd stress. Therefore, we performed western blot analysis with specific antibodies against plant MAPK6, MAPK3, HSP70, HSP18.2, and CCoAOMT (Fig 6andS3 Fig).
Fig 5. The effects of cadmium on antioxidant enzyme activities in poplar (CAT, APX, SOD and GR).Plants were treated with cadmium as above, and the antioxidant enzyme activities were determined using colorimetric methods. Values reflect means±SEs of at three independent experiments (n= 30/ experiment). Different symbols above the bars indicate significant differences (Tukey’s test,P<0.05). The raw data are provided inS4 Table.
Accumulation of these five proteins was induced to varying degrees by Cd stress treatment. Sim-ilar to the results of the proteomic analysis, these proteins showed different expression levels. MAPK6, HSP18.2 and CCoAOMT were induced rapidly from 0 to 12 d (Fig 6). The expression peaks of HSP70 and MAPK3 occurred at 4 and 8 d, respectively, after the start of the treatment (Fig 6).
Discussion
Photosynthesis and energy-associated protein changes during Cd
stress
In plants, photosynthetic capabilities are mainly regulated via photochemical reactions facili-tating energy production, gas exchange and CO2fixation and assimilation. Cd damages photo-synthetic capabilities, induces oxidative stress, inhibits stomatal opening and reduces the absorption of nitrates and iron [13,29]. In the present study, Cd caused a decrease in the photo-synthetic activity ofP.yunnanensis(Fig 1). Cd ions can affect photosynthesis via inhibiting the activity of RuBisCO and damaging its structure by substituting for Mg ions. Moreover, Cd caused an irreversible dissociation of the large and small subunits of RuBisCO, thus also lead-ing to total inhibition of the enzyme [13]. However, some proteins associated with protection and repair mechanisms related to the photochemical reaction pathway were differentially expressed, such as three RuBisCO proteins (Fig 2a, spots 49, 68 and 79) and glyceraldehyde 3-phosphate dehydrogenase (GADPH) (Fig 2a, spot 43), which were up-regulated inP. yunna-nensisleaves during Cd treatment, with expression peaks at 4 and 8 d, respectively (Fig 2aand
Table 1). Other authors observed similar results in Cd-treated poplar leaves: RuBisCO and binding proteins showed a decrease in abundance under longer-term (56 d) Cd stress [30]. RuBisCO for carboxylation and GADPH for carbon reduction are key enzymes for
Fig 6. Western blotting analysis of proteins from poplar leaves.Total protein samples were separated by SDS-PAGE and electroblotted onto a PVDF membrane. The part of equal amounts of protein downloading SDS gels was stained with Coomassie Blue as a loading control.
maintaining higher photosynthetic capacity in plant responses to environmental stresses [31]. InP.yunnanensis, the accumulation of RuBisCO and GADPH suggests a greater photosyn-thetic CO2fixation capability during the early stages, and then decreased during the later stages of Cd stress. Chlorophyll a-b binding protein and chlorophyllsaandbconstitute the light-har-vesting complex (LHC). The LHC functions as a light receptor that captures and delivers exci-tation energy to photosystems I and II, with which it is closely associated [32]. In the present study, the increase of chlorophyll a-b binding protein 2 (Fig 2a, spot 63) after 4 d of Cd stress suggests that this protein provides energy for the photosystems. Our results clearly demon-strate thatP.yunnanensisused multiple mechanisms to enhance its photosynthetic activity in response to Cd damage until the Cd stress exceeded plant tolerance limits (after 4 d).
Stress-responsive protein changes during Cd stress
Stress-responsive proteins, including heat shock protein (HSP) family members (HSP22, spot 64; HSP20, spot 74; HSP90, spot 10; HSP23.1, spot 72; HSP70, spot 14), a 14-3-3 protein (spot 58) and CCoAOMT (spots 67 and 62), were increased inP.yunnanensisfollowing exposure to Cd treatment. Heat-shock proteins play a crucial role in protecting plants against stress by re-establishing normal protein conformations and thus cellular homeostasis. HSP20 (Fig 2, spot 74), HSP70 (Fig 2, spot 14) and HSP90 (Fig 2a, spot 10) were increased inP.yunnanensisleaves under Cd stress, as confirmed by western blotting (Fig 6). HSP20, HSP70 and HSP90 have a similar function, maintaining the functional conformations of proteins and preventing the aggregation of non-native proteins, and can assist in protein refolding under stress conditions [33,34]. For instance, the correct folding of RuBisCO requires the HSP70 chaperone and a more efficient RuBisCO could potentially reduce photosynthetic water use, increasing plant tolerance to drought stress [35]. The increase in HSP70 may explain the enhanced RuBisCO content ofP.yunnanensisunder Cd stress conditions by helping with correct folding to main-tain the photosynthetic capability ofP.yunnanensisleaves.
In plant cells, 14-3-3 proteins have been widely implicated in various physiological pro-cesses, such as stress responses, signal transduction, metabolism, cell growth and development [36,37]. Aluminum (Al) stress enhanced the expression of 14-3-3 proteins to maintain a high level of plasma membrane H+-ATPase activity in Al-tolerant soybean roots. However, Al stress reduced the expression levels of 14-3-3 proteins and their binding to phosphorylated plasma membrane H+-ATPase in Al-sensitive soybean roots. The lack of protection through 14-3-3 protein binding led to unstable phosphorylation of PM H+-ATPase in Al-sensitive soybeans under Al stress [38]. In the present study, a 14-3-3 protein (Fig 2a, spot 58) and H+-ATPase (Fig 2a, spots 37 and 38) were up-regulated substantially following Cd treatment, supporting the possibility of cross-talk between 14-3-3 proteins and H+-ATPase during Cd exposure.
The cell wall acts as a mechanical protection against environmental stresses [39]. Research on the subcellular deposition and localization of heavy metals has shown that most Cd is local-ized in cell walls, and the cell wall is one of the major storage sites for Cd in the cell [40,41]. Liu
Antioxidant enzyme and related protein changes during Cd stress
Antioxidant enzymes maintain the cellular redox status at an acceptable level to avoid dam-age from the over-accumulation of ROS [48,49]. ROS can be produced by different pathways such as imbalance of the electron transport chains in both chloroplasts and mitochondria [50]. Thus, Cd could lead to the generation of ROS by production of a disturbance in the chloroplasts. In our proteomic analysis, we detected differential expression of seven antioxi-dant proteins. Peroxiredoxin (spot 61) can reduce hydrogen peroxide and alkyl hydroperox-ides using reducing equivalents provided through the thioredoxin or glutaredoxin system. It is up-regulated by drought-induced oxidative stress and decreases H2O2levels in rice chloro-plasts [51] and, as an electron acceptor in CDSP32-driven electron-transfer, protects the pho-tosynthetic apparatus from oxidative damage inArabidopsis[52]. CAT and APX, two major ROS-scavenging enzymes in plants, provide cells with a highly efficient system for removing superoxide and hydrogen peroxide. CAT and APX can catalyze the decomposition of H2O2 to H2O [53]. Antioxidant-detoxifying proteins showed an increased abundance such as per-oxidases and aldehyde dehydrogenases, as well as quinone reductases in poplar leaves after Cd stress [22]. Here, we measured the activities of enzymes including CAT, APX, SOD and GR, and the production of H2O2inP.yunnanensisto further investigate the relationship between H2O2and antioxidant enzymes. We found that the activities of these enzymes and the production of H2O2and O2−were increased by Cd treatment. Cd can interfere with the
antioxidant system, and indirectly produce ROS which cause oxidative damage to plants. The MDA content ofP.yunnanensisleaves gradually rose over the course of the Cd stress treat-ment, with the greatest increase recorded after 8 d stress (Fig 4b). Thus, our results indicate that Cd stress changes the original balance in the antioxidative metabolism ofP.yunnanensis
plants as well as increasing ROS production, and induces the expression of antioxidant pro-teins as an adaptive response to neutralize excess ROS and minimize damage during the early stages (0–4 d). However, severe oxidative damage occurred along with obvious phenotypic changes during the later stages (8–12 d).
Proteins kinase and transcription factor changes during Cd stress
MPK3 and MPK6 are two members of the TEY subtype MAPKs. Recently, it was proven that MPK3 and MPK6 are activated by Cd-induced ROS accumulation inArabidopsis[54]. Research has shown that MPK3 and MPK6 are involved in responses to many biotic and abi-otic stresses such as wounding, pathogen, ABA, cold, salt, osmabi-otic and oxidative stresses [55]. Heavy metal-induced MAPK signaling has been investigated in alfalfa and rice [56,57]. Our proteomic results demonstrate that two MAPKs, MPK3 and MPK6, were differentially regulated. Additionally, Roelofset al. speculated that downstream targets of MAPK signaling could be bZIP, MYB and MYC transcription factors during plant metal stress after compar-ing known signalcompar-ing pathways induced by metals stress and other abiotic stresses between soil invertebrates and plants [58]. We found much higher levels of a Cd-induced homeobox-leucine zipper protein (spot 11) inP.yunnanensisafter 12 d stress (Fig 2a). However, it is unknown whether this homeobox-leucine zipper protein would be regulated by the MPK3 and MPK6 identified in our study. Transcriptional control of the expression of stress-respon-sive genes is a crucial part of plant responses to abiotic and biotic stresses [59]. A heat shock transcription factor (spot 50) increased after the earlier stage of Cd exposure in the present study, which is consistent with the finding that Cd stress increases the expression levels of heat shock proteins. Taken together, the upregulation of these protein kinases and transcrip-tion factors suggests that these proteins functranscrip-tion to improve the tolerance ofP.yunnanensis
Conclusions
Our physiological and proteomic profiling of poplar (P.yunnanensis) has provided an insight into how woody plants respond to excessive Cd stress. We detected two stages in the response to Cd stress, and propose a model to explain the poplar response to Cd stress based on our results (Fig 7). During the first stage, transiently induced defense-response molecules, photo-synthesis- and energy-associated proteins, antioxidant enzymes and HSPs accumulate to enhance protein stability and establish a new cellular homeostasis. This activity explains why plant photosynthetic capability during this period barely changed. During the second stage, a decline in RuBisCO and HSP levels leads to an imbalance of the plant photosynthetic system. Antioxidant enzyme activities increased seem not be able to entirely counteract Cd-induced ROS overproduction in plants. However, higher expression of CCoAOMT may regulate plant cell wall synthesis for greater Cd storage. Meanwhile, the expression of MPK3, MPK6 and a homeobox-leucine zipper protein was higher in the second stage. These genes may be candi-dates for further research and use in genetic manipulation of poplar tolerance to Cd stress.
Supporting Information
S1 Fig. 2-DE gel maps following cadmium treatment.The 2-DE gel of total proteins from leaves treated with 100μM Cd for 0 d, 4 d, 8d and 12 d, repectively. A: Control (0 d); B: after
100M Cd for 4 d; C: after 100μM Cd for 8 d; D: after 100μM Cd for 12 d. Those that changed
significantly in response to Cd are indicated by red arrows. R1, R2 and R3 mean three repli-cates.
(TIF)
Fig 7. Proposed model demonstrating that poplar applies multiple strategies in response to Cd conditions.
S2 Fig. Proteins involved in stress according to MapMan in leaves after 0d, 4d, 8d and 12d of treatment.
(TIF)
S3 Fig. Western blotting analysis of proteins from poplar leaves of different treatments.R1, R2 and R3 mean three replicates. The part of equal amounts of protein downloading SDS gels was stained with Coomassie Blue as a loading control.
(TIF)
S1 Table. Identification of differentially expressed proteins in poplar after Cd treatment.
(XLSX)
S2 Table. Proteins involved in biotic tress signaling according to MapMan in leaves after 0d, 4d, 8d and 12d of treatment.
(XLSX)
S3 Table. The raw data for MDA detection ofP.yunnanensisafter Cd treatment.
(XLSX)
S4 Table. The raw data for CAT, APX, SOD and GR detection ofP.yunnanensisafter Cd treatment.
(XLSX)
Acknowledgments
This work was financially supported by the National Natural Science Foundation of China (NSFC) (No. 41271058), the Major State Basic Research Development Program of China (Nos. 2010CB951704), and the National Science Foundation of China (No. 31260167).
Author Contributions
Conceived and designed the experiments: YPY. Performed the experiments: YQY XL XS. Ana-lyzed the data: YQY XL SY YZ CD JR. Contributed reagents/materials/analysis tools: X SY YZ CD JR. Wrote the paper: YQY YPY.
References
1. Benavides MP, Gallego SM, Tomaro ML. Cadmium toxicity in plants. Brazilian J Plant Physiol. 2005; 17: 21–34.
2. Das P, Samantaray S, Rout GR. Studies on cadmium toxicity in plants: A review. Environ Pollut. 1997; 98: 29–36. PMID:15093342
3. Prasad MNV. Cadmium toxicity and tolerance in vascular plants. Environ Exp Bot. 1995; 35: 525–545. 4. Weast RC, Astle MJ, Beyer WH. CRC handbook of chemistry and physics: CRC press Boca Raton,
FL. 1988.
5. Kirkham M. Cadmium in plants on polluted soils: Effects of soil factors, hyperaccumulation, and amend-ments. Geoderma. 2006; 137: 19–32.
6. Li Z, Li L, Chen GPJ. Bioavailability of Cd in a soil–rice system in China: soil type versus genotype effects. Plant Soil. 2005; 271: 165–173.
7. Schnoor JL. Australasian soil contamination gets attention. Enviro Sci Technol. 2004; 38: 53A–53A. 8. Liu C, Guo J, Cui Y, Lu T, Zhang X, Shi G. Effects of cadmium and salicylic acid on growth, spectral
reflectance and photosynthesis of castor bean seedlings. Plant Soil. 2011; 344: 131–141.
9. Pietrini F, Iannelli MA, Pasqualini S, Massacci A. Interaction of cadmium with glutathione and photosyn-thesis in developing leaves and chloroplasts of Phragmites australis (Cav.) Trin. ex Steudel. Plant Phy-siol. 2003; 133: 829–837. PMID:14526113
10. Gratão PL, Monteiro CC, Rossi ML, Martinelli AP, Peres LE, Medici LO, et al. Differential ultrastructural
11. Gratão PL, Polle A, Lea PJ, Azevedo RA. Making the life of heavy metal-stressed plants a little easier.
Funct Plant Biol. 2005; 32: 481–494.
12. Howden R, Goldsbrough PB, Andersen CR, Cobbett CS. Cadmium-Sensitive, cad1 mutants of Arabi-dopsis thaliana are phytochelatin deficient. Plant Physiol. 1995; 107: 1059–1066. PMID:7770517 13. Sanitàdi Toppi L, Gabbrielli R. Response to cadmium in higher plants. Environ Exp Bot. 1999; 41:
105–130.
14. Herbette S, Taconnat L, Hugouvieux V, Piette L, Magniette ML, Cuine S, et al. Genome-wide transcrip-tome profiling of the early cadmium response of Arabidopsis roots and shoots. Biochimie. 2006; 88: 1751–1765. PMID:16797112
15. Zhao CR, Sawaki Y, Sakurai N, Shibata D, Koyama H. Transcriptomic profiling of major carbon and amino acid metabolism in the roots of Arabidopsis thaliana treated with various rhizotoxic ions. Soil Sci Plant Nutr. 2010; 56: 150–162.
16. Kieffer P, Dommes J, Hoffmann L, Hausman JF, Renaut J. Quantitative changes in protein expression of cadmium-exposed poplar plants. Proteomics. 2008; 8: 2514–2530. doi:10.1002/pmic.200701110 PMID:18563750
17. Yamaguchi H, Fukuoka H, Arao T, Ohyama A, Nunome T, Miyatake K, et al. Gene expression analysis in cadmium-stressed roots of a low cadmium-accumulating solanaceous plant, Solanum torvum. J Exp Bot. 2010; 61: 423–437. doi:10.1093/jxb/erp313PMID:19837731
18. Chen L, Han Y, Jiang H, Korpelainen H, Li C. Nitrogen nutrient status induces sexual differences in responses to cadmium in Populus yunnanensis. J Exp Bot. 2011; 62: 5037–5050. doi:10.1093/jxb/ err203PMID:21778178
19. Duan B, Xuan Z, Zhang X, Korpelainen H, Li C. Interactions between drought, ABA application and sup-plemental UV-B in Populus yunnanensis. Physiologia plantarum. 2008; 134: 257–269. doi:10.1111/j. 1399-3054.2008.01128.xPMID:18485056
20. Li L, Zhang Y, Luo J, Korpelainen H, Li C. Sex-specific responses of Populus yunnanensis exposed to elevated CO2 and salinity. Physiol plantarum. 2013; 147: 477–488.
21. Jiang H, Korpelainen H, Li C. Populus yunnanensis males adopt more efficient protective strategies than females to cope with excess zinc and acid rain. Chemosphere. 2013; 91: 1213–1220. doi:10. 1016/j.chemosphere.2013.01.041PMID:23415309
22. Kieffer P, Schröder P, Dommes J, Hoffmann L, Renaut J, Hausmana JF, et al. Proteomic and enzy-matic response of poplar to cadmium stress. J proteomics. 2009; 72: 379–396. PMID:19367735 23. Li X, Yang Y, Sun X, Lin H, Chen J, Ren J, et al. Comparative Physiological and Proteomic Analyses of
Poplar (Populus yunnanensis) Plantlets Exposed to High Temperature and Drought. PLos One. 2014; 9: e107605. doi:10.1371/journal.pone.0107605PMID:25225913
24. Wang XQ, Yang PF, Liu Z, Liu WZ, Hu Y, Chen H, et al. Exploring the mechanism of physcomitrella pat-ens desiccation tolerance through a proteomic strategy. Plant Physiol. 2009; 149: 1739–1750. doi:10. 1104/pp.108.131714PMID:19211702
25. Conesa A, Götz S, García-Gómez JM, Terol J, Talón M, Robles M. Blast2GO: a universal tool for anno-tation, visualization and analysis in functional genomics research. Bioinformatics. 2005; 21: 3674– 3676. PMID:16081474
26. Zhang A, Zhang J, Ye N, Cao J, Tan M, Zhang JH, et al. ZmMPK5 is required for the NADPH oxidase-mediated self-propagation of apoplastic H2O2 in brassinosteroid-induced antioxidant defence in leaves of maize. J Exp Bot. 2010; 61: 4399–4411. doi:10.1093/jxb/erq243PMID:20693409
27. Duan BL, Lu YW, Yin CY, Junttila O, Li CY. Physiological responses to drought and shade in two con-trasting Picea asperata populations. Physiol Plantarum. 2005; 124: 476–484.
28. Gong H, Zhu X, Chen K, Wang S, Zhang C. Silicon alleviates oxidative damage of wheat plants in pots under drought. Plant Sci. 2005; 169: 313–321.
29. Lombi E, Tearall KL, Howarth JR, Zhao FJ, Hawkesford MJ, McGrath SP. Influence of iron status on cadmium and zinc uptake by different ecotypes of the hyperaccumulator Thlaspi caerulescens. Plant Physiol. 2002; 128: 1359–1367. PMID:11950984
30. Kieffer P, Planchon S, Oufir M, Ziebel J, Dommes J, Hoffmann L, et al. Combining proteomics and metabolite analyses to unravel cadmium Stress-Response in Poplar Leaves. J Proteome Res. 2008; 8: 400–17.
31. Xu L, Yu J, Han L, Huang B. Photosynthetic enzyme activities and gene expression associated with drought tolerance and post-drought recovery in Kentucky bluegrass. Environ Exp Bot. 2013; 89: 28– 35.
33. Wang W, Vinocur B, Shoseyov O, Altman A. Role of plant heat-shock proteins and molecular chaper-ones in the abiotic stress response. Trends Plant Sci. 2004; 9: 244–252. PMID:15130550
34. Key JL, Lin CY, Chen YM. Heat shock proteins of higher plants. PNAS. 1981; 78: 3526–3530. PMID: 16593032
35. Windhof A. Rubisco folding and oligomeric assembly: Detailed analysis of an assembly intermediate: lmu. 2011.
36. Chen Q, Guo CL, Wang P, Chen XQ, Wu KH, Li KZ, et al. Up-regulation and interaction of the plasma membrane H+-ATPase and the 14-3-3 protein are involved in the regulation of citrate exudation from the broad bean (Vicia faba L.) under Al stress. Plant Physiol Bioch 2013; 70: 504–511.
37. Yang JL, Chen WW, Chen LQ, Qin C, Jin CW, Shi YZ, et al. The 14-3-3 protein GENERAL REGULA-TORY FACTOR11 (GRF11) acts downstream of nitric oxide to regulate iron acquisition in Arabidopsis thaliana. New Phytol. 2013; 197: 815–824. doi:10.1111/nph.12057PMID:23252371
38. Guo CL, Chen Q, Zhao XL, Chen XQ, Zhao Y, Wang L, et al. Al-enhanced expression and interaction of 14-3-3 protein and plasma membrane H+-ATPase is related to induced citrate secretion in an Al-resistant black Soybean. Plant Mol Biol Rep. 2013; 31: 1012–1024.
39. Showalter AM. Structure and function of plant cell wall proteins. Plant Cell. 1993; 5: 9. PMID:8439747 40. Zhou YQ, Huang SZ, Yu SL, Gu JG, Zhao JZ, Han YL, et al. The physiological response and
sub-cellu-lar localization of lead and cadmium in Iris pseudacorus L. Ecotoxicology. 2010; 19: 69–76. doi:10. 1007/s10646-009-0389-zPMID:19629681
41. Lukačová Z,Švubová R, Kohanová J, Lux A. Silicon mitigates the Cd toxicity in maize in relation to cad-mium translocation, cell distribution, antioxidant enzymes stimulation and enhanced endodermal apo-plasmic barrier development. Plant Growth Regul. 2013; 70: 89–103.
42. Liu C, Shen Z, Li X. Accumulation and detoxification of cadmium in Brassica pekinensis and B. chinen-sis. Biol plantarum. 2007; 51: 116–120.
43. Ranocha P, Chabannes M, Chamayou S, Danoun Sd, Jauneau A, Boudet AM, et al. Laccase down-regulation causes alterations in phenolic metabolism and cell wall structure in poplar. Plant Physiol. 2002; 129: 145–155. PMID:12011346
44. Zhang Xl, Zhou J, Han Z, Shang Q, Wang ZG, Gu XH, et al. Active methyl cycle and transfer related gene expression in response to drought stress in rice leaves. Rice Sci. 2012; 19: 86–93.
45. Costa P, Bahrman N, Frigerio JM, Kremer A, Plomion C. Water-deficit-responsive proteins in maritime pine. Plant mol biol. 1998; 38: 587–596. PMID:9747804
46. Vincent D, Lapierre C, Pollet B, Cornic G, Negroni L, Zivy M. Water deficits affect caffeate O-methyl-transferase, lignification, and related enzymes in maize leaves. A proteomic investigation. Plant Phy-siol. 2005; 137: 949–960. PMID:15728345
47. Senthil KM, Hema R, Suryachandra TR, Ramegowda H, Gopalakrishna R, Rama N, et al. Functional characterization of three water deficit stress-induced genes in tobacco and Arabidopsis: An approach based on gene down regulation. Plant Physiol Bioch. 2010; 48: 35–44.
48. Xiong L, Schumaker KS, Zhu JK. Cell signaling during cold, drought, and salt stress. Plant Cell. 2002; 14: S165–S183. PMID:12045276
49. Desikan R, Hancock J, Neill S. Reactive oxygen species as signalling molecules. In: Antioxidants and reactive oxygen species in plants. Blackwell, Oxford, 2005. pp.169–196.
50. Hernandez J, Olmos E, Corpas F, Sevilla F, Del RL. Salt-induced oxidative stress in chloroplasts of pea plants. Plant Sci. 1995; 105: 151–167.
51. Ali GM, Komatsu S. Proteomic analysis of rice leaf sheath during drought stress. J Proteome Res. 2006; 5: 396–403. PMID:16457606
52. Broin M, Cuiné S, Eymery F, Rey P. The plastidic 2-cysteine peroxiredoxin is a target for a thioredoxin involved in the protection of the photosynthetic apparatus against oxidative damage. Plant Cell. 2002; 14: 1417–1432. PMID:12084836
53. Raven EL. Peroxidase-catalyzed oxidation of ascorbate structural, spectroscopic and mechanistic cor-relations in ascorbate peroxidase. In: Enzyme-Catalyzed Electron and Radical Transfer: Springer. 2000. pp. 317–349.
54. Liu XM, Kim KE, Kim KC, Nguyen XC, Han HJ, Jung MS, et al. Cadmium activates Arabidopsis MPK3 and MPK6 via accumulation of reactive oxygen species. Phytochemistry. 2010; 71: 614–618. doi:10. 1016/j.phytochem.2010.01.005PMID:20116811
55. Colcombet J, Hirt H. Arabidopsis MAPKs: a complex signalling network involved in multiple biological processes. Biochem J. 2008; 413: 217–226. doi:10.1042/BJ20080625PMID:18570633
57. Lin CW, Chang HB, Huang HJ. Zinc induces mitogen-activated protein kinase activation mediated by reactive oxygen species in rice roots. Plant Physiol Bioch. 2005; 43: 963–968.
58. Roelofs D, Aarts M, Schat H, Van Straalen N. Functional ecological genomics to demonstrate general and specific responses to abiotic stress. Funct Ecol.2008; 22: 8–18.