between the Responses Induced by H
2
O
2
and by
Long-Term
Rice Black-Streaked Dwarf Virus
Infection in Rice
Qiufang Xu
*, Haiping Ni, Qingqing Chen, Feng Sun, Tong Zhou, Ying Lan, Yijun Zhou
*Institute of Plant Protection, Jiangsu Academy of Agricultural Sciences, Jiangsu Technical Service Center of Diagnosis and Detection for Plant Virus Diseases, Nanjing, P. R. China
Abstract
Hydrogen peroxide (H2O2) could be produced during the plant-virus compatible interaction. However, the cell
responses regulated by the enhanced H2O2 in virus infected plant are largely unknown. To make clear the influence
of Rice black-streaked dwarf virus (RBSDV) infection on H2O2 accumulation, we measured the content of H2O2 and
found the H2O2 level was increased in rice seedlings inoculated with RBSDV. To reveal the responses initiated by the
enhanced H2O2 during plant-virus interaction, the present study investigated the global proteome changes of rice
under long-term RBSDV infection. Approximately 1800 protein spots were detected on two-dimensional electrophoresis (2-DE) gels. Among them, 72 spots were found differently expressed, of which 69 spots were successfully identified by MALDI-TOF/TOF-MS. Furthermore, the differentially expressed proteins induced by RBSDV infection were compared to that induced by H2O2. 19 proteins corresponding to 37 spots, which were
differentially expressed under RBSDV infection, were observed differentially expressed under H2O2 stress as well.
These overlapping responsive proteins are mainly related to photosynthesis, redox homeostasis, metabolism, energy pathway, and cell wall modification. The increased H2O2 in RBSDV infected plant may produce an oxidative stress,
impair photosynthesis, disturb the metabolism, and eventually result in abnormal growth. The data provide a new understanding of the pivotal role of H2O2 in rice-RBSDV compatible interaction.
Citation: Xu Q, Ni H, Chen Q, Sun F, Zhou T, et al. (2013) Comparative Proteomic Analysis Reveals the Cross-Talk between the Responses Induced by H2O2 and by Long-Term Rice Black-Streaked Dwarf Virus Infection in Rice. PLoS ONE 8(11): e81640. doi:10.1371/journal.pone.0081640
Editor: Vladimir N. Uversky, University of South Florida College of Medicine, United States of America Received September 10, 2013; Accepted October 15, 2013; Published November 27, 2013
Copyright: © 2013 Xu et al. This is an open-access article distributed under the terms of the Creative Commons Attribution License, which permits unrestricted use, distribution, and reproduction in any medium, provided the original author and source are credited.
Funding: This research was financially supported by grants from the Jiangsu Agriculture Science and Technology Innovation Fund (CX(13)5019), the National Natural Science Foundation of China (31000841, 31201484), the Special Fund for Agro-Scientific Research in the Public Interest of China (201003031), and National Key Basic Research and Development Program (973 Program) of China (2010CB126203). The funders had no role in study design, data collection and analysis, decision to publish, or preparation of the manuscript.
Competing interests: The authors have declared that no competing interests exist. * E-mail: [email protected] (YZ), [email protected] (QX)
Introduction
Hydrogen peroxide (H2O2) is one of the most important types
of reactive oxygen species (ROS) and has attracted much attention during the last decades. It is well known that ROS plays a pivotal role in the defense response of plants against pathogen [1,2]. The accumulation of H2O2 during the
plant-pathogen incompatible interaction was correlated with the establishment of disease resistance [3,4]. H2O2 can act as a
local signal for hypersensitive response as well as a diffusible signal for the induction of defensive genes in adjacent cells [5]. Previous studies demonstrated that H2O2 has dual functions in
plant. As a signaling molecule, it has been proved to modulate gene expression and participate in various processes, such as cell growth, pathogen defense, programmed cell death, hormonal responses, photosynthesis regulation, and signal transduction [6-8]. On the other hand, H2O2 is highly reactive
and toxic. The steady-state level of H2O2 should be tightly
controlled in plant. Excessive production of H2O2 can alter the
redox state of the cells, damage a large variety of subcellular constitutions such as proteins and nucleic acids, and lead to oxidative destruction of cells [9]. In the compatible interaction, the production of H2O2 was considered to be a non-specific
response and the function of H2O2 produced during pathogen
infection was rarely studied.
In plant-virus incompatible interaction, the generation of H2O2
is associated with resistance to virus. Extraneous low concentrations of H2O2 in tobacco could suppress necroses
caused by Tobacco mosaic virus [10]. Resistant rice variety inoculated with Rice stripe virus resulted in an increase of H2O2
[11]. However, a rapid accumulation of H2O2 and an imbalance
in the antioxidative systems had also been observed in plant-virus compatible interaction [12]. The H2O2 level was found
enhanced during the development of the disease and is accompanied with an imbalance in the antioxidative systems [13]. Moreover, the increase of H2O2 is more remarkable in the
virus susceptible plant than in the resistant plant [14]. Nevertheless, relatively little information is known about the involvement of H2O2 in symptom development and
pathogenesis in plant-virus compatible interactions.
RBSDV, a member of the genus Fijivirus in the family Reoviridae, could infect rice and maize, and leads to rice black streaked dwarf disease and maize rough dwarf diseases, respectively [15,16]. Recently, the diseases caused by RBSDV have proliferated rapidly and have become economically destructive diseases in China [17]. The virus is mainly transmitted by Laodelphax striatellus Fallen, the small brown planthopper (SBPH), in a persistent and circulative manner [18,19]. The plants infected with RBSDV are characterized by inhibited plant growth, darkened leaves, white tumors or black streaked swellings along the veins on the back of leaf blades and stems [20]. Proteomic and microarray investigations revealed that ascorbate peroxidases (APX) and catalases (CAT) were up-regulated undergoing long-term RBSDV infection in maize plant [21,22]. CAT and APX are major H2O2
-scavenging enzymes and are believed to be crucial in determining the steady-state level of H2O2 [8]. The upregulation
of these proteins indicates that H2O2-scavenging pathway is
active in plant cells to maintain the H2O2 balance. Interestingly,
the viral protein p5b encoded by RBSDV genomic segment S5 could interact with CAT and APX in rice plant [23], and the protein encoded by segment S6 could interact with thylakoid-bound ascorbate peroxidase [24]. The biological significance of the interactions is still unknown. A stimulating hypothesis is that the interactions between RBSDV and the H2O2-scavenging
enzymes inhibit or increase the H2O2 scavenging, and cause
an imbalance of H2O2.
In this study, to confirm the hypothesis, the content of H2O2
was measured, and the increase of H2O2 was observed after
long-term RBSDV infection. Previous work had revealed the protein network elicited by H2O2 in rice by a proteomic method
[25]. In order to investigate the cell processes the H2O2
involved in during systemic virus infections, a proteomic approach was applied to analyze the global cellular response to RBSDV infection in rice, and the changes in protein expression were compared to that induced by H2O2 stress at
proteome level. A series of responsive proteins were found regulated by both RBSDV infection and H2O2 stress. The
results presented in this study provide the framework for further functional studies of H2O2 produced under long-term virus
infection.
Materials and Methods
Plant materials, virus inoculation and plant growth conditions
The susceptible rice cultivar Huai 5 (Oryza sativa japonica) was used for virus inoculation. Rice seeds were submerged in water inside a container for two days, and then sown in a 1 L beaker and kept in a greenhouse at 25°C with a light/dark cycle of 16/8 h. Nine-day-old rice seedlings were exposed to
viruliferous SBPHs (approximately three viruliferous insects per seedling) in each of the inoculation chamber for 3 days. The seedlings that were mock-inoculated with the virus-free SBPH were used as controls. After the insects were removed from the plants by gentle brushing, the inoculated seedlings were transplanted to an insect-free glasshouse at 25 ± 3 °C under natural sunlight. The aerial parts of the whole plants were collected 50 days post-inoculation (dpi), a time when the dwarf symptom could be significantly observed in virus-inoculated seedlings.
To verify that the dwarf symptoms were caused by RBSDV infection, RBSDV genome segments S9-1 and S10 was examined by RT-PCR analysis [26,27]. PCR was performed with the virus specific primers listed in Table S1. The expected sizes of S9-1 and S10 were 1044 bp and 1677 bp, respectively. The amplified fragments of the expected size were confirmed by electrophoresis in 1% (w/v) agarose gels.
Protein samples preparation
Proteome analysis was performed in three biological repeats. The aerial part of the rice seedlings were used for protein extraction. Proteins were extracted using the TCA/acetone precipitation method according to Damerval et al. with several modifications [28]. One gram of rice was ground to a fine powder in liquid nitrogen, and the powder was later precipitated by 30 ml of cold acetone (-20°C) with 10% w/v TCA and 0.07% β-mercaptoethanol at -20 °C overnight. After centrifugation at 13,000 g at 4 °C for 30 min, the pellets were washed three times with 30 ml of ice-cold acetone containing 0.07% β-mercaptoethanol and lyophilized. The resulting powder was dissolved in lysis buffer (7 M urea, 2 M thiourea, 4% w/v CHAPS, 65 mM DTT and 2% IPG buffer (pH 3-10)). After incubation at 30 °C for 1 h, the suspension was centrifuged at 40,000 g at 4 °C for 30 min to remove the insoluble debris. The protein concentration was quantified using a 2-D Quant kit (GE Healthcare).
2-DE, gel staining and image analysis
watts/gel until the dye front reached approximately 1cm from the bottom of the gels.
2-DE gels were stained by a modified colloidal Coomassie G-250 staining [30] and scanned by UMAX PowerLook 2100XL scanner (UMAX Systerms, Germany). A total of six gels (three of the best-matched replicate gels from three independent experiments for each treatment) were analyzed using ImageMaster 2D Platinum software version 7.0 (GE Healthcare). The images were analyzed according to the manufacturer’s instructions. Spot detection and gel matching were performed automatically. Protein expression was quantified using the normalized percentage volumes (vol. %), a ratio of the volume of a particular spot to the total volume of all of the spots present on a gel. The match analysis was manually edited to correct the mismatched spots. To calculate the significant differences, the expression levels of the mock-and RBSDV- inoculation groups were analyzed using Student’s t-test. The protein spots with vol. % ≥1.5 and P ≤ 0.05 were defined as differentially expressed proteins (DEPs).
In-gel digestion, MALDI-TOF/TOF-MS and data analysis The DEPs were manually excised from their gels for proteolytic digestion [29]. The excised gel pieces were destained with 200 μl of 100 mM ammonium bicarbonate (NH4HCO3) in 30% acetonitrile. After removing the destaining
buffer, the gel pieces were dried in a SpeedVac and rehydrated with 30 μl of 50 mM NH4HCO3 containing 50 ng trypsin
(sequencing grade; Promega, Madison, WI, USA). The peptides were extracted three times with 0.1% trifluoroacetic acid (TFA) in 60% acetonitrile after an overnight digestion at 37 °C. The supernatants were pooled together and lyophilized, and the resulting peptides were dissolved in 50% acetonitrile containing 0.5% TFA and kept at -80 °C until use in mass spectrometry. A protein-free gel piece was used as a control to identify the autoproteolysis products derived from trypsin.
MALDI-TOF/TOF-MS was conducted with a 4800 MALDI TOF/TOF™ Analyzer (Applied Biosystems, Foster City, CA, USA) according to Meisrimler et al. [31]. The spectra of the proteins were searched against the NCBI nonredundant protein (NCBInr) database with the taxonomy Oryza sativa 2010.12.10 using MASCOT 2.1 (MatrixScience, London, UK). The spectra that were not identifiable were researched in the NCBInr database with the taxonomy of all entries. The search parameters were set as follows: enzyme: trypsin; fix modifications: carbamidomethyl (C); mass values: monoisotopic; peptide mass tolerance: ± 100 ppm; fragment mass tolerance: ± 0.8 Da; peptide charge state: 1+; max missed cleavages: 1. Proteins identified by MALDI-TOF/TOF-MS with C.I. % scores above 95% were deemed significant.
Measurements of photosynthesis and H2O2 level The net photosynthetic rates, stomatal conductance, intercellular CO2 concentrations and transpiration speeds of the
third and fourth rice leaves of each sample were measured using a LI-6400 XT portable photosynthesis system with a Red/ Blue LED light source (LI-COR Inc., Lincoln, NE, USA). At least ten leaves were measured for each sample.
The H2O2 accumulation in mock- or virus- inoculated leaves
was measured according to Wan et al. [25]. One gram of rice seedling leaves were ground with a pestle and mortar in liquid nitrogen to a fine powder, and suspended in 10 ml of 5 mM titanium sulfate. After incubation for 1 h at room temperature, debris was discarded by centrifugation at 12,000 g for 10 min at 25°C. The oxidation of titanium sulfate was recorded by reading the A410 using a PerkinElmer Lambda 25 UV/VIS spectrometer. The H2O2 concentrations were calculated
according to a standard calibration plot, and expressed as μmol H2O2 g-1 FW.
Quantitative real-time PCR
Quantitative real-time PCR was performed to quantify the transcriptional levels of genes corresponding to the DEPs. The sequences of the identified proteins were searched against the NCBI database using tBLASTn. The corresponding gene sequences were selected for primer design, and the primers designed using primer express 3.0 software were shown in Table S1. Total RNA was extracted with Trizol (Invitrogen) and treated with DNase I (Promega, WI, USA) to eliminate the DNA. The integrity of the RNA samples was assessed by agarose gel electrophoresis, and RNA concentrations were measured using a spectrophotometer. Reverse transcription was performed using 1 μg of RNA. The cDNA was synthesized using an M-MLV RTase cDNA synthesis kit (TaKaRa). The iQ5 Real-Time PCR System (Bio-Rad) was used to perform RT-qPCR. The rice UBQ5 gene was used as internal standard, and experiments were performed in triplicate. Amplification was performed in a 20 μl reaction mixture containing 1μl of cDNA, 1 μl of forward and reverse primers, 8 μl of ddH2O and 10 μl of
SsoFastTM EvaGreen supermix (Bio-Rad). After an initial
denaturation at 95 °C for 20 s, 40 cycles of amplification were carried out: denaturation at 95 °C for 10 s, annealing at 58 °C for 15 s and extension at 72 °C for 15 s. Melting curves were obtained and quantitation of the data was performed using the iQ5 software (Bio-Rad) with the relative quantification (ddCt) model.
Results
RBSDV infection elevated the H2O2 level in rice
The rice seedlings infected with RBSDV exhibited notable stunting symptoms (Figure 1A). The height and width of the infected plants were only 46.2% and 56.7% of that of the control. The virus genome segments S9-1 and S10 could be detected by RT-PCR in the virus-infected rice leaves but not in the mock-infected plants (Figure 1B), indicating that the virus successfully infected the rice plant and consequently led to the dwarf. To verify whether the level of H2O2 was changed by
RBSDV-infection in rice, the content of H2O2 was measured. An
increasing H2O2 was found in RBSDV infected rice plant. The
H2O2 concentration in virus infected plants was 2.64 μmol g-1
FW whereas it was 1.75 μmol g-1 FW in the control. As shown
in Figure 1C, the H2O2 content in RBSDV infected plants was
Proteomic analysis of rice plants in response to RBSDV infection
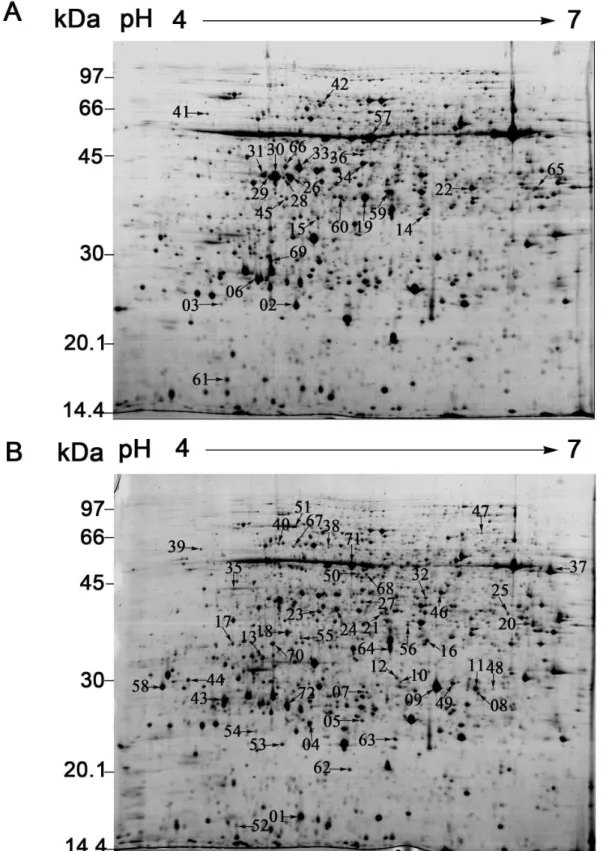
To reveal the changes in protein expression under RBSDV stress in rice, the proteome profiles of mock- and virus-infected plants were analyzed by 2-DE. Approximately 1800 detectable spots were visualized on each gel by Coomassie Brilliant Blue staining (Figure 2). Three independent experiments were conducted to ensure that the protein abundance changes were reproducible and significant. 72 spots that showed at least a 1.5-fold increase or decrease in abundance (P≤0.05) were considered to change significantly between the mock- and virus-infected plants. Of these spots, 25 spots were down-regulated (marked in Figure 2A) and 47 spots were up-regulated (marked in Figure 2B).
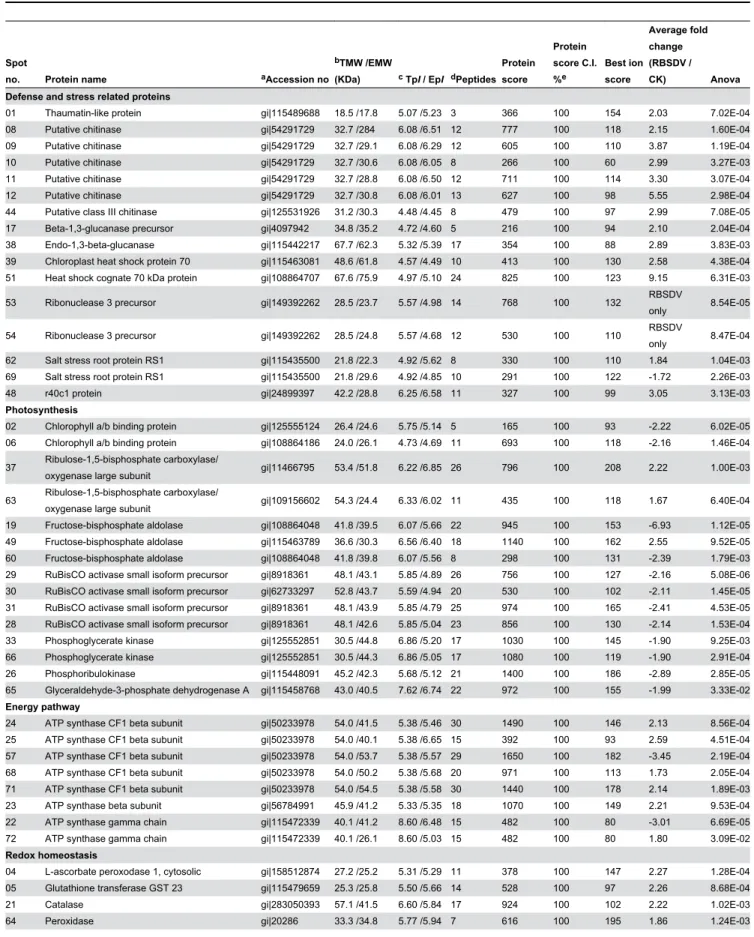
To identify the proteins that were differentially expressed due to the RBSDV infection, all 72 spots with a threshold greater than 1.5-fold were excised and analyzed by MALDI-TOF/TOF-MS. 69 spots were successfully identified. 43 of these spots have been deposited in the current database as putative functional proteins. The remainder of the spots was without specific function in the database and was annotated using the Uniprot Knowledgebase (www.uniprot.org) or the NCBI (www.ncbi.nlm.nih.gov) database with BLASTP. The results of the identification of the 69 spots were shown in Table 1. The corresponding homologues with annotations were listed in Table S2 and the peptide sequences identified by MOLDI-TOF/ TOF-MS were shown in Table S3. According to the
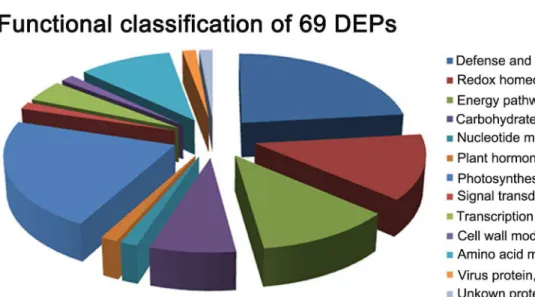
annotations, the identified proteins were involved in the following 12 categories according to their functional features, including defense and stress related proteins, photosynthesis, redox homeostasis, energy pathway, amino acid metabolism, carbohydrate metabolism, nucleotide metabolism, transcription and translation, cell wall modifications, plant hormone responses, signal transduction and virus proteins (Table 1, Figure 3A). About 80% different proteins were related to defense and stress response, photosynthesis, redox homeostasis, energy pathway and amino acid metabolism. The virus infection seems to have triggered the defense and stress response, and impaired the photosynthesis, as most of the DEPs related to defense and stress response were found up-regulated, and most of those proteins related to photosynthesis were down-regulated (Table 1).
The overlapping responsive proteins under H2O2 stress
and RBSDV infection
An H2O2 stress-responsive protein network in rice seedling
had been revealed by Wan et al. [25]. To obtain the overlapping proteomic profile of rice under RBSDV infection and H2O2 stress, we compared the DEPs identified in this study
with the responsive proteomic profile of rice under H2O2
treatment published previously [25]. Under RBSDV infection, 45 proteins corresponding to 69 identified spots was differentially expressed (Table 1). Of these proteins, 19 proteins corresponding to 37 spots were also differentially
Figure 1. Long-term RBSDV infection resulted in an increase of H2O2 in rice. (A) An RBSDV - infected rice plant (right) is
compared to the mock-inoculated plant (left) at 50 dpi. (B) RT-PCR analysis of the RBSDV genome segments S9-1 and S10 in mock-inoculated rice (lanes 1 and 2) and in RBSDV-inoculated rice (lanes 3 and 4). (C) The accumulation of endogenous H2O2 in
rice.
Figure 2. The mock- and RBSDV-infected rice proteomes display 72 differentially expressed protein spots. The Proteins (800 μg) were separated on 24 cm pI 4-7 non-linear gradient IPG strips and with 12.5% SDS-PAGE. The gels were stained with CBB G-250 according to the blue silver method. A total of 72 proteins were differentially expressed in response to RBSDV infection. The down-regulated proteins were labeled in the 2-DE gel image of the mock-infected rice (A), and the up-regulated proteins were marked in the gel of the RBSDV-infected rice (B).
Table 1. The 69 differentially expressed proteins identified in rice under long-term RBSDV infection.
Spot
no. Protein name aAccession no
bTMW /EMW
(KDa) c TpI / EpI dPeptides Protein score
Protein score C.I. %e
Best ion score
Average fold change (RBSDV /
CK) Anova
Defense and stress related proteins
01 Thaumatin-like protein gi|115489688 18.5 /17.8 5.07 /5.23 3 366 100 154 2.03 7.02E-04
08 Putative chitinase gi|54291729 32.7 /284 6.08 /6.51 12 777 100 118 2.15 1.60E-04
09 Putative chitinase gi|54291729 32.7 /29.1 6.08 /6.29 12 605 100 110 3.87 1.19E-04
10 Putative chitinase gi|54291729 32.7 /30.6 6.08 /6.05 8 266 100 60 2.99 3.27E-03
11 Putative chitinase gi|54291729 32.7 /28.8 6.08 /6.50 12 711 100 114 3.30 3.07E-04
12 Putative chitinase gi|54291729 32.7 /30.8 6.08 /6.01 13 627 100 98 5.55 2.98E-04
44 Putative class III chitinase gi|125531926 31.2 /30.3 4.48 /4.45 8 479 100 97 2.99 7.08E-05
17 Beta-1,3-glucanase precursor gi|4097942 34.8 /35.2 4.72 /4.60 5 216 100 94 2.10 2.04E-04
38 Endo-1,3-beta-glucanase gi|115442217 67.7 /62.3 5.32 /5.39 17 354 100 88 2.89 3.83E-03
39 Chloroplast heat shock protein 70 gi|115463081 48.6 /61.8 4.57 /4.49 10 413 100 130 2.58 4.38E-04
51 Heat shock cognate 70 kDa protein gi|108864707 67.6 /75.9 4.97 /5.10 24 825 100 123 9.15 6.31E-03
53 Ribonuclease 3 precursor gi|149392262 28.5 /23.7 5.57 /4.98 14 768 100 132 RBSDV
only 8.54E-05
54 Ribonuclease 3 precursor gi|149392262 28.5 /24.8 5.57 /4.68 12 530 100 110 RBSDV
only 8.47E-04
62 Salt stress root protein RS1 gi|115435500 21.8 /22.3 4.92 /5.62 8 330 100 110 1.84 1.04E-03
69 Salt stress root protein RS1 gi|115435500 21.8 /29.6 4.92 /4.85 10 291 100 122 -1.72 2.26E-03
48 r40c1 protein gi|24899397 42.2 /28.8 6.25 /6.58 11 327 100 99 3.05 3.13E-03
Photosynthesis
02 Chlorophyll a/b binding protein gi|125555124 26.4 /24.6 5.75 /5.14 5 165 100 93 -2.22 6.02E-05
06 Chlorophyll a/b binding protein gi|108864186 24.0 /26.1 4.73 /4.69 11 693 100 118 -2.16 1.46E-04
37 Ribulose-1,5-bisphosphate carboxylase/
oxygenase large subunit gi|11466795 53.4 /51.8 6.22 /6.85 26 796 100 208 2.22 1.00E-03
63 Ribulose-1,5-bisphosphate carboxylase/
oxygenase large subunit gi|109156602 54.3 /24.4 6.33 /6.02 11 435 100 118 1.67 6.40E-04
19 Fructose-bisphosphate aldolase gi|108864048 41.8 /39.5 6.07 /5.66 22 945 100 153 -6.93 1.12E-05
49 Fructose-bisphosphate aldolase gi|115463789 36.6 /30.3 6.56 /6.40 18 1140 100 162 2.55 9.52E-05
60 Fructose-bisphosphate aldolase gi|108864048 41.8 /39.8 6.07 /5.56 8 298 100 131 -2.39 1.79E-03
29 RuBisCO activase small isoform precursor gi|8918361 48.1 /43.1 5.85 /4.89 26 756 100 127 -2.16 5.08E-06
30 RuBisCO activase small isoform precursor gi|62733297 52.8 /43.7 5.59 /4.94 20 530 100 102 -2.11 1.45E-05
31 RuBisCO activase small isoform precursor gi|8918361 48.1 /43.9 5.85 /4.79 25 974 100 165 -2.41 4.53E-05
28 RuBisCO activase small isoform precursor gi|8918361 48.1 /42.6 5.85 /5.04 23 856 100 130 -2.14 1.53E-04
33 Phosphoglycerate kinase gi|125552851 30.5 /44.8 6.86 /5.20 17 1030 100 145 -1.90 9.25E-03
66 Phosphoglycerate kinase gi|125552851 30.5 /44.3 6.86 /5.05 17 1080 100 119 -1.90 2.91E-04
26 Phosphoribulokinase gi|115448091 45.2 /42.3 5.68 /5.12 21 1400 100 186 -2.89 2.85E-05
65 Glyceraldehyde-3-phosphate dehydrogenase A gi|115458768 43.0 /40.5 7.62 /6.74 22 972 100 155 -1.99 3.33E-02
Energy pathway
24 ATP synthase CF1 beta subunit gi|50233978 54.0 /41.5 5.38 /5.46 30 1490 100 146 2.13 8.56E-04
25 ATP synthase CF1 beta subunit gi|50233978 54.0 /40.1 5.38 /6.65 15 392 100 93 2.59 4.51E-04
57 ATP synthase CF1 beta subunit gi|50233978 54.0 /53.7 5.38 /5.57 29 1650 100 182 -3.45 2.19E-04
68 ATP synthase CF1 beta subunit gi|50233978 54.0 /50.2 5.38 /5.68 20 971 100 113 1.73 2.05E-04
71 ATP synthase CF1 beta subunit gi|50233978 54.0 /54.5 5.38 /5.58 30 1440 100 178 2.14 1.89E-03
23 ATP synthase beta subunit gi|56784991 45.9 /41.2 5.33 /5.35 18 1070 100 149 2.21 9.53E-04
22 ATP synthase gamma chain gi|115472339 40.1 /41.2 8.60 /6.48 15 482 100 80 -3.01 6.69E-05
72 ATP synthase gamma chain gi|115472339 40.1 /26.1 8.60 /5.03 15 482 100 80 1.80 3.09E-02
Redox homeostasis
04 L-ascorbate peroxodase 1, cytosolic gi|158512874 27.2 /25.2 5.31 /5.29 11 378 100 147 2.27 1.28E-04
05 Glutathione transferase GST 23 gi|115479659 25.3 /25.8 5.50 /5.66 14 528 100 97 2.26 8.68E-04
21 Catalase gi|283050393 57.1 /41.5 6.60 /5.84 17 924 100 102 2.22 1.02E-03
expressed under H2O2 stress. Moreover, in comparison with
previously published proteomic and microarray data [21,22], nine of 19 proteins were also detected differentially expressed under RBSDV infection in maize. The expression patterns of these RBSDV and H2O2 co-regulated proteins were shown in
Table 2 and Figure 3B. Among these co-regulated proteins,
some proteins had both up- and down- regulated change patterns in abundance. Likewise, many similar phenomena were also observed in other previously reported proteomics studies [32-34].
Table 1 (continued).
Spot
no. Protein name aAccession no
bTMW /EMW
(KDa) c TpI / EpI dPeptides Protein score
Protein score C.I. %e
Best ion score
Average fold change (RBSDV /
CK) Anova
15 Class III peroxidase 29 precursor gi|115445243 34.8 /35.2 5.32 /5.35 10 639 100 145 -2.43 9.01E-05
61 Thioredoxin peroxidase gi|115444771 23.3 /16.8 6.15 /5.85 12 723 100 131 -1.73 4.71E-03
14 Putative ferredoxin-NADP(H) oxidoreductase gi|41052915 41.1 /35.6 7.98 /6.18 20 1040 100 147 -1.94 5.72E-06
40 Protein disulfide isomerase gi|62546209 57.1 /63.4 4.95 /4.92 11 117 100 66 2.44 9.84E-06
67 Protein disulfide isomerase gi|7209794 33.5 /62.5 4.81 /5.10 17 576 100 124 1.71 2.21E-03
Carbohydrate metabolism
18 Fructokinase 2 gi|115474481 35. 9 /36.5 5.02 /4.96 20 1020 100 180 2.86 2.05E-05
45 Fructokinase 2 gi|115474481 35.9 /39.6 5.02 /5.07 23 897 100 165 -2.43 5.53E-04
32 Enolase gi|110288667 51.9 /43.8 5.72 /6.19 19 912 100 137 3.04 1.97E-04
36 ADP-glucose pyrophosphorylase small subunit gi|217075932 54.8 /50.4 6.77 /5.52 20 1150 100 183 -2.17 6.80E-05
55 Pyruvate dehydrogenase E1 component
subunit beta gi|115477529 40.2 /35.9 5.25 /5.21 4 240 100 96
RBSDV
only 1.69E-04
Amino acid metabolism
50 Wheat adenosylhomocysteinase-like protein gi|29367605 53.9 /50.2 5.62 /5.65 7 215 100 105 2.75 4.46E-03
46 5methyltetrahydropteroyltriglutamate
-homocysteine methyltransferase gi|108862994 66.9 /44.2 5.92 /6.32 19 659 100 162 4.17 6.22E-04
20
5-methyltetrahydropteroyltriglutamate-homocysteine methyltransferase gi|108862990 79.3 /39.7 7.19 /6.77 14 687 100 187 2.20 1.13E-02
07 Glutamine synthetase gi|218191527 40.5 /28.5 5.69 /5.59 9 388 100 134 2.10 7.16E-03
42 ATP-dependent zinc metalloprotease FTSH 1 gi|115470052 72.9 /73.8 5.51 /5.38 27 991 100 140 -2.26 1.77E-04
58 Carboxyl-terminal peptidase-like gi|55296403 45.4 /29.2 5.98 /4.36 4 310 100 112 2.54 9.39E-04
70 4-nitrophenylphosphatase gi|115459134 39.8 /35.3 6.75 /4.85 17 780 100 147 1.77 3.57E-03
Nucleotide metabolism
59 Putative mRNA binding protein precursor gi|115471157 41.3 /40.3 7.68 /5.90 15 813 100 118 -2.00 5.74E-04
Transcription and translation
27 Elongation factor 2 gi|115446385 95.0 /43.5 5.85 /5.66 23 1060 100 149 2.25 6.04E-04
16 Translational elongation factor Tu gi|17225494 50.6 /35.9 6.19 /6.21 16 570 100 150 2.13 5.82E-04
34 Chloroplast translational elongation factor Tu gi|6525065 50.6 /46.2 6.05 /5.49 24 1400 100 163 -2.08 7.70E-06
Cell wall modification
41 Hydroxyproline-rich glycoprotein-like gi|115445387 48.4 /62.9 5.05 /4.55 10 205 100 84 -3.16 9.44E-04
Plant hormone response
13 Abscisic stress ripening protein gi|116309406 25.3 /33.2 4.92 /4.73 12 446 100 115 2.16 9.21E-05
Signal transduction
43 Receptor-like protein kinase DUF26 gi|115461070 27.9 /26.6 5.01 /4.57 12 772 100 115 3.30 2.36E-03
Viral protein
56 P9-1 protein (Rice black streaked dwarf virus) gi|15387604 40.1 /39.6 5.69 /6.07 7 391 100 96 RBSDV
only 1.40E-04
Unknown protein
47 unknown protein gi|19386746 28.3/ 70.6 8.75 /6.53 2 71 98.87 62 2.93 1.47E-03
a: Accession number of the protein in the NCBInr database;
b: TMW/EMW: molecular mass of predicted protein/of protein on the gel.
c: TpI predicted/EpI: pI of predicted proteins/of proteins on the gel.d: Number of identified Peptides. e: Protein score C.I.%: Protein score confidence interval percentage.
Transcriptional profiles of DEPs under RBSDV infection To assess the validity of the alterations in protein expression during RBSDV infection, the transcriptional levels of the mRNA corresponding to the identified proteins were analyzed by quantitative real-time PCR. Nine genes, including four genes related to defense and stress response and five genes related to redox homeostasis, were selected for analysis. Transcription of the genes associated with defense and stress, including thaumatin-like protein (TLP, P01), putative chitinase (CHT, spot 08), beta-1,3-glucanase (BGL, spot 17) and chloroplast heat shock protein 70 (HSP70, spot 39), were elevated after virus infection (Figure 4). The changes in mRNA abundance of these
genes were similar to those of their corresponding proteins in the 2-DE gels. The expression patterns of five genes related to redox homeostasis including L-ascorbate peroxodase 1 (APX1, spot 04), glutathione S-transferase (GST, spot 05), ferredoxin-NADP(H) oxidoreductase (FNR, spot 14), catalase (CAT, spot 21) and protein disulfide isomerase (PDI, spot 40) have the same changes as their corresponding proteins (Figure 4). The results suggested that the changes in protein expression detected by proteomic analysis reflect the actual alterations in mock-inoculated and RBSDV-infected plants.
Figure 3. Classification of the differentially expressed proteins (DEPs). A, functional classification of the 69 DEPs in RBSDV-infected rice plant. Function, (number of DEP spots in each functional classification/ total DEP spots) % and the number of DEP spots in each classification were shown. B, functional classification of the 37 DEP spots co-regulated by RBSDV infection and by H2O2 stress. Function, (number of co-regulated protein spots in each functional classification/total DEP spots) % and the number of
The photosynthetic response under RBSDV infection stress
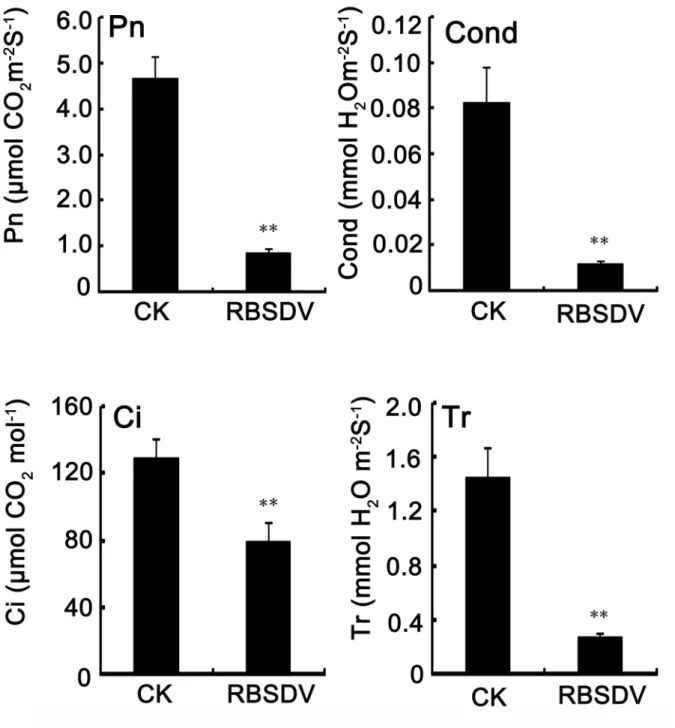
Photosynthesis is a process that converts carbon dioxide into organic compounds and plays a pivotal role in plant growth. In this study, 15 differentially expressed spots (21.7%) were associated with a photosynthetic response, and most of them were down-regulated (Table 1). To investigate the effects of virus infection on rice photosynthesis, the photosynthetic capacity was measured. The net photosynthetic rate (Pn) of the mock-infected rice was 4.68 μmol of CO2 m-2 s-1 at 50 dpi, and
Table 2. Proteins differentially expressed under both RBSDV infection and H2O2 stress.
Protein names Rice under RBSDV infection (This study) Maize under RBSDV infection [21 22]a Rice under H2O2 stress [25] Photosynthesis
Chlorophyll A-B binding protein ↓b ↓
Glyceraldehyde-3-phosphate
dehydrogenase A ↓ ↓ ↓↑
Ribulose-1,5-bisphosphate
carboxylase/oxygenase large unit ↑ ↑ ↓
Fructose-bisphosphate aldolase ↑↓ ↑ ↓
Phosphoribulokinase ↓ ↑
Rubisco activase small isoform
precursor ↓ ↑ ↓↑
Redox homeostasis
Ascorbate peroxidase ↑ ↑ ↓
Glutathione S-transferase ↑ ↑
Protein disulfide isomerase ↑ ↑
Carbohydrate metabolism
Fructokinase-2 ↓↑ ↑ ↓
ADP-glucose pyrophosphorylase ↓ ↑ ↑
UDP-glucose pyrophosphorylase ↑ ↑
Amino acid metabolism
Glutamine synthetase ↑ ↑
Cysteine synthase ↓ ↑
Nucleotide metabolism
mRNA binding protein precursor ↓ ↓↑
Energy pathway
ATP synthase CF1 beta subunit ↓↑ ↓↑ ↑
ATP synthase beta subunit ↑ ↑
Transcription and translation
Translational elongation factor Tu ↓↑ ↑ ↓↑
Elongation factor P ↓ ↑
Cell wall modification
Hydroxyproline-rich glycoprotein-like ↓ ↓
Defense and stress related protein
Chitinase ↑ ↓
Heat shock cognate 70 kDa protein ↑ ↓
a. The number of the cited references.
b. ↑ and ↓ represent up-regulated and down-regulated expression of proteins.
doi: 10.1371/journal.pone.0081640.t002
the rate for the RBSDV-infected rice was 0.86 μmol of CO2 m-2
s-1 (Figure 5). The stomatal conductance (Cond), the
intercellular CO2 concentration (Ci) and the transpiration speed
(Tr) were also significantly decreased after RBSDV infection (Figure 5). The data above indicated that the RBSDV infection results in a decrease of photosynthesis in rice.
Discussion
The overproduced H2O2 and plant growth deficiency With both reducing and oxidizing properties, H2O2 at high
concentrations could cause oxidative stress and cell damage. H2O2 can cross membranes via aquaporin-mediated transport
to chloroplasts, mitochondria and cytosol [35] and damage a large variety of biomolecules such as lipids, proteins, and nucleic acids that are essential to the activity and integrity of the cell [36]. Electron microscopy of ultrathin sections data, detected in maize plant infected with Maize rough dwarf virus which was later proved to be RBSDV [15,16,37], showed that RBSDV infection destroyed the membrane systems of various cell organelles including chloroplast, mitochondria, nucleus and vacuole, albeit no virus was discovered in these organelles [37]. The accumulated H2O2 in RBSDV infected plant may harm
the membrane structures of various organelles and result in the cell membrane rupture. The H2O2 content in the
virus-susceptible plants was observed increased much higher than in the resistant cultivar [14]. Only in the susceptible plants was the increase in apoplastic H2O2 levels accompanied by an
increase in electrolyte leakage [14]. The H2O2 at a high level in
the virus-susceptible plants probably resulted in the cell damage and electrolyte leakage.
Hydroxyproline-rich glycoprotein-like protein (HRGP) is one of the major classes of structural cell wall proteins and is involved in cell elongation [38,39]. The ROS could limit cell elongation by oxidative crosslink of HRGPs [39]. Previously report showed that cells infected by RBSDV in maize were shorter than those in the mock-inoculated plants [40]. The expression of HRGP was down-regulated by both H2O2 stress
and RBSDV infection (Table 2), suggesting that the H2O2
overproduced in RBSDV infection may crosslink the HRGP, inhibit the cell elongation, and finally result in the dwarf plant.
The cross-talk on photosynthesis
The long-term RBSDV accumulation in rice leads to the increase of endogenous H2O2 and the decrease of
photosynthetic parameters, including Pn, Cond, Ci, and Tr (Figure 1 and Figure 5). These phenomena are similar to that obtained in rice under H2O2 stress. An increase in the
chloroplastic hydrogen peroxide levels and an alteration in chloroplast ultrastructure was also observed after Plum pox virus infection [13]. It is presumed that the increased H2O2 may
do damage to the chloroplast ultrastructure and result in the decreased photosynthesis.
Besides, among the seven DEPs related to photosynthesis, six proteins were also responsive to H2O2 treatment in rice
(Table 2). These data indicated that the overproduction H2O2
photosynthesis by regulating proteins in three subgroups, including the light-harvesting reaction, the activation reaction of Rubisco large subunit, and the Calvin cycle.
In the first subgroup, chlorophyll a/b binding protein was down regulated in response to RBSDV infection and H2O2
stress. Chlorophyll a/b binding protein is a component of the light-harvesting complex of photosystem I and II and facilitates light absorption and energy transfer [41,42]. The decrease in abundance of the protein may inhibit the light absorption and energy transfer and further affect the photosynthetic process in the RBSDV-infected plant.
In the second subgroup, the Rubisco activase small isoform precursor was up- and down-regulated under both RBSDV infection and H2O2 stress (Table 2). Rubisco activase was
engaged in the activation reaction of Rubisco large subunit. It binds to the inactive Rubisco, facilitates the ATP-dependent removal of sugar phosphates from Rubisco active sites, and maintains Rubisco in its active configuration [43]. The expression change of this protein may severely affect the activation of Rubisco.
In the third subgroup, four proteins involved in Calvin cycle were co-regulated by RBSDV infection and H2O2 stress (Table
2). Of them, the abundance of glyceraldehyde-3-phosphate
dehydrogenase A, fructose-bisphosphate aldolase and phosphoribulokinase (PRKA) dropped in virus infected plant, implying that the CO2 assimilation might be slowed down by
RBSDV infection. Glyceraldehyde-3-phosphate dehydrogenase A and fructose-bisphosphate aldolase had the same expression patterns when they were under H2O2 stress and
RBSDV infection. In contrast, the expression patterns of PRKA and Rubisco large subunit were opposite under these two stresses. It suggested that the Calvin cycle was probably disturbed by factors other than H2O2. PRKA catalyzes the
ATP-dependent phosphorylation of ribulose 5-phosphate to form ribulose-1,5-bisphosphate (RuBp) [44]. It was reported that a decrease in Rubisco activity and RuBp regeneration rate were associated with the decreased photosynthesis [45,46]. The decline in Rubisco activity and RuBp regeneration, yet not in the quantity of Rubisco, may result in the decreased in CO2
assimilation of rice under RBSDV infection.
Taken together, our results suggested that the overproduction of H2O2 may diminish light absorption, CO2
assimilation and Rubisco activity by modulating the expression of the proteins pertaining to photosynthesis, and finally impaired the photosynthesis. The finding reported above provided new insights into the relationship between the
Figure 4. The changes in transcription of the differentially expressed proteins in RBSDV-infected rice. TLP, thaumatin-like protein; CHL, putative chitinase; BGL, beta-1,3-glucanase precursor; HSP70, chloroplast heat shock protein 70; APX1, L-ascorbate peroxodase 1; GST, glutathione S-transferase; FNR, ferredoxin-NADP(H) oxidoreductase; CAT, catalase; PDI, protein disulfide isomerase.
decreased photosynthesis and the overproduction of H2O2 in
RBSDV-infected rice.
The redox reaction under virus infection and H2O2
stress
The level of H2O2 was enhanced after virus accumulation,
indicating that an oxidative stress was caused by virus infection. Besides, a series of redox related proteins were differentially expressed under RBSDV infection (Table 1). The
significant increase in abundance of APX, CAT and peroxidase (POD) suggested that the H2O2-scavenging system was
activated to reduce the intracellular H2O2 levels and the
oxidative damage. Consistent with this observation, the increase in catalase activity, peroxidase activity and SOD activity was observed after virus inoculation [12,14]. However, the upregulation of these H2O2-scavenging enzymes seemed to
fail in regulating the H2O2 homeostasis, as an increase of H2O2
could be observed in virus infected rice (Figure 1).
Under RBSDV infection, 13.0% (nine proteins) of the DEPs were related to redox homeostasis. Three of these proteins were also differentially expressed under H2O2 stress (Table 2),
indicating that the overproduced H2O2 has a direct effect on
plant antioxidative response. APX, a major ROS-scavenging enzyme, could efficiently decompose hydrogen peroxide in various subcellular compartments [47]. GST catalyzes the reduction of toxic organic hydroperoxides with glutathione as a cosubstrate or coenzyme [48]. PDI is participated in the thioredoxin-based redox pathway and the antioxidative defense system [49]. The upregulation of these proteins implied that the host plant provoked the antioxidative response to reduce the toxicity of the accumulated H2O2 after virus infection.
The effect of overproduced H2O2 on the other
processes
Proteins involved in carbohydrate metabolism, amino acid metabolism, nucleotide metabolism, energy pathway, and transcription and translation were regulated by both H2O2 and
RBSDV stresses (Table 2), suggesting that the enhanced H2O2
in RBSDV-infected plant may disturb these processes.
Fructokinase catalyzes the transfer of a phosphate group from ATP to fructose and plays a role in the glycolysis, in particular, sucrose and fructose metabolism. Fructokinase 2 could inhibit the growth of stems and roots in tomato when it was suppressed [50]. The abundance of fructokinase 2 was decreased under H2O2 stress, but was up- and down-regulated
under RBSDV infection (Table 2). The multiple expression patterns indicated that fructokinase 2 may impair the glycolysis and inhibit the plant growth in disease plant.
ADP-glucose pyrophosphorylase (AGPase) activates the first, rate limiting step in starch biosynthesis. UDP-glucose pyrophosphorylase could catalyze UDP-glucose into glucose-1-phosphate (Glc-1-P),which can be converted into ADP-glucose by AGPase and finally stored as starch [51]. The upregulation of AGPase and UDP-glucose pyrophosphorylase suggested that more starch might be accumulated under these stresses, which may explain why starch granules boomed in the maize leaves infected with RBSDV [37].
The RNA binding protein play a major role in post-transcriptional regulation, including pre-mRNA splicing, capping, mRNA transport and translation of functional mRNAs [52]. Under RBSDV infection and H2O2 stress, some
responsive proteins had different isoelectric points and different expression patterns (Table 1). We reasoned that mRNA binding protein is likely involved in posttranslational regulation and results in the opposite expression patterns of the responsive proteins.
Conclusions
In the current study, a number of proteins responsive to both H2O2 stress and long-term RBSDV infection were obtained.
These proteins were associated with various functions, including photosynthesis, redox homeostasis, energy pathway, carbohydrate, amino acid, and nucleotide metabolism, energy pathway, transcription and translation, and cell wall modification. The results should be useful in providing insights into the significant role of H2O2 produced in plant-virus
compatible interaction. It is worth noting that no PR proteins could be up-regulated by H2O2 stress. The function of H2O2
overproduced in compatible interaction seems different from that revealed in incompatible interaction. Whether the overproduced H2O2 facilitates the RBSDV infection remains to
be further studied.
Supporting Information
Table S1. Primers used for RT-PCR and quantitative real-time PCR.
(DOC)
Table S2. The proteins were annotated by BLASTP
(www.ncbi.nlm.nih.gov/BLAST and www.uniprot.org/BLAST).
The homologues with the highest homology are shown. (DOC)
Table S3. Peptide sequences identified by MOLDI-TOF/ TOF-MS.
(DOC)
Acknowledgements
We are grateful to Prof. Jianping Chen from Zhejiang Academy of Agricultural Sciences and Prof. Cunkou Qi from Jiangsu academy of Agriculture Sciences for the kind help in this study. We also thank Prof. Yule Liu, Xinzhong Cai and Xiaorong Tao for constructive suggestions in reviewing the manuscript.
Author Contributions
Conceived and designed the experiments: QX YZ. Performed the experiments: QX HN QC. Analyzed the data: QX FS. Contributed reagents/materials/analysis tools: TZ YL. Wrote the manuscript: QX YZ.
References
1. Levine A, Tenhaken R, Dixon R, Lamb C (1994) H2O2 from the
oxidative burst orchestrates the plant hypersensitive disease resistance response. Cell 79: 583-593. doi:10.1016/0092-8674(94)90544-4. PubMed: 7954825.
2. Wojtaszek P (1997) Oxidative burst: An early plant response to pathogen infection. Biochem J 322: 681-692. PubMed: 9148737. 3. Mehdy MC (1994) Active oxygen species in plant defense against
pathogens. Plant Physiol 105: 467-472. PubMed: 12232215.
4. Grant JJ, Loake GJ (2000) Role of reactive oxygen intermediates and cognate redox signaling in disease resistance. Plant Physiol 124: 21-29. doi:10.1104/pp.124.1.21. PubMed: 10982418.
5. Alvarez ME, Pennell RI, Meijer PJ, Ishikawa A, Dixon RA et al. (1998) Reactive oxygen intermediates mediate a systemic signal network in the establishment of plant immunity. Cell 92: 773-784. doi:10.1016/ S0092-8674(00)81405-1. PubMed: 9529253.
7. Foyer CH, Noctor G (2005) Oxidant and antioxidant signalling in plants: a re-evaluation of the concept of oxidative stress in a physiological context. Plant Cell Environ 28: 1056-1071. doi:10.1111/j. 1365-3040.2005.01327.x.
8. Mittler R, Vanderauwera S, Gollery M, Van Breusegem F (2004) Reactive oxygen gene network of plants. Trends Plant Sci 9: 490-498. doi:10.1016/j.tplants.2004.08.009. PubMed: 15465684.
9. Miller G, Suzuki N, Ciftci-Yilmaz S, Mittler R (2010) Reactive oxygen species homeostasis and signalling during drought and salinity stresses. Plant Cell Environ 33: 453-467. doi:10.1111/j. 1365-3040.2009.02041.x. PubMed: 19712065.
10. Hafez YM, Bacsó R, Király Z, Künstler A, Király L (2012) Up-regulation of antioxidants in tobacco by low concentrations of H2O2 suppresses
necrotic disease symptoms. Phytopathology 102: 848-856. doi: 10.1094/PHYTO-01-12-0012-R. PubMed: 22646244.
11. Hao ZN, Wang LP, He YP, Liang JG, Tao RX (2011) Expression of defense genes and activities of antioxidant enzymes in rice resistance to rice stripe virus and small brown planthopper. Plant Physiol Biochem 49: 744-751. doi:10.1016/j.plaphy.2011.01.014. PubMed: 21300551. 12. Riedle-Bauer M (2000) Role of reactive oxygen species and antioxidant
enzymes in systemic virus infections of plants. J Phytopathol 148: 297-302. doi:10.1046/j.1439-0434.2000.00503.x.
13. Díaz-Vivancos P, Clemente-Moreno MJ, Rubio M, Olmos E, García JA et al. (2008) Alteration in the chloroplastic metabolism leads to ROS accumulation in pea plants in response to plum pox virus. J Exp Bot 59: 2147-2160. doi:10.1093/jxb/ern082. PubMed: 18535298.
14. Diaz-Vivancos P, Rubio M, Mesonero V, Periago PM, Barceló AR et al. (2006) The apoplastic antioxidant system in Prunus: response to long-term plum pox virus infection. J Exp Bot 57: 3813-3824. doi: 10.1093/jxb/erl138. PubMed: 17043083.
15. Zhang HM, Chen JP, Lei JL, Adams MJ (2001) Sequence analysis shows that a dwarfing disease on rice, wheat and maize in China is caused by rice black-streaked dwarf virus. Eur J Plant Pathol 107: 563-567. doi:10.1023/A:1011204010663.
16. Bai FW, Yan J, Qu ZC, Zhang HW, Xu J et al. (2002) Phylogenetic analysis reveals that a dwarfing disease on different cereal crops in China is due to rice black streaked dwarf virus (RBSDV). Virus Genes 25: 201-206. doi:10.1023/A:1020170020581. PubMed: 12416683. 17. Wang HD, Chen JP, Wang AG, Jiang XH, Adams MJ (2009) Studies on
the epidemiology and yield losses from rice black-streaked dwarf disease in a recent epidemic in Zhejiang province, China. Plant Pathol 58: 815-825. doi:10.1111/j.1365-3059.2009.02091.x.
18. Hibino H (1996) Biology and epidemiology of rice viruses. Annu Rev Phytopathol 34: 249-274. doi:10.1146/annurev.phyto.34.1.249. PubMed: 15012543.
19. Shikata E, Kitagawa Y (1977) Rice black-streaked dwarf virus - Its properties, morphology and Intracellular-localization. Virology 77: 826-842. doi:10.1016/0042-6822(77)90502-5. PubMed: 855190. 20. Isogai M, Uyeda I, Lee BC (1998) Detection and assignment of proteins
encoded by rice black streaked dwarf fijivirus S7, S8, S9 and S10. J Gen Virol 79: 1487-1494. PubMed: 9634092.
21. Jia MA, Li YQ, Lei L, Di DP, Miao HQ et al. (2012) Alteration of gene expression profile in maize infected with a double-stranded RNA fijivirus associated with symptom development. Mol Plant Pathol 13: 251-262. doi:10.1111/j.1364-3703.2011.00743.x. PubMed: 21955602. 22. Li KP, Xu CZ, Zhang JR (2011) Proteome profile of maize (Zea Mays
L.) leaf tissue at the flowering stage after long-term adjustment to rice black-streaked dwarf virus infection. Gene 485: 106-113. doi:10.1016/ j.gene.2011.06.016. PubMed: 21708230.
23. Lu Y, Yang J, Zhang HM, Chen JP (2012) Screening of rice gene fragments interacted with p5b of rice black-streaked dwarf virus (in Chinese). Chin J Rice Sci 26: 34-41.
24. Xiao DL, Deng H, Xie LY, Wu ZJ, Xie LH (2010) Screening of rice proteins interacting with P6 of Rice black streaked dwarf virus from rice cDNA library by yeast two hybrid system (in Chinese). Chi J Trop Crops 31: 435-439.
25. Wan XY, Liu JY (2008) Comparative proteomics analysis reveals an intimate protein network provoked by hydrogen peroxide stress in rice seedling leaves. Mol Cell Proteomics 7: 1469-1488. doi:10.1074/ mcp.M700488-MCP200. PubMed: 18407957.
26. Li L, Li HW, Dong HB, Wang XF, Zhou GH (2011) Transmission by Laodelphax striatellus Fallen of Rice black-streaked dwarf virus from frozen infected rice leaves to healthy plants of rice and maize. J Phytopathol 159: 1-5. doi:10.1111/j.1439-0434.2010.01713.x. 27. Ji YH, Gao RZ, Zhang Y, Cheng ZB, Zhou T et al. (2011) A simplified
method for quich detection of Rice black- streaked dwarf virus and Southern rice black-streaked dwarf virus (in Chinese). Chin J Rice Sci 25: 91-94.
28. Damerval C, Devienne D, Zivy M, Thiellement H (1986) Technical improvements in two-dimensional electrophoresis increase the level of genetic-variation detected in wheat-seedling proteins. Electrophoresis 7: 52-54. doi:10.1002/elps.1150070108.
29. Xu QF, Cheng WS, Li SS, Li W, Zhang ZX et al. (2012) Identification of genes required for Cf-dependent hypersensitive cell death by combined proteomic and RNA interfering analyses. J Exp Bot 63: 2421-2435. doi: 10.1093/jxb/err397. PubMed: 22275387.
30. Candiano G, Bruschi M, Musante L, Santucci L, Ghiggeri GM et al. (2004) Blue silver: A very sensitive colloidal Coomassie G-250 staining for proteome analysis. Electrophoresis 25: 1327-1333. doi:10.1002/ elps.200305844. PubMed: 15174055.
31. Meisrimler CN, Planchon S, Renaut J, Sergeant K, Lüthje S (2011) Alteration of plasma membrane-bound redox systems of iron deficient pea roots by chitosan. J Proteomics 74: 1437-1449. doi:10.1016/j.jprot. 2011.01.012. PubMed: 21310270.
32. Ma H, Song L, Shu Y, Wang S, Niu J et al. (2012) Comparative proteomic analysis of seedling leaves of different salt tolerant soybean genotypes. J Proteomics 75: 1529-1546. doi:10.1016/j.jprot. 2011.11.026. PubMed: 22155470.
33. Hashimoto M, Komatsu S (2007) Proteomic analysis of rice seedlings during cold stress. Proteomics 7: 1293-1302. doi:10.1002/pmic. 200600921. PubMed: 17380535.
34. Neilson KA, Mariani M, Haynes PA (2011) Quantitative proteomic analysis of cold-responsive proteins in rice. Proteomics 11: 1696-1706. doi:10.1002/pmic.201000727. PubMed: 21433000.
35. Møller IM, Jensen PE, Hansson A (2007) Oxidative modifications to cellular components in plants. Annu Rev Plant Biol 58: 459-481. doi: 10.1146/annurev.arplant.58.032806.103946. PubMed: 17288534. 36. Mittler R (2002) Oxidative stress, antioxidants and stress tolerance.
Trends Plant Sci 7: 405-410. doi:10.1016/S1360-1385(02)02312-9. PubMed: 12234732.
37. Li ZH, Guo XQ, Ye BH, Guo YK (2002) Ultrantructural alteration of maize plants infected with the maize rough dwarf virus (in Chinese). Agri Sci China 1: 531-534.
38. Showalter AM, Keppler B, Lichtenberg J, Gu D, Welch LR (2010) A bioinformatics approach to the identification, classification, and analysis of hydroxyproline-rich glycoproteins. Plant Physiol 153: 485-513. doi: 10.1104/pp.110.156554. PubMed: 20395450.
39. De Cnodder T, Vissenberg K, Van Der Straeten D, Verbelen JP (2005) Regulation of cell length in the Arabidopsis thaliana root by the ethylene precursor 1-aminocyclopropane- 1-carboxylic acid: a matter of apoplastic reactions. New Phytol 168: 541-550. doi:10.1111/j. 1469-8137.2005.01540.x. PubMed: 16313637.
40. Ren P, Chen D, Cao KQ, Lu YG, Miao HQ (2009) Histological study on maize infected with rice black-streaked dwarf fijivirus (in Chinese). J Heibei Agri Univer 32: 89-100.
41. Umate P (2010) Genome-wide analysis of the family of light-harvesting chlorophyll a/b-binding proteins in Arabidopsis and rice. Plant Signal Behav 5: 1537-1542. doi:10.4161/psb.5.12.13410. PubMed: 21512324. 42. Yang DH, Paulsen H, Andersson B (2000) The N-terminal domain of the light-harvesting chlorophyll a/b-binding protein complex (LHCII) is essential for its acclimative proteolysis. Febs Lett 466: 385-388. doi: 10.1016/S0014-5793(00)01107-8. PubMed: 10682866.
43. Salvucci ME, Ogren WL (1996) The mechanism of Rubisco activase: Insights from studies of the properties and structure of the enzyme. Photosynth Res 47: 1-11. doi:10.1007/BF00017748.
44. Avilan L, Lebreton S, Gontero B (2000) Thioredoxin activation of phosphoribulokinase in a bi-enzyme complex from Chlamydomonas reinhardtii chloroplasts. J Biol Chem 275: 9447-9451. doi:10.1074/jbc. 275.13.9447. PubMed: 10734091.
45. Guo DP, Guo YP, Zhao JP, Liu H, Peng Y et al. (2005) Photosynthetic rate and chlorophyll fluorescence in leaves of stem mustard (Brassica juncea var. tsatsai) after turnip mosaic virus infection. Plant Sci 168: 57-63. doi:10.1016/j.plantsci.2004.07.019.
46. Synkova H, Semoradova S, Schnablova R, Muller K, Pospisilova J et al. (2006) Effects of biotic stress caused by Potato virus Y on photosynthesis in ipt transgenic and control Nicotianatabacum L. Plant Sci 171: 607-616. doi:10.1016/j.plantsci.2006.06.002.
47. Teixeira FK, Menezes-Benavente L, Galvão VC, Margis R, Margis-Pinheiro M (2006) Rice ascorbate peroxidase gene family encodes functionally diverse isoforms localized in different subcellular compartments. Planta 224: 300-314. doi:10.1007/s00425-005-0214-8. PubMed: 16397796.
48. Dixon DP, Lapthorn A, Edwards R (2002) Plant glutathione transferases. Genome Biol 3: 3004: 3001-3010.
50. Odanaka S, Bennett AB, Kanayama Y (2002) Distinct physiological roles of fructokinase isozymes revealed by gene-specific suppression of Frk1 and Frk2 expression in tomato. Plant Physiol 129: 1119-1126. doi:10.1104/pp.000703. PubMed: 12114566.
51. Kleczkowski LA (1994) Glucose activation and metabolism through udp-glucose pyrophosphorylase in plants. Phytochemistry 37: 1507-1515. doi:10.1016/S0031-9422(00)89568-0.