Stress responses of the fish Nile tilapia
subjected to electroshock and social
stressors
Laboratório de Fisiologia e Comportamento Animal, Departamento de Fisiologia, Research Center on Animal Welfare (RECAW), Instituto de Biociências,
Universidade Estadual Paulista, Botucatu, SP, Brasil R.E. Barreto
and G.L. Volpato
Abstract
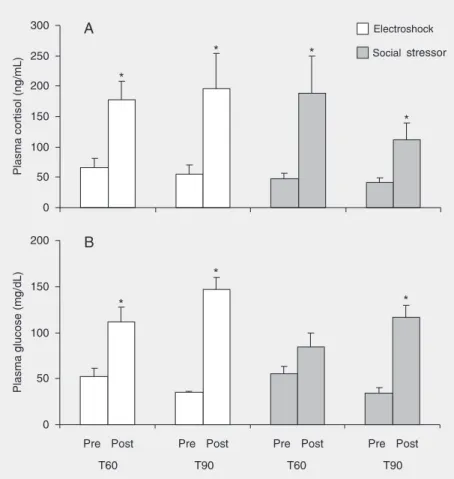
Plasma cortisol and glucose levels were measured in 36 adult Nile tilapia males, Oreochromis niloticus (standard length, mean ± SD, 14.38 ± 1.31 cm), subjected to electroshock and social stressors. Pre-stressor levels were determined 5 days after the adjustment of the fish to the experimental aquaria (1 fish/aquarium). Five days later, the effects of stressors on both cortisol and glucose levels were assessed. The following stressors were imposed for 60 min: pairing with a larger resident animal (social stressor), or a gentle electroshock (AC, 20 V, 15 mA, 100 Hz for 1 min every 4 min). Each stressor was tested in two independent groups, one in which stress was quantified immediately after the end of the 60-min stressor imposition (T60) and the other in which stress was quantified 30 min later (T90). Pre-stressor values for cortisol and glucose were not statistically different between groups. Plasma cortisol levels increased significantly and were of similar magnitude for both electroshock and the social stressor (mean ± SD for basal and final samples were: electroshock T60 = 65.47 ± 15.3, 177.0 ± 30.3; T90 = 54.8 ± 16.0, 196.2 ± 57.8; social stress T60 = 47.1 ± 9.0, 187.6 ± 61.7; T90 = 41.6 ± 8.1, 112.3 ± 26.8, respectively). Plasma glucose levels increased significantly for electroshock at both time points (T60 and T90), but only at T90 for the social stressor. Initial and final mean (± SD) values are: electroshock T60 = 52.5 ± 9.2, 115.0 ± 15.7; T90 = 35.5 ± 1.1, 146.3 ± 13.3; social stress T60 = 54.8 ± 8.8, 84.4 ± 15.0; T90 = 34.5 ± 5.6, 116.3 ± 13.6, respectively. Therefore, electroshock induced an increase in glucose more rapidly than did the social stressor. Furthermore, a significant positive corre-lation between cortisol and glucose was detected only at T90 for the social stressor. These results indicate that a fish species responds differently to different stressors, thus suggesting specificity of fish stress response to a stressor.
Correspondence G.L. Volpato
Laboratório de Fisiologia e Comportamento Animal Departamento de Fisiologia Instituto de Biociências, UNESP Rubião Jr., s/n
18618-000 Botucatu, SP Brasil
Fax: +55-14-3811-6251
E-mail: [email protected]
Research supported by FAPESP (No. 00/00070-9).
Received January 20, 2006 Accepted September 1, 2006
Key words
•Stress •Aggression •Agonistic behavior •Fighting
•Social stress •Electroshock
Introduction
The biological concept of stress applied to fish has attracted considerable attention in recent years. Stress is a generalized response
frequency (12-15) in fish. Although stress can be considered to be a generalized re-sponse, it can be modulated by specific stres-sor conditions (16). Such modifying factors may be either a non-stressor or inherent to the stressor trait. For instance, sexual matu-rity (4), environmental color (17,18), herita-bility (7), age (3), and feeding state (8) are non-stressful conditions that modulate the stress response. On the other hand, intensity and duration are stressor characteristics that affect stress (1,2). Most investigations have concentrated on non-stressor factors modu-lating stressor effects (19,20), and much less emphasis has been placed on differences in fish stress response caused by putative stres-sor characteristics, which are thus the focus of the present study.
Stressors have been classified for fish as: a) physical factors directly acting on the fish; b) physical stressors with no contact (touching) with the focal animal; c) cues from stressed conspecifics, and d) memory retrieval of a stressful experience (21). De-spite this classification, stressful conditions may involve more than one of these types. In view of this possibility, the present study investigated two stressors: electroshock and a social stressor. These stressors are physical since they touch the fish directly. This is because the electricity spreads through the fish body and, during social interactions, a subordinate fish suffers several bites. How-ever, they differ in that electroshock is re-stricted to the physical contact, with no cue whereby the fish can anticipate the stressor exposure, while a social stressor includes anticipatory psychological components. The presence of a dominant fish is an intimidat-ing threat that can be permanently perceived by the subordinate fish without necessarily involving biting (16,22).
Therefore, in the present study we ex-pected that fish would respond differently to these two stressors (electroshock and social stressors) based on which components are involved (only physical or physical and
psy-chological). This latter aspect is also impor-tant because it provides preliminary evi-dence reinforcing the classification of stres-sors proposed by Moreira and Volpato (21). On the basis of these considerations, the present study compared fish stress responses to electroshock and a social stressor by meas-uring plasma levels of cortisol and glucose, two well-established indicators of stress in fish (1,2). We chose the fish species Nile tilapia, Oreochromis niloticus, because it is an important fish model for studying the stress response (9-13,17,21,23,24) and has evident agonistic behavior (11,12,22,25,26), both aspects related to the proposed hypo-thesis.
Material and Methods
Fish and holding conditions
Our stock population consisted of 70 adult Nile tilapia males, Oreochromis niloticus
(Linnaeus, 1759), acclimated for about one month to an indoor 500-L plastic tank (~1 fish/7 L; holding density ~6 g/L). During this time, the water temperature was ~24ºC, with continuous aeration and systematic re-circulation through a biological filter, and the tank was supplied with a constant flow of dechlorinated water. The photoperiod was from 6:00 to 18:00 h, provided by a fluores-cent light (daylight; ~350 lux). The fish were fed daily in excess with tropical fish chow (38% protein; Purina Ltda., Campinas, SP, Brazil).
This research conforms to the Ethical Principles in Animal Research adopted by the Brazilian College of Animal Experimen-tation and was approved by the Ethics Com-mittee for Animal Research of the Instituto de Biociências de Botucatu, UNESP, SP, Brazil (Protocol No. 97/02).
Experimental design
two types of stressors, electroshock and a social stressor, on plasma cortisol and glu-cose levels. For the test, 36 fish were matched for size (standard length, mean ± SD 14.38 ± 1.31 cm) and body coloration. Red colora-tion on the caudal fin of male Nile tilapia indicates sexual maturity (27) and these ani-mals were not used for the present experi-ment.
The selected fish were randomly assigned to each experimental group. Effects of stres-sors were studied in socially isolated fish in glass aquaria (40 x 20 x 25 cm, total water volume 20 L; 1 fish per aquarium). Isolation was imposed 10 days before the test. The fish were fed daily in excess (as above), except during the days when they were sam-pled. The pre-stressor measurements of plasma cortisol and glucose were performed 5 days after the beginning of isolation. Five days later, the same fish were exposed to one of the two stressors (social stressor or elec-troshock) for 60 min. Post-stress physiologi-cal responses were then assessed in two independent groups per stressor: immedi-ately after the end of the 60-min period of stressor imposition (T60) or 30 min later (T90). Thus, four different groups (9 fish each) were used.
The mean (± SD) weights (g) of Nile tila-pia were similar among groups: electroshock groups, T60 = 109.35 ± 26.21, T90 = 116.78 ± 32.8 g; social stressor groups, T60 = 98.63 ± 12.5, T90 = 101.32 ± 12.27 g (ANOVA; F(3;32)
= 1.03; P = 0.39). Mean (± SD) standard lengths (cm) were also similar among groups: electroshock groups, T60 = 14.3 ± 1.5, T90 = 14.5 ± 1.7 cm; social stressor groups, T60 = 13.7 ± 1.0, T90 = 13.7 ± 1.2 cm (ANOVA;
F(3;32) = 1.18; P = 0.33). Pre- and post-stressor
measurements showed no correlation between plasma cortisol or glucose and length or weight.
Stressors
General conditions. On the test day (10th
day of isolation), each fish was transferred to
a larger aquarium (60 x 28 x 31 cm, water volume 48 L) to be exposed to the stressor. Immediately after 60 min of stressor imposi-tion, blood samples were obtained from fish of the T60 groups, while the fish of the T90 groups were returned to their respective aquarium for 30 min before a blood sample was obtained. This aquarium transfer was necessary to impose the social stressor by pairing the focal fish with a resident animal. Thus, the same aquarium transfer was adopted in the electroshock groups to control handling effects.
Social stressor. The social stressor
con-sisted of paring the focal fish with a larger resident fish. The physiological parameters were quantified only in the focal animal, which was the subordinate. The resident larger fish was about 33% larger than the focal animal (smaller/larger fish ratio (%): T60 = 33.71 ± 4.78 and T90 = 33.66 ± 5.87; Student t-test, P = 0.98). Both previous
resi-dence (28) and larger body size (29) are associated with dominance. This procedure guaranteed a clear dominance-subordinance relationship, thus characterizing a typical situation of social stress for the focal fish (9,11,23,25). To evaluate the social stressor, agonistic acts were quantified based on the ethograms described by Alvarenga and Vol-pato (12), Giaquinto and VolVol-pato (25) and Barki and Volpato (26) for this species.
Aggression was evaluated on the basis of videotape analysis as the frequency of total fights emitted/received by the focal fish and also of each agonistic type emitted by the dominant. This is important to adequately characterize the social stress since the previ-ous history of social interaction modulates the stress response in the Nile tilapia (12). The social ranks of the focal animals were also confirmed by qualitative inspections of the body (9) and/or eye (22) coloration (the eye and body of dominant Nile tilapia fish are pale while those of subordinates are darker).
applied with an electric stimulator having two electrodes, each located in the center of the smaller wall of the aquarium. A higher shock might provoke immobilization of and serious injuries to the fish within a few sec-onds of exposure (30,31). Thus, the shock pattern used here (AC shock with 20 V, 15 mA and 100 Hz in water with conductivity of 110 µS) was much weaker compared to those used by Barton and Grosh (5; AC shock with 75 V, 3.3 A) and Barton and Dwyer (6; DC shock with 120-130 V and 0.5 A). The shock used here only provoked an immediate dorsal fin flick, without any in-jury or immobilization. Therefore, we im-posed the electroshock for a longer time, i.e., 1 min every 4 min for 1 h.
Aquarium conditions
The experimental aquaria were supplied with continuous aeration and equipped with a biological filter (recirculating water sys-tem). During the experiments the water tem-perature was ~23ºC, pH ranged from 6.2 to 6.5, oxygen concentrations were near satu-ration (~7.5 mg/L), nitrite and ammonia were lower than 0.5 and 0.25 ppm, respectively, and salinity was 0.0 ppm. Photoperiod and illumination were as in the holding condi-tion, but light was about 480 Lux.
Blood collection, sample processing, and cortisol and glucose analyses
Blood was always sampled (pre- and post-stressor collections) at ~11:00 h. For blood collections, each fish was netted and indi-vidually anesthetized with 80 mg/L of ben-zocaine by bath exposure, and blood (about 400 µL) was then sampled by cardiac punc-ture using heparinized syringes (Liquemine,
Roche, Rio de Janeiro, RJ, Brazil). Blood sampling never lasted more than 1 min per fish. Blood was centrifuged (3000 rpm for 10 min) and plasma (about 100 µL) was collected, transferred to 1-mL capped tubes,
and stored frozen (-22ºC) until required for assay.
Plasma cortisol levels were determined by a routine technique using a commercial kit for radioimmunoassay, “Coat-a-Count Cortisol®” - DPC (Diagnostic Products
Cor-porations, Los Angeles, CA, USA). Plasma glucose levels were determined by the color-imetric method of Trinder (32).
Statistical analysis
Plasma cortisol and glucose data showed normal distribution by the Kolmogorov-Smirnov test. ANOVA (completely random-ized design) was employed to compare treat-ments under pre-stressor conditions. Mean post-stressor cortisol and glucose levels were compared with pre-stressor levels by the paired Student t-test, and between stressors
at each time point by the independent Stu-dent t-test. The Pearson test was used to
assess the correlation between post-stressor cortisol and glucose levels. The frequency of the agonistic interactions and the agonis-tic profile were assessed by the Mann-Whit-ney U-test and Friedman test. The level of significance was set at α = 0.05.
Results
de-tected between the T60 and T90 groups (Mann-Whitney U-test, lowest P = 0.12; Figure 1). Nipping at the medial body area of the opponent was the most frequent agonis-tic pattern displayed, while the other pat-terns were similar to each other (Friedman test; T60 and T90, P < 0.0001; Figure 1). Thus, the intensity of the social stressor in terms of attacks was similar for the T60 and T90 groups.
Mean baseline levels for both cortisol and glucose were statistically similar among groups (Figure 2; ANOVA; cortisol, F(3;32) =
0.69, P = 0.57; glucose, F(3;32) = 2.18, P =
0.10). Electroshock and social stressor in-creased fish cortisol levels when compared with their pre-stressor state (paired Student
t-test; electroshock: T60, P < 0.01; T90, P <
0.05, and social stressor: T60, P < 0.05; T90, P < 0.05). However, the same profile was not observed for glucose levels. Glucose was increased significantly by electroshock at both time points (paired Student t-test; T60,
P < 0.05, and T90, P < 0.0001) compared to the pre-stressor situation, while for the so-cial stressor glucose was increased only at T90 (paired Student t-test; T60, P = 0.19,
and T90, P < 0.0001). In addition, no differ-ence was found between electroshock and social stressor for glucose (independent Stu-dent t-test; T60, P = 0.23, and T90, P = 0.13) or cortisol levels (independent Student t
-test; T60, P = 0.89, and T90, P = 0.21) at each time point.
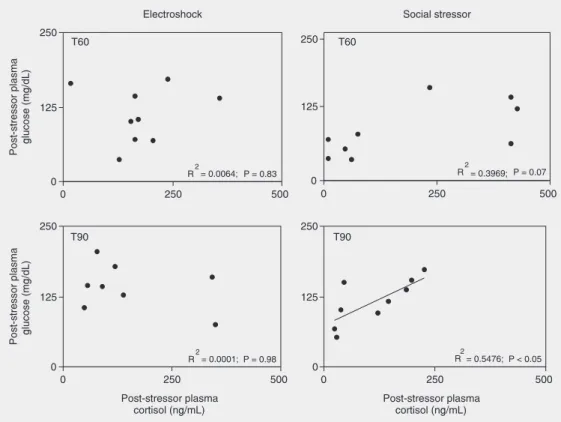
In the electroshock series, no correlation was detected at all (Figure 3), with very low correlation coefficients for both T60 (R2 =
0.0064; P = 0.83) and T90 (R2 = 0.0001; P =
0.98). The social stressor, however, imposed a different profile (Figure 3), with no significant correlation at T60, but with a high R2 (R2 =
0.3969; P = 0.07), and with a significant corre-lation at T90 (R2 = 0.5476; P < 0.05).
Discussion
The present study indicated that different
Figure 1. Mean frequency of agonistic interaction patterns received by the focal Nile tilapia. Nipping: AT = anterior, CD = caudal, MD = median, and VT = ventral area; lateral fight: LS = fish in the same direction, LO = fish in opposite directions; MF = mouth fight; CH = chasing. T60 are fish that had blood collected after the end of the 60-min period of stressor imposition; in T90 blood was collected 30 min later (includes 60 min of stressor plus 30 min later). *Median nipping within both T60 and T90 groups was the most frequent agonistic pattern (Friedman test; P < 0.0001), while the remaining ones were similar to each other. No difference was observed when each pattern was compared between the T60 and T90 groups (Mann-Whitney test; lowest Pvalue = 0.12).
stressors cause distinct stress responses in the Nile tilapia fish, thus reinforcing the specificity of stress in fish. Electroshock induced a faster increase in plasma glucose levels compared with the response obtained to the social stressor. In addition, cortisol and glucose levels were only correlated with each other for the social stressor. This effect provides some evidence corroborating the classification of stressors proposed by Mo-reira and Volpato (21), as they differ from each other by the presence of the psycho-logical component in the social stressor.
The initial analysis considers the ad-equacy of pre-stressor measurements of plasma cortisol and glucose levels. Mean pre-stressor cortisol levels ranged from 41.57 to 65.67 ng/mL (Figure 2), in agreement with other studies. For instance, the baseline described for O. niloticus ranged from ~5 to
60 ng/mL (10,11,17,23,24), and for the re-lated Cichlid, O. mossambicus, it ranged
from ~20 to 60 ng/mL (33), and from about 10 to 60 for other fish species (3-6,19,34).
Plasma glucose fluctuated from 34.54 to 52.45 mg/dL, within the range previously reported for the Nile tilapia, from 45 to 130 mg/dL (9,10,35), and for other species, from ~40 to 110 mg/dL (5,6). These data confirm the non-stressed baseline for the fish in the present study.
Electroshock and social stressors induced an elevation in plasma cortisol levels at a similar rate in the Nile tilapia for both time points (T60 and T90). However, while elec-troshock significantly increased plasma glu-cose levels at both time points, social stres-sor increased plasma glucose only at T90. These results clearly show that electroshock induces a glucose response more rapidly than social stress in the Nile tilapia. Method-ologically, it is difficult to provide stressful conditions of equivalent intensity. However, the magnitude of the cortisol response repre-sents a suitable parameterfor the compara-tive goal of the present study. The magni-tudes of the cortisol levels observed here suggest similar intensity of the stressors.
Thus, the difference found for the glucose response in this species depends more prob-ably on stressor modalities than on intensity. A similar conclusion has been reported for rats in terms of distinct reproductive steroid hormone responses to different stressors with a similar magnitude of corticosteroid re-sponse among stressors (36). Moreover, Nile tilapia also presents a difference in its venti-latory responses when subjected to different stressors (14).
The idea of a distinct stress response to different stressor modalities is reinforced by the significant correlation between cortisol and glucose only for social stressors (Figure 3). A similar correlation between cortisol and glucose for social stress has been previ-ously reported for the Nile tilapia (11), but the present study indicates the role of stres-sor modality in this relationship.
This stressor modality-dependent effect could indicate different mechanisms under-lying the control of glucose levels. Although the determination of the mechanisms in-volved in the glucose response is beyond the scope of the present study, the correlation analyses shown in Figure 3 indicate that such mechanisms may also be stressor re-lated. The significant correlation between cortisol and glucose (social stressor, T90) in contrast to a clear absence of correlation for electroshock at the same time point strongly suggests the dependence of the stressor mo-dality on the mechanisms controlling
glu-cose levels. Cortisol is usually considered to have a hyperglycemic effect (37) and, in-deed, it has been reported that fish exposed to increased levels of cortisol had increased glucose levels (33), which could explain the significant correlation described herein. However, electroshock-exposed fish in-creased glucose without a correlated cortisol increase, thus suggesting that other factors are involved. This suggestion should be clari-fied in future investigations, also because controversial results have been reported re-garding cortisol-regulated glucose levels: cortisol was reported to decrease (38) or not to affect (39) glucose levels, and Trenzado et al. (40) reported that low-cortisol respond-ing rainbow trout had higher glucose in-crease than high-cortisol responding fish.
Acknowledgments
The authors thank Mr. A.C.B. Tardivo, Mr. H.L. Silva, Ms. A.T. Robiero, Dr. L. Faine, Dr. L.C. Jordão, and Dr. J.A. Almeida for very helpful technical assistance; Dr. L.M.R. Muniz (Department of Animal Repro-duction and Veterinary Radiology, FMVZ, UNESP/Botucatu, SP, Brazil) for allowing the cortisol analyses to be carried out in her labo-ratory; Dr. E.L.B. Novelli (Department of Bio-chemistry, IB, UNESP/Botucatu, SP, Brazil) for allowing the glucose analyses to be carried out in her laboratory; Dr. F.A.N.F. Chubaci for monitoring the electroshock output.
References
1. Bonga SEW. The stress response in fish. Physiol Rev 1997; 77: 591-625.
2. Barton BA. Stress in fishes: A diversity of responses with particular reference to changes in circulating corticosteroids. Integr Comp Biol
2002; 42: 517-525.
3. Pottinger TG, Mosuwe E. The corticosteroidogenic response of brown and rainbow trout alevins and fry to environmental stress during a “critical period”. Gen Comp Endocrinol 1994; 95: 350-362. 4. Pottinger TG, Balm PH, Pickering AD. Sexual maturity modifies the responsiveness of the pituitary-interrenal axis to stress in male
rainbow trout. Gen Comp Endocrinol 1995; 98: 311-320.
5. Barton BA, Grosh RS. Effects of AC electroshock on blood features in juvenile rainbow trout. J Fish Biol 1996; 49: 1330-1333. 6. Barton BA, Dwyer WP. Physiological stress effects of
continuous-and pulsed-DC electroshock on juvenile bull trout. J Fish Biol 1997; 51: 998-1008.
7. Pottinger TG, Carrick TR. Modification of the plasma cortisol re-sponse to stress in rainbow trout by selective breeding. Gen Comp Endocrinol 1999; 116: 122-132.
re-feeding in rainbow trout: plasma growth hormone and cortisol levels in relation to energy mobilisation. Comp Biochem Physiol B Biochem Mol Biol 2003; 136: 403-417.
9. Fernandes MO, Volpato GL. Heterogeneous growth in the Nile tilapia: social stress and carbohydrate metabolism. Physiol Behav
1993; 54: 319-323.
10. Barcellos LJG, Nicolaiewsky S, Souza SMG, Lulhier F. Plasmatic levels of cortisol in the response to acute stress in Nile tilapia
Oreochromis niloticus (L.), previously exposed to chronic stress.
Aquac Res 1999; 30: 437-444.
11. Correa SA, Fernandes MO, Iseki KK, Negrao JA. Effect of the establishment of dominance relationships on cortisol and other meta-bolic parameters in Nile tilapia (Oreochromis niloticus). Braz J Med Biol Res 2003; 36: 1725-1731.
12. Alvarenga CM, Volpato GL. Agonistic profile and metabolism in alevins of the Nile tilapia. Physiol Behav 1995; 57: 75-80. 13. Barreto RE, Volpato GL. Caution for using ventilatory frequency as
an indicator of stress in fish. Behav Processes 2004; 66: 43-51. 14. Barreto RE, Volpato GL. Ventilatory frequency of Nile tilapia
sub-jected to different stressors. J Exp Anim Sci 2006; 43: 189-196. 15. Brown C, Gardner C, Braithwaite VA. Differential stress responses
in fish from areas of high- and low-predation pressure. J Comp Physiol [B] 2005; 175: 305-312.
16. Zayan R. The specificity of social stress. Behav Processes 1991; 25: 81-93.
17. Volpato GL, Barreto RE. Environmental blue light prevents stress in the fish Nile tilapia. Braz J Med Biol Res 2001; 34: 1041-1045. 18. Van der Salm AL, Martínez M, Flik G, Bonga SEW. Effects of
husbandry conditions on the skin colour and stress response of red porgy, Pagrus pagrus. Aquaculture 2004; 241: 371-386.
19. Barton BA, Peter RE. Plasma cortisol response in fingerling rainbow trout, Salmo gairdineri Richardson, to various transport conditions, anesthesia, and cold shock. J Fish Biol 1982; 20: 39-51.
20. Frisch AJ, Anderson TA. Physiological stress responses of two species of coral trout (Plectropomus leopardus and Plectropomus maculatus). Comp Biochem Physiol A 2005; 140: 317-327. 21. Moreira PS, Volpato GL. Conditioning of stress in Nile tilapia. J Fish
Biol 2004; 64: 961-969.
22. Volpato GL, Luchiari AC, Duarte CR, Barreto RE, Ramanzini GC. Eye color as an indicator of social rank in the fish Nile tilapia. Braz J Med Biol Res 2003; 36: 1659-1663.
23. Barcellos LJ, Nicolaiewsky S, Souza SM, Lulhier F. The effects of stocking density and social interaction on acute stress response in Nile tilapia Oreochromis niloticus (L.) fingerlings. Aquac Res 1999; 30: 887-892.
24. Biswas AK, Maita M, Yoshizaki G, Takeuchi T. Physiological re-sponses in Nile tilapia exposed to different photoperiod regimes. J Fish Biol 2004; 65: 811-821.
25. Giaquinto PC, Volpato GL. Chemical communication, aggression, and conspecific recognition in the fish Nile tilapia. Physiol Behav
1997; 62: 1333-1338.
26. Barki A, Volpato GL. Early social environment and the fighting behaviour of young Oreochromis niloticus (Pisces, Cichlidae). Be-haviour 1998; 135: 913-929.
27. Gonçalves-de-Freitas E, Nishida SM. Sneaking behaviour of the Nile tilapia. Boletim Técnico do CEPTA 1998; 11: 71-79.
28. Chellappa S, Yamamoto ME, Cacho M, Huntingford FA. Prior resi-dence, body size and the dynamics of territorial disputes between male freshwater angelfish. J Fish Biol 1999; 55: 1163-1170. 29. Turner GF, Huntingford FA. A problem for game theory analyses:
assessment and intention in male mouth brooder contests. Anim Behav 1986; 34: 961-970.
30. Dwyer WP, Shepard BB, White RG. Effect of backpack electroshock on west slope cutthroat trout injury and growth 110 and 250 days post-treatment. N Am J Fish Manage 2001; 21: 646-650.
31. Dolan CR, Miranda LE. Injury and mortality of warm water fishes immobilized by electrofishing. N Am J Fish Manage 2004; 24: 118-127.
32. Trinder P. Determination of blood glucose using an oxidase-peroxi-dase system with a non-carcinogenic chromogen. J Clin Pathol
1969; 22: 158-161.
33. Vijayan MM, Pereira C, Gordon-Grau E, Iwama GK. Metabolic re-sponses associated with confinement stress in tilapia: the role of cortisol. Comp Biochem Physiol C 1997; 116: 89-95.
34. Carneiro PCF, Urbinati EC. Transport stress in matrinxa, Brycon cephalus (Teleostei: Characidae), at different densities. Aquac Int
2002; 10: 221-229.
35. Yavuzcan HY, Pulatsu S, Kurtoglu F. Baseline of haematological and serological parameters of healthy Nile tilapia. Anim Sci Pap Rep
1997; 15: 213-217.
36. Andersen ML, Bignotto M, Machado RB, Tufik S. Different stress modalities result in distinct steroid hormone responses by male rats.
Braz J Med Biol Res 2004; 37: 791-797.
37. Mommsen TP, Vijayan MM, Moon TW. Cortisol in teleosts: dynam-ics, mechanisms of action, and metabolic regulation. Rev Fish Biol Fish 1999; 9: 211-268.
38. Vijayan MM, Ballantyne JS, Leatherland JF. Cortisol-induced changes in some aspects of the intermediary metabolism of Salveli-nus fontinalis. Gen Comp Endocrinol 1991; 82: 476-486.
39. Vijayan MM, Pereira C, Moon TW. Hormonal-stimulation of hepato-cyte metabolism in rainbow-trout following an acute handling stress.
Comp Biochem Physiol C 1994; 108: 321-329.