ISSN 1678-992X
ABSTRACT: This study evaluated pre-slaughter stress and its influence on the stress indicators, quality characteristics and sensory characteristics of Nile tilapia fillets. To this end, two exper-iments were conducted: (1) two transportation times (60 and 240 min), with a density of 200 kg m–3, were compared to control treatment fish (in which the fish were removed from the net cage and immediately euthanized); and (2) two transportation densities (100 and 400 kg m–3), transported for 180 min, compared with control treatment fish. In experiment 1, the transpor-tation time of 60 min resulted in higher levels of serum cortisol and plasma glucose compared to the transportation time of 240 min and the control. Fish fillets transported for 240 min had higher water-holding capacity, less water loss by pressure and higher levels of juiciness com-pared to fish transported for 60 min. Color, pH and water loss during cooking were not affected by transportation time. In experiment 2, transportation densities of 100 and 400 kg m–3 did not significantly affect the stress indicators nor the instrumental quality parameters of the fillets, but fish transported at 400 kg m–3 showed better visual acceptance by panellists.
Keywords: Oreochromis niloticus, pH, colorimetry, water holding capacity, sensory analysis
Effects of transportation stress on quality and sensory profiles of Nile
Elenice Souza dos Reis Goes1*, Jorge Antônio Ferreira de Lara2, Eliane Gasparino3, Marcio Douglas Goes4, Jovana Silva Garbelini Zuanazzi5, Nelson Maurício Lopera-Barrero6, Maria del Pilar Rodriguez Rodriguez3, Pedro Luiz de Castro3, Ricardo Pereira Ribeiro3
1Federal University of Grande Dourados/Faculty of Agricultural Sciences, Rod. Dourados/Itahum, km 12 – 79804-970 – Dourados, MS – Brazil.
2Embrapa Pantanal, R. 21 de Setembro, 1880 – 79320-900 – Corumbá, MS – Brazil.
3State University of Maringá – Dept. of Animal Science, Av. Colombo, 5790 – 87020-900 – Maringá, PR – Brazil. 4Western Paraná State University – Dept. of Animal Science, R. Pernambuco, 1777 – 85960-000 – Marechal Cândido Rondon, PR – Brazil.
5State University of Maringá – Dept. of Food Science. 6State University of Londrina – Dept. of Animal Science, Rod. Celso Garcia Cid, km 380, s/n – 86057-970 – Londrina, PR – Brazil.
*Corresponding author <[email protected]> Edited by: Gerson Barreto Mourão
Received September 22, 2016 Accepted May 17, 2017
Introduction
Pre-slaughter stress is an important issue for the industry, as it directly influences the welfare and meat quality of animals. Studies of fish have shown that pre-slaughter stress affects the color, texture and wa-ter loss of the meat (Stien et al., 2005; Sveinsdóttir et al., 2010; Rahmanifarah et al., 2011; Digre et al., 2011; Goes et al., 2015). The mechanisms that explain these changes in meat quality are related to the depletion of stores of glycogen and muscle adenosine triphosphate (ATP) with an increase in anaerobic glycolysis due to excessive exercise during stress. One of the metabolites resulting from anaerobic activity is lactic acid, which accumulates in muscle and causes a drop in muscle pH (Barton, 2002).
This low pH may account for changes in the qual-ity of the meat because it leads to the early onset of rigor mortis (Bahuaud et al., 2010; Roth et al., 2012) and structural breakdown with higher proteolytic activity (Hultman et al., 2012). The mechanical stress on muscle fibers or connective tissue, which causes the release of proteases, may also contribute to the acceleration of the post-mortem softening of the flesh (Roth et al., 2006). Furthermore, the reduction in water-holding capacity may be related to structural alterations in fish muscle (detachment of the sarcolemma, gaps in the extracellu-lar matrix, widening of the intermyofibrilextracellu-lar space and
transversal shrinkage of the cells) (Olsson et al., 2003). Post-mortem weight loss is of particular interest to aq-uaculture as it represents a direct economic loss for the fishery industry (Jørpeland et al., 2013).
Among the species of fish farmed worldwide, tilapia farming, including Nile tilapia and some other cichlid species, is the most widespread type of aqua-culture in the world (FAO, 2014). In Brazil, Nile tilapia (Oreochromis niloticus) is the most widely cultivated spe-cies with a production of 198.49 thousand tons in 2014 (IBGE, 2014).
Transportation of live fish from the farm to the processing unit is known to cause stress to the fish and leads to a number of physiological responses (Tacchi et al., 2015). In the industry, the arrival of live fish is im-portant so that processing can occur during the period of pre-rigor mortis; fish processed during rigor mortis have impaired flesh quality (Bagni et al., 2007) and low-er fillet yield (Erikson et al., 1997). Thlow-erefore, the study of pre-slaughter stress during the transportation of live fish to the processing unit is important to the provision of strategies to the aquaculture industry for improving fish handling techniques.
The aim of this study was to evaluate the stress caused by transportation at different stocking densities, different transportation times and the influence of these factors on stress, sensory characteristics and the quality of Nile tilapia fillets.
Food Science and T
echnology
|
Resear
ch Ar
ticle
Materials and Methods
The experiments were conducted in accordance with the guidelines of the Brazilian College for Animal Experimentation (COBEA) and approved by the Ethics Committee on the Use of Animals in Research (CEAE) of the State University of Maringá, Maringá, Paraná, Brazil (Protocol 010/2013-CEAE).
Animals
Fish were reared in net cages located in the Corvo River, in the municipality of Diamante do Norte, in the state of Paraná (22°66’ S; 52°78’ W; 255 m). Net cages were stocked with 1,600 juveniles of Nile tilapia, TILA-MAX variety, which were sexually reversed introducing masculinizing hormone 17-α-methyltestosterone into the feed at the larval stage. Animals with 69.75 ± 9.92 g aver-age weight were placed at the initial averaver-age density of 9.3 kg m–3 in net cages, each of which had a capacity of 6
m3 (2.0 × 2.0 × 1.5 m).
Fish were fed three times a day with a commercial diet containing 32 % crude protein and 3500 kcal kg–1
of digestible energy for 210 days. Prior to transportation, the fish (866.86 ± 143.98 g average weight and 33.80 ± 1.63 cm total length) were fasted for 24 h to empty the digestive tract.
Experimental design
To simulate different pre-slaughter handling situa-tions with possible distincsitua-tions between levels of ante-mortem acute stress in individual tilapia, two experiments were conducted to examine different transportation times (Experiment 1) and stocking densities (Experiment 2), simulating the post-harvest transportation of live fish to the meat packing plant. Ten fish were sampled per treat-ment according to the following design:
Experiment 1: Two transportation times (60 and 240
min), with a density of 200 kg m–3, were compared with
control treatment fish (which were removed from the net cage and immediately euthanized);
Experiment 2: Two transportation densities (100 and
400 kg m–3), with transportation for 180 min, were
com-pared with control treatment fish (in which the fish were removed from the net cage and immediately euthanized).
Transportation characteristics
Three boxes for the transportation of live fish were made of glass fiber with a capacity of 1000 L and equipped with diffusers and oxygen cylinders. The three boxes were placed in a fish transportation truck. To per-form the experiment as close to the reality of the industry as possible, 6 g L–1 of sodium chloride were added to the
water used for fish transportation (Oliveira et al., 2009). Initially, fish were randomly taken from the net cages with the aid of a dip net, weighed on a portable scale and then placed in the three transportation boxes,
each of which was stocked with a different density (100, 200 and 400 kg m–3).
The fish were then transported for 60, 180 or 240 min using local roads at speeds simulating transportation between the collection site and the processing unit (50 km h–1). The transportation times (60, 180, and 240 min)
were coordinated with the arrival of the trucks at the pro-cessing unit.
Temperature and dissolved oxygen during transpor-tation were monitored using a portable meter, maintain-ing an average temperature of 25.44 ± 1.29 °C and an average dissolved oxygen rate of 8.05 ± 3.19 mg L–1.
Sampling
Samples were collected when the truck arrived at the processing unit. Each sampling lasted approximately 5 min, during which time the transportation vehicle re-mained parked.
After taking the fish from the transportation box, blood was collected using tail puncture for analyzing glu-cose and cortisol. Subsequently, the fish were sacrificed by sectioning the spinal cord, submersing in ice water and subjecting to the ventral opening of the abdominal cavity from the urogenital opening to the branchial chamber, followed by the careful removal of the viscera to avoid contamination of the meat with faeces. The fish were be-headed, skinned and filleted by hand. The whole skin-less fillets were washed in chlorinated water at 5 ppm, packed, placed in an insulated box with ice (1 ± 1 °C) and transported to the laboratory for meat quality analyses.
Stress indicators: glucose and cortisol
Five fish from each treatment were subjected to blood collection by caudal vein puncture with the aid of disposable syringes; 1 mL blood was used for the plasma glucose analysis and 2 mL of blood for serum cortisol anal-ysis. To separate the plasma, a 1 mL aliquot was poured into a tube containing fluoride EDTA, and centrifuged for 10 min at 2,500 rpm. Next, the supernatant was collected, corresponding to the plasma. Serum was obtained after submerging the blood samples in a water bath at 37 °C for 10 min, followed by centrifugation at 2,500 rpm for 10 min and collection of the supernatant (serum).
To evaluate plasma glucose levels, we used the glu-cose test based on the enzymatic photometric method according to the manufacturer’s instructions. The analy-sis of the serum cortisol level was conducted using mi-croparticle chemiluminescence immunoassay (CMIA) with the Architect 8200 system and a reagent kit of the same brand.
Analysis of pH, color, water loss and water-holding capacity
determined using frozen fillets. The fillets used for WHC analysis were frozen in a freezer at -20 °C for 5 days until analysis.
At 36 h post-mortem, the pH was measured in trip-licate for each of the ten fillets in each treatment group us-ing a portable digital potentiometer, which was equipped with a muscle electrode that was directly inserted into the fillets at three different points (dorsal, central and ventral parts).
At 36 h post-mortem, measurements of lightness were carried out in ten fillets per treatment on the ventral side of the fillet at six different reading points per sample. The values of lightness (L*) were measured using a color-imeter at an angle of 90° at room temperature, where L* indicates the lightness (L*=0 black and L*=100 white) and b* is the yellow-blue component.
Analysis of the water holding capacity (WHC) was performed on ten fillets per treatment as proposed by Lankhmanan et al. (2007). We used an analytical balance to weigh 1 g samples of raw muscle, in triplicate, placed in 1.5 mL tubes fitted with filter paper. The tubes were centrifuged at 1318 × g for 4 min at 4 °C in an Eppendorf centrifuge. Samples were weighed after centrifugation and dried in an oven at 70 °C for 12 h. At the end of this period, the dried samples were weighed again. To calcu-late the WHC, we used the following formula:
WHC PCSW DSW
ISW
%= − ×100 (1)
where: WHC% = water-holding capacity, ISW = ini-tial sample weight, PCSW = post-centrifugation sample weight, and DSW = dry sample weight.
The water loss by pressure was determined in triplicate in five fillets per treatment according to Stad-nik et al. (2008). To measure water loss by pressure, 0.5 g muscle samples were placed between two qualitative filter paper circles 5.5 cm in diameter, 205 µm in thick-ness and 80 g m–2 in weight placed between two square
plates of glass 8 mm in thickness. Uniform pressure was applied to this assembly using a 10 kg weight for 5 min. Then the samples were weighed again and the difference between the initial and final weights was expressed as a percentage.
Water loss during cooking was determined accord-ing to Cason et al. (1997) in ten fillets per treatment. We weighed 70.0 g of muscle on a semi-analytical balance, placed the samples in plastic bags and cooked them in a water bath until the internal temperature reached 75-80 °C as monitored with a digital thermometer. Then, the samples were cooled to 30 °C and weighed again. The difference between the initial and final weights of the muscle was expressed as a percentage indicating the water loss during cooking.
Sensory analysis
For each experiment, we used two tests (acceptance and purchase intent). The tests were performed in accor-dance with Dutcosky (2007) using 90 untrained panellists
selected at random. The judges’ panel was composed of 43 % women and 57 % men; of the total panel, 17 % were aged 17-26 years, 13 % 27-36 years, 33 % 37-46 years, 23 % 47-56 years and 14 % 57-60 years.
To evaluate the sensory acceptance of the fillets, they were initially thawed under refrigeration. The in-clusion of salt in the fillets was made by submerging the fillets in brine with a dose of 10 % common salt for 3 min. The fillets were then cut into cubes of approximate-ly 4 g and grilled on an electric grill with approximateapproximate-ly 2 mL of soybean oil per 100 g meat. One fillet cube of each treatment was offered to each judge, and the differ-ent samples were iddiffer-entified with three random numbers using disposable materials free of extraneous odor. Along with the sensory analysis form, we offered a glass of wa-ter and a salt biscuit, and the judges were instructed to eat a piece of biscuit and drink water between samples.
The panellists were asked to rate the appearance, color, tenderness, juiciness and characteristic taste of the fish using a 9-point hedonic scale ranging from extreme dislike (1) to extreme like (9) (Dutcosky, 2007). Using these data we calculated the acceptability index (AI) of the prod-ucts using the following equation (Dutcosky, 2007):
AI%=average score of the product×
9 100(2)
Additionally, the judges were asked to rate their purchase intent using a 5-point hedonic scale from 1 (defi-nitely would not buy) to 5 (defi(defi-nitely would buy) in accor-dance with Dutcosky (2007).
Statistical analysis
The results, which are presented as the mean ± standard error of the mean, were obtained from the analyses of five fish for glucose, cortisol and water loss by pressure, and from the analyses of ten fish for pH, color, water-holding capacity and water loss during cooking.
Data obtained in the analyses for glucose, cortisol and meat quality were subjected to analysis of variance using the GLM procedure of the Statistical Analysis Sys-tem v. 8.0; wherever significant differences (p < 0.05) were observed, Tukey’s test was applied for the purpose of comparison between treatments.
For the statistical analysis of the sensory analysis results, we used the methodology of the generalized lin-ear models (GENMOD procedure from SAS); we used the gamma distribution for the following variables: color, tenderness, juiciness, characteristic taste of the fish and purchase intent; and we used the normal distribution for the acceptability index. For these analyses, the following contrasts were proposed:
C = µ60 min+µ240 min 2 - 2µcontrol. (sensory analysis 1)
C = µ100 kg m–3 +µ400 kg m–3 - 2µcontrol. (sensory analysis 2)
Results
Experiment 1: Nile tilapia subjected to different transportation times
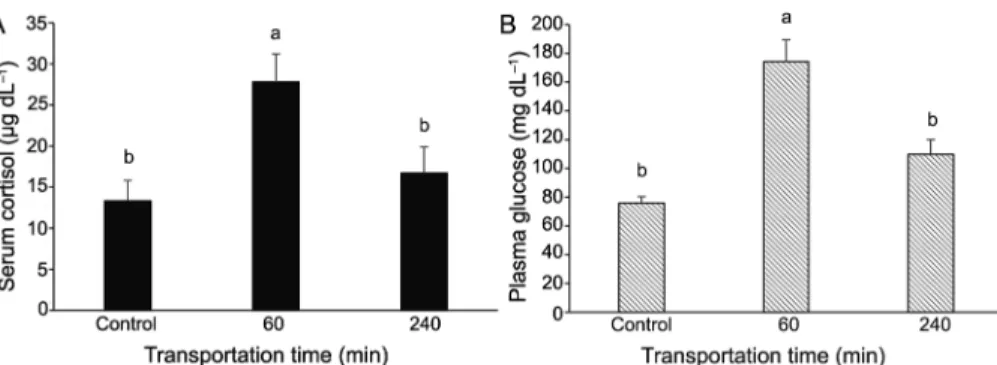
The levels of serum cortisol (Figure 1A) and plasma glucose (Figure 1B) were significantly differ-ent between transportation times 60 and 240 min; at 60 min, tilapia showed higher levels of cortisol (p = 0.0186) and glucose (p = 0.0031). At 240 min, cortisol and glucose levels were similar to the control treat-ment.
Regarding the quality attributes of the evaluated fillets (Table 1), there were no differences (p > 0.05) between the treatments as regards pH, lightness (L*), chroma b* or water loss during cooking.
However, when evaluating water-holding ca-pacity (WHC) and water loss by pressure, 60 min of transportation resulted in fillets with lower WHC (p
= 0.0067) (Figure 1A) and higher water loss by pres-sure (p = 0.0005) (Figure 2B) compared to the 240 min group. Fillets had a higher WHC (60 %) lower water loss by pressure (30 %) when transported for 240 min. The times of 60 and 240 min did not differ from the control treatment for these parameters.
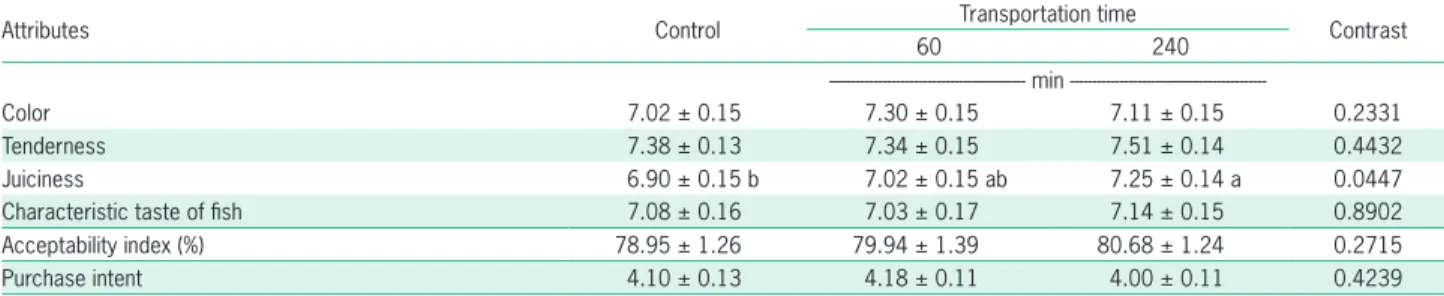
In the sensory analysis, there were no differenc-es (p > 0.05) for the following characteristics: color, tenderness, characteristic taste of fish, acceptability index or purchase intent (Table 2). However, fish fil-lets transported for 240 min showed a higher level of juiciness (7.25) compared to the control fish (6.90).
Experiment 2: Nile tilapia subjected to different transportation densities
Fish subjected to different transportation densi-ties (100 and 400 kg m–3) after 180 min of
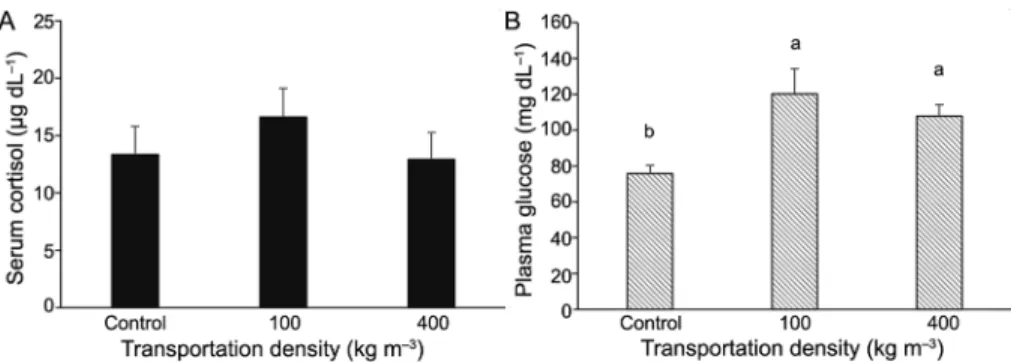
transporta-tion showed no difference (p = 0.5186) in terms of serum cortisol levels; there was also no difference be-tween the densities and the control treatment (Figure 3A). For plasma glucose, the densities of 100 and 400 kg m–3 exhibited similar mean values, both of which
were higher than the control mean (p = 0.0149) (Fig-ure 3B).
With respect to the quality characteristics, the pH was different between the treatments; the density of 400 kg m–3 resulted in fillets with a higher pH (6.20)
compared to the control (5.85) (Table 3). The mean pH of fillets at the density of 100 kg m–3 was similar to
the other treatments (6.04). There were no differences (p > 0.05) between the treatments for lightness (L*), chroma b*, water-holding capacity, water loss by pres-sure or water loss during cooking (Table 3).
With respect to the sensory evaluation of the fillets, there were no differences (p > 0.05) between treatments in terms of tenderness, juiciness, charac-teristic taste of fish or purchase intent (Table 4). How-ever, the color of the fillets transported at the density of 400 kg m–3 reached a higher score (7.39) compared
to the control treatment fillets (7.02) (p = 0.0353). As a result, the acceptability index for fillets at a density of 400 kg m–3 was also higher than the other treatments
(81 %) (p = 0.0237).
Table 1 – Quality attributes of Nile tilapia fillets transported at a density of 200 kg m–3 for 60 or 240 min.
Parameters Control Transportation time p
60 240
min
---pH 5.85 ± 0.12 6.00 ± 0.08 6.11 ± 0.06 0.1781
L* 45.08 ± 0.51 44.99 ± 0.35 43.87 ± 0.42 0.1080
b* 8.16 ± 0.21 7.96 ± 0.29 7.55 ± 0.23 0.2178
Water loss during cooking (%) 22.91 ± 0.79 22.37 ± 1.01 20.90 ± 0.91 0.2831 Data are expressed as the mean ± standard error of the mean (n = 10); L* = lightness (0 black and 100 white), b*(yellow-blue component).
Figure 1 – Serum cortisol (A) and plasma glucose (B) of Nile tilapia transported at a density of 200 kg m–3 for 60 or 240 min. Different letters
Discussion
The change in cortisol blood level is considered a primary response of organisms to stress; glucose, lactate and pH are usually secondary stress indicators (Ellis et al., 2012; Hultmann et al., 2012). In the present study, trans-portation for 60 min resulted in higher levels of serum cortisol and plasma glucose, and the levels of these metab-olites found in the control treatment were re-established at 240 min of transportation (Figure 1A and B), indicating a physiological adaptation of the animals to the transport conditions. Plasma levels of cortisol increase quickly after exposure to an acute stressor and the standard conditions are restored in a few hours (Poli, 2009; El-Khaldi, 2010), showing that Nile tilapia are highly adaptable to stressful situations. The different transportation densities (100 and
400 kg m–3) did not affect the levels of cortisol and glucose,
but the glucose levels in fish transported at these densities were higher than in the control treatment (Figure 3B). Al-though there was no difference in the primary indicator of stress (cortisol) between the different densities, the ob-served hyperglycemia is the body’s response to stress be-cause glucocorticoids, corticosteroids and catecholamines raise the level of blood sugar (Tejpal et al., 2009), which is also related to the release of hepatic glucose, the main reserve carbohydrate in fish (Enes et al., 2009).
Transport stress at different times (60 and 240 min) affected the water-holding capacity (WHC) (Figure 2A) and the water loss by pressure (Figure 2B). The more stressed fish (transported for 60 min at the density of 200 kg m–3)
showed lower WHC and greater water loss by pressure compared to fish transported for 240 min.
Table 2 – Sensory attributes1, acceptability index and purchase intent2 for Nile tilapia fillets transported at a density of 200 kg m–3 for 60 or 240 min.
Attributes Control Transportation time Contrast
60 240
min
---Color 7.02 ± 0.15 7.30 ± 0.15 7.11 ± 0.15 0.2331
Tenderness 7.38 ± 0.13 7.34 ± 0.15 7.51 ± 0.14 0.4432
Juiciness 6.90 ± 0.15 b 7.02 ± 0.15 ab 7.25 ± 0.14 a 0.0447
Characteristic taste of fish 7.08 ± 0.16 7.03 ± 0.17 7.14 ± 0.15 0.8902
Acceptability index (%) 78.95 ± 1.26 79.94 ± 1.39 80.68 ± 1.24 0.2715
Purchase intent 4.10 ± 0.13 4.18 ± 0.11 4.00 ± 0.11 0.4239
1Hedonic scale between 1 (dislike extremely) and 9 (like extremely); 2Hedonic scale between 1 (definitely would not buy) and 5 (definitely would buy); Mean values in the same row followed by different letters are significantly different according to a t-test; Data are expressed as the mean ± standard error of the mean (n = 90).
Table 3 – Quality characteristics of Nile tilapia fillets transported for 180 min at densities of 100 or 400 kg m–3.
Parameters Control Transportation density p
100 400
--- kg m–3
---pH 5.85 ± 0.12 b 6.04 ± 0.08 ab 6.20 ± 0.06 a 0.0458
L* 45.08 ± 0.51 43.90 ± 0.45 45.32 ± 0.65 0.1587
b* 8.16 ± 0.21 7.57 ± 0.25 7.83 ± 0.32 0.3040
Water-holding capacity (%) 58.33 ± 0.30 58.93 ± 0.41 59.10 ± 0.38 0.3134
Water loss by pressure (%) 31.92 ± 0.40 30.16 ± 1.06 31.76 ± 0.77 0.2526
Water loss during cooking (%) 22.91 ± 0.79 21.39 ± 1.09 20.80 ± 1.20 0.3493 Mean values in the same row followed by different letters are significantly different according to Tukey’s test (p < 0.05); Data are expressed as the mean ± standard error of the mean (n = 10); L* = lightness (0 black and 100 white), b*(yellow-blue component).
Figure 2 – Water-holding capacity (WHC) (A) and water loss by pressure (B) in Nile tilapia fillets transported at a density of 200 kg m–3 for 60 or
Several studies have linked pre-slaughter stress with decreased WHC in fish (Bjørnevik and Solbakken, 2010; Digre et al., 2011; Hultmann et al., 2012; Goes et al., 2015). Water- (or liquid-) holding capacity (also called water-binding capacity) can be defined as the amount of water left after centrifugation relative to either the wa-ter present before centrifugation or to the dry weight (Andersen and Jørgensen, 2004). Methods that measure water retention in muscle refer to the amount of liquid retained in a protein system by the application of force according to the measurement conditions. No absolute figures exist since the amount of loose water depends on the type and amount of force applied (Jauregui et al., 1981). Various techniques have been used for the deter-mination of WHC, such as drip loss (Honikel, 1998; Otto et al., 2004), filter paper wetness (Brøndum et al., 2000), cooking/heating loss (Aaslyng et al., 2003), the centrifuge force method (Zhang et al., 1995), thawing loss, process-ing loss, technological yield, etc. (Bertram et al., 2003; Prevolnik et al., 2010). Factors that influence WHC in-clude the levels of lactic acid, inosine monophosphate, adenosine triphosphate (ATP), inosine, glycogen, pH, and the temperature of the muscle (Schäfer et al., 2002). Lund et al. (2011) reported that the ability of the mus-cle to retain water is affected by several factors, such as pH, post-mortem protein oxidation, proteolytic activ-ity of the meat-tenderizing enzymes, and cross-linking of myofibrillar proteins. In particular, WHC is affected
by pH; the pH near the isoelectric point of proteins de-creases the WHC (Huff-Lonergan and Lonergan, 2005). Nevertheless, in this study, it was not possible to con-nect changes in WHC to the pH of the muscle at 36 h post-mortem because there was no difference in pH for different transportation times (60 and 240 min) (Table 1). Differences in pH were found between fish sub-jected to different transportation densities, a higher den-sity resulting in higher pH (6.20) compared to the control treatment (5.85) (Table 3). Slaughter immediately after harvesting may have caused a faster consumption of gly-cogen with an increasing anaerobic respiration rate, re-sulting in increased production of lactic acid which low-ers the pH of the meat relative to the two fish densities (100 and 400 kg m–3), which had been transported for
180 min and possibly had time to restore glycogen rates. However, these changes in pH were not able to influ-ence the other quality parameters of the meat (Table 3). The greater water losses observed in the fillets of more stressed fish in this study affected the juiciness of the meat, corroborating previous studies by Huff-Lon-ergan and LonHuff-Lon-ergan (2005). In the sensory analysis, the fillets that were transported for 240 min had higher WHC, less water loss by pressure, and better scores for juiciness. For the consumer, a higher water-holding ca-pacity brings the sensation of juiciness during chewing (Desmond, 2006), which is corroborated by the results of this study.
Table 4 – Sensory attributes1, acceptability index and purchase intent2 for Nile tilapia fillets transported for 180 min at densities of 100 or 400
kg m–3.
Attributes Control Transportation density Contrast
100 400
--- kg m–3
---Color 7.02 ± 0.15 b 7.15 ± 0.16 ab 7.39 ± 0.14 a 0.0353
Tenderness 7.38 ± 0.13 7.38 ± 0.16 7.53 ± 0.14 0.5108
Juiciness 6.90 ± 0.15 6.90 ± 0.15 7.17 ± 0.14 0.1558
Characteristic taste of fish 7.08 ± 0.16 6.92 ± 0.16 7.19 ± 0.16 0.4142
Acceptability index (%) 78.95 ± 1.26 b 78.96 ± 1.45 b 81.45 ± 1.29 a 0.0237
Purchase intent 4.10 ± 0.13 3.98 ± 0.11 4.21 ± 0.10 0.1963
1Hedonic scale between 1 and 9; 2Hedonic scale between 1 and 5; Mean values in the same row followed by different letters are significantly different according to a t-test; Data are expressed as the mean ± standard error of the mean (n = 90).
Figure 3 – Serum cortisol (A) and plasma glucose (B) of Nile tilapia transported for 180 min at densities of 100 and 400 kg m–3. Different letters
Despite the lack of differences in the values of lightness (L*) and chroma b* between fillets transported at different densities (100 and 400 kg m–3), fish
transport-ed at 400 kg m–3 showed better scores for the attribute
of color and higher scores on the sensory acceptability index (Table 4). However, as there were no differences be-tween the stress indicators and meat quality parameters between the two densities, it was not possible to connect the results obtained in the sensory analysis with the oth-er results. The sensory evaluation of Atlantic cod (Gadus morhua) fillets showed that fish slaughtered with anes-thetic showed a brighter surface color than the fillets of fish exposed to pre-slaughter stress, but the tasters did not notice differences in odor, flavor nor texture (Digre et al., 2011). Meanwhile, differences in the fillet texture of cod slaughtered with and without ante-mortem stress were observed by trained tasters (Sveinsdóttir et al., 2010).
The sensory attributes evaluated in both sensory analyses showed values between 6.90 and 7.53 for the characteristics of color, tenderness, juiciness and the char-acteristic taste of the fish. Considering that on the hedon-ic scale, the values 6 and 8 correspond to “like slightly” and “like very much”, respectively, these results indicate a favorable attitude toward Nile tilapia by the judges, a fact corroborated by the acceptability indices above 70 % [Dutcosky (2007) recommended a minimum accepta-bility index of 70 % for the product to be well accepted]. Moreover, the value observed for purchase intent was 3.98. Because the score 4 represented the choice “would possibly buy”, this result suggests that the tasters would probably show interest in buying the Nile tilapia fillets.
Conclusions
Fish with lower levels of serum cortisol and plas-ma glucose (subjected to 240 min of transportation at a density of 200 kg m–3) had meat with a greater
water-holding capacity, less water loss by pressure and greater juiciness compared to fish with increased levels of se-rum cortisol and plasma glucose (subjected to 60 min of transportation at a density of 200 kg m–3). Transportation
densities of 100 and 400 kg m–3 at 180 min of
transporta-tion showed no influence on the stress indicators and instrumental quality parameters of the fillets, but fish transported at 400 kg m–3 showed better visual
accep-tance by panellists.
The results demonstrate that lower pre-slaughter stress of Nile tilapia can reduce the water loss of fillets, an important factor in the avoidance of economic losses due to weight loss and the sensory quality of fillets in the fish processing industry.
References
Aaslyng, M.D.; Bejerholm, C.; Ertbjerg, P.; Bertram, H.C.; Andersen, H.J. 2003. Cooking loss and juiciness of pork in relation to raw meat quality and cooking procedure. Food Quality and Preference 14: 277-288.
Andersen, C.M.; Jørgensen, B.M. 2004. On the relation between water pools and water holding capacity in cod muscle. Journal of Aquatic Food Product Technology 13: 13-23
Bagni, M.; Civitareale, C.; Priori, A.; Ballerini, A.; Finoia, M.; Brambilla, G.; Marino, G. 2007. Pre-slaughter crowding stress and killing procedures affecting quality and welfare in sea bass (Dicentrarchus labrax) and sea bream (Sparus aurata). Aquaculture 263: 52-60.
Bahuaud, D.; Mørkøre, T.; Østbye, T.K.; Veiseth-Kent, E.; Thomassen, M.S.; Ofstad, R. 2010. Muscle structure responses and lysosomal cathepsins B and L in farmed Atlantic salmon (Salmo salar L.) pre-and post-rigor fillets exposed to short and long-term crowding stress. Food Chemistry 118: 602-615.
Barton, B.A. 2002. Stress in fishes: a diversity of responses with particular reference to changes in circulating corticosteroids. Integrative and Comparative Biology 42: 517-525.
Bertram, H.C.; Andersen, H.J.; Karlsson, A.H.; Horn, P.; Hedegaard, J.; Nørgaard, L.; Engelsen, S.B. 2003. Prediction of technological quality (cooking loss and Napole Yield) of pork based on fresh meat characteristics. Meat Science 65: 707-712.
Bjørnevik, M.; Solbakken, V. 2010. Preslaughter stress and subsequent effect on flesh quality in farmed cod. Aquaculture Research 41: e467-e474.
Brøndum, J.; Munck, L.; Henckel, P.; Karlsson, A.; Tornberg, E.; Engelsen, S.B. 2000. Prediction of water-holding capacity and composition of porcine meat by comparative spectroscopy. Meat Science 55: 177-185.
Cason, J.A.; Lyon, C.E.; Papa, C.M. 1997. Effect of muscle opposition during rigor on development of broiler breast meat tenderness. Poultry Science 76: 725-787.
Desmond, E. 2006. Reducing salt: a challenge for the meat industry. Meat Science 74: 188-196.
Digre, H.; Erikson, U.; Skaret, J.; Lea, P.; Gallart-Jornet, L.; Misimi, E. 2011. Biochemical, physical and sensory quality of ice-stored Atlantic cod (Gadus morhua) as affected by pre-slaughter stress, percussion stunning and AQUI-S™ anaesthesia. European Food Research and Technology 233: 447-456.
Dutcosky, S.D. 2007. Sensory Analysis of Food = Análise Sensorial de Alimentos. 2ed. Editora Champagnat, Curitiba, PR, Brazil (in Portuguese).
El-Khaldi, A.T. 2010. Effect of different stress factors on some physiological parameters of Nile tilapia (Oreochromis
niloticus). Saudi Journal of Biological Sciences 17: 241-246.
Ellis, T.; Yildiz, H.Y.; López-Olmeda, J.; Spedicato, M.T.; Tort, L.; Øverli, Ø.; Martins, C.I. 2012. Cortisol and finfish welfare. Fish Physiology and Biochemistry 38: 163-188.
Enes, P.; Panserat, S.; Kaushik, S.; Oliva-Teles, A. 2009. Nutritional regulation of hepatic glucose metabolism in fish. Fish Physiology and Biochemistry 35: 519-539.
Erikson, U.; Sigholt, T.; Seland, A. 1997. Handling stress and water quality during live transportation and slaughter of Atlantic salmon (Salmo salar). Aquaculture 149: 243-252. Food and Agriculture Organization of the United Nations [FAO].
Goes, E.S.R.; Lara, J.A.F.; Gasparino, E.; Del Vesco, A.P.; Goes, M.D.; Alexandre Filho, L.; Ribeiro, R.P. 2015. Pre-slaughter stress affects ryanodine receptor protein gene expression and the water-holding capacity in fillets of the Nile tilapia. Plos One 10: e0129145.
Honikel, K.O. 1998. Reference methods for the assessment of physical characteristics of meat. Meat Science 49: 447-457. Huff-Lonergan, E.; Lonergan, S.M. 2005. Mechanisms of
water-holding capacity of meat: the role of postmortem biochemical and structural changes. Meat Science 71: 194-204.
Hultmann, L.; Phu, T.M.; Tobiassen, T.; Aas-Hansen, Ø.; Rustad, T. 2012. Effects of pre-slaughter stress on proteolytic enzyme activities and muscle quality of farmed Atlantic cod (Gadus
morhua). Food Chemistry 134: 1399-1408.
Instituto Brasileiro de Geografia e Estatística [IBGE]. 2014. Municipal Livestock Production = Produção da Pecuária Municipal. IBGE, Rio de Janeiro, RJ, Brazil (in Portuguese). Jauregui, C.A.; Regenstein, J.M.; Baker, R.C. 1981. A simple
centrifugal method for measuring expressible moisture, a water-binding property of muscle foods. Journal of Food Science 46: 1271-1273.
Jørpeland, G.; Imsland, A.; Stien, L.H.; Bleie, H.; Roth, B. 2013. Effects of filleting method, stress, storage and season on the quality of farmed Atlantic cod (Gadus morhua L.). Aquaculture Research 46: 1-11.
Lankhmanan, R.; Parkinson, J.A.; Piggott, J.R. 2007. High-pressure processing and water holding capacity of fresh and cold-smoked salmon (Salmo salar). LWT - Food Science and Technology 40: 544-551.
Lund, M.N.; Heinonen, M.; Baron, C.P.; Estévez, M. 2011. Protein oxidation in muscle foods: a review. Molecular Nutrition & Food Research 55: 83-95.
Oliveira, J.R.; Carmo, J.L.; Oliveira, K.K.C.; Soares, M.C.F. 2009. Sodium chloride, benzocaine and clove oil in tilapia transport water. Revista Brasileira de Zootecnia, 38: 1163-1169 (in Portuguese, with abstract in English).
Olsson, G.B.; Olsen, R.L.; Ofstad, R. 2003. Post-mortem structural characteristics and water-holding capacity in Atlantic halibut muscle. LWT - Food Science and Technology 36: 125-133. Otto, G.; Roehe, R.; Looft, H.; Thoelking, L.; Kalm, E. 2004.
Comparison of different methods for determination of drip loss and their relationships to meat quality and carcass characteristics in pigs. Meat Science 68: 401-409.
Poli, B.M. 2009. Farmed fish welfare-suffering assessment and impact on product quality. Italian Journal of Animal Science 8: 139-160.
Prevolnik, M.; Čandek-Potokar, M.; Škorjanc, D. 2010. Predicting pork water-holding capacity with NIR spectroscopy in relation to different reference methods. Journal of Food Engineering 98: 347-352.
Rahmanifarah, K.; Shabanpour, B.; Sattari, A. 2011. Effects of clove oil on behavior and flesh quality of common carp
(Cyprinus carpio L.) in comparison with pre-slaughter CO2
stunning, chilling and asphyxia. Turkish Journal of Fisheries and
Aquatic Sciences 11: 139-147.
Roth, B.; Slinde, E.; Arildsen, J. 2006. Pre or post mortem muscle activity in Atlantic salmon (Salmo salar). The effect on rigor mortis and the physical properties of flesh. Aquaculture 257: 504-510.
Roth, B.; Grimsbø, E.; Slinde, E.; Foss, A.; Stien, L.H.; Nortvedt, R. 2012. Crowding, pumping and stunning of Atlantic salmon, the subsequent effect on pH and rigor mortis. Aquaculture 326-329: 178-180.
Schäfer, A.; Rosenvold, K.; Purslow, P.P.; Andersen, H.J.; Henckel, P. 2002. Physiological and structural events post mortem of importance for drip loss in pork. Meat Science 61: 355-366. Stadnik, J.; Dolatowski, Z.J.; Baranowska, H.M. 2008. Effect
of ultrasound treatment on water holding properties and microstructure of beef (m. semimembranosus) during ageing. LWT - Food Science and Technology 41: 2151-2158.
Stien, L.H.; Hirmas, E.; Bjørnevik, M.; Karlsen, Ø.; Nortvedt, R.; Rørå, A.M.B.; Sunde, J.; Kiessling, A. 2005. The effects of stress and storage temperature on the colour and texture of pre-rigor filleted farmed cod (Gadus morhua L.). Aquaculture Research 36: 1197-1206.
Sveinsdóttir, K.; Martinsdóttir, E.; Thórsdóttir, F.; Schelvis, R.; Kole, A.; Thórsdóttir, I. 2010. Evaluation of farmed cod products by a trained sensory panel and consumers in different test settings. Journal of Sensory Studies 25: 280-293.
Tacchi, L.; Lowrey, L.; Musharrafieh, R.; Crossey, K.; Larragoite, E.T.; Salinas, I. 2015. Effects of transportation stress and addition of salt to transport water on the skin mucosal homeostasis of rainbow trout (Oncorhynchus mykiss). Aquaculture 435: 120-127.
Tejpal, C.S.; Pal, A.K.; Sahu, N.P.; Kumar, J.A.; Muthappa, N.A.; Vidya, S.; Rajan, M.G. 2009. Dietary supplementation of L-tryptophan mitigates crowding stress and augments the growth in Cirrhinus mrigala fingerlings. Aquaculture 293: 272-277.