Effect of the establishment of
dominance relationships on cortisol
and other metabolic parameters in
Nile tilapia (
Oreochromis niloticus
)
1Departamento de Ciências Básicas, Faculdade de Zootecnia e Engenharia
de Alimentos, Universidade de São Paulo, Pirassununga, SP, Brasil 2Departamento de Fisiologia Animal, Universidade Federal do Paraná,
Curitiba, PR, Brasil
3Departamento de Fisiologia, Instituto de Biologia, Universidade de São Paulo,
São Paulo, SP, Brasil S.A. Corrêa1,
M.O. Fernandes2, K.K. Iseki3 and J.A. Negrão1
Abstract
The objective of the present study was to investigate the influence of the establishment of dominance relationships and social stress on plasma cortisol and metabolite levels in Nile tilapia (Oreochromis
niloticus). During the 30-day experiment, the fish weighing 236 ± 29 g
were kept in individual aquaria, except for two pairings lasting 6 h each. Blood samples were taken from the animals before and after pairing. Display, approach, attack, rebuff, chase flight, and coloration were carried out on days 16 and 30. Activities and behaviors charac-teristic of the establishment of dominance relationships were de-scribed. It was possible to classify all experimental fish (N = 30) as dominant or subordinate. No differences were detected between domi-nant (N = 15) and subordinate (N = 15) fish during isolation or after pairing in cortisol (isolated: 5.76 ± 0.98 vs 5.42 ± 0.63; paired: 10.94 ± 1.62 vs 11.21 ± 2.45 µg/dl), glucose (isolated: 60.02 ± 4.9 vs 67.85 ± 16.16; paired: 110.44 ± 15.72 vs 136.26 ± 22.46 mg/dl), triglyceride (isolated: 167.87 ± 5.06 vs 185.68 ± 7.24; paired: 210.85 ± 13.40 vs 221.82 ± 12.70 mg/dl) or total protein levels (isolated: 7.01 ± 0.42 vs 6.69 ± 0.59; paired: 9.21 ± 0.62 vs 9.51 ± 0.66 g/dl). However, when isolated (N = 30) and paired (N = 30) tilapia were compared, there were significant differences in cortisol and metabolite levels. The similar response presented by dominant and subordinate tilapia indi-cates that establishment of dominance relationships was a stressor for both groups.
Correspondence
S.A. Corrêa
Departamento de Ciências Básicas Faculdade de Zootecnia e Engenharia de Alimentos, USP 13630-000 Pirassununga, SP Brasil
E-mail: [email protected] Research supported by FAPESP and CAPES.
Received January 22, 2003 Accepted August 20, 2003
Key words
•Tilapia •Social stress •Social relationships •Agonistic behaviors •Cortisol
•Dominance
Introduction
A phenomenon commonly described in territorial species such as Nile tilapia ( Oreo-chromis niloticus) is social stress (1-3). Some-times, social interactions stimulate an
On a long-term basis, an increase in cor-tisol concentration has been directly associ-ated with a decrease in growth rate in fish (6). Barton and Iwama (8) have also ob-served that exogenous cortisol administra-tion induced a remarkable decrease in the growth rate of rainbow trout (Oncorhynchus mikiss). Moreover, subordinate fish showed a lower growth rate than dominant animals (2,9,10).
Some investigators have proposed that physiological responses to social stress are more marked in subordinate animals due to a larger energy expense during agonistic con-frontations (5,11). Others have suggested that triglycerides are also mobilized in re-sponse to stress (12,13). An increase in plasma glucose levels has also been observed in fish submitted to acute and chronic stress (14,15). It is likely that the mass loss in animals submitted to chronic stress is the result of protein mobilization due to increased cortisol levels which enhance the availabil-ity of energy (16,17). On the other hand, Stott (18) suggested that cortisol levels can only be related to stress during and immedi-ately after submission to stressors.
However, it is not clear whether agonis-tic confrontation can cause metabolic and hormonal changes. It is well known that tilapia of similar age and genetic background submitted to similar environments, nutrition and management can have different growth levels. This heterogeneity is due in part to the fact that dominant fish have priority of access to food compared to subordinate fish. However, before studying the effect of so-cial relationships on growth it is necessary to determine how the establishment of domi-nance relationships can cause metabolic and hormonal adjustments. On this basis, the objective of the present study was to investi-gate the influence of the establishment of dominance relationships (and the social stress involved) on cortisol, glucose, triglyceride and total protein levels in dominant and subordinate Nile tilapia.
Material and Methods
Pellet ration for fish (Socil, Descalvado, SP, Brazil) was offered to the tilapia through-out the experiment at 3% of body mass. A filtering system with constant aeration was installed in the aquaria, and each aquarium was cleaned weekly. Water quality (dissolved oxygen, ammonia, nitrate, nitrite and pH) was monitored weekly. Ambient tempera-ture was maintained with an air conditioning system and water temperature was kept at 26 ± 7ºC throughout the experiment. The pho-toperiod used was a 12-h light-dark cycle, with lights on at 6:00 am.
Pre-experimental procedure
Thirty male Nile tilapia weighing 236 ± 29 g were identified individually with plastic tags on the dorsal fin and transferred to 30 different glass aquaria (separated to prevent visual contact). Each aquarium (70 x 30 x 30 cm) had a capacity of 63 liters. The fish were weighed and measured weekly and food in-take was quantified at 5-day intervals during an adaptation period of 15 days. At the end of this pre-experimental phase, all fish had maintained or gained mass and therefore were considered to have adapted to the ex-perimental conditions.
Experimental procedure
During the experimental period of 30 days, each tilapia remained in an individual aquarium (no visual contact, free of social stress), except during the period of pairing (social stress imposed). Each pairing took place in a neutral aquarium to avoid a “previ-ous residence” effect. Fifteen pairs of exper-imental fish of similar size and body mass were transferred to this neutral aquarium for 6 h on days 16 and 30. The same pairs of individual fish were tested on the two exper-imental days.
meas-ured and weighed, and a blood sample was removed by caudal vein puncture for indi-vidual measurements before pairing. The fish were then carefully removed from their indi-vidual aquaria and paired for 6 h (social stress imposed). At the end of pairing, all fish were submitted to a second blood sam-pling for measurements after exposure to social stress (paired measures). The capture, anesthetic procedure, measurement, weigh-ing and blood samplweigh-ing (approximately 1 ml of blood) lasted a total of 2 min, based on the procedure reported by Auperin et al. (19).
Dominance relationships
Behavioral observations were conducted on days 16 and 30 during the 6-h period of pairing. During this monitoring period we noted the following behaviors: display, ap-proach, attack, rebuff, chase and flight (see Results for descriptions). Simultaneously, we noted the position (upper, intermediate or lower, and left or right) of each fish in the aquarium. These data were used to deter-mine the social rank (dominant or subordi-nate) of each fish in the pairing. Thus, 15 fish were classified as dominant, and the other 15 fish were classified as subordinate. It is im-portant to note that the dominance relation-ships remained the same in the second pair-ing.
All pairing experiments were completely recorded on videotape. Five minutes at the beginning and at the end of the video were then observed to determine the pigmentation of each fish (silver with sharp black stripes or dark gray without black stripes) and the frequency of agonistic behaviors (total num-ber of attacks plus rebuffs) initiated by each fish.
Hormonal and metabolic analysis
Blood samples were collected into chilled tubes and immediately centrifuged at 1500 g for 15 min at 4ºC, and plasma was stored at
-20ºC until analysis. Commercial enzymatic kits were used (Weiner Laboratory, Rosario, Argentina) to determine plasma levels of glucose, triglycerides and total proteins. Af-ter validation, plasma cortisol levels were determined by enzyme immunoassay (EIA), with an interassay and intra-assay coeffi-cient of variation of 6.1 and 10.52%, respec-tively, using commercial kits (Diagnostic System Laboratories, Inc., Webster, TX, USA).
Statistical analysis
Statistical comparison of the means for all parameters were carried out using GraphPad (20) and the Kruskal-Wallis test, with the level of significance set at P < 0.05. Correlations between the parameters ana-lyzed were determined by the Pearson corre-lation test using the SAS System for Win-dows, version 6.12 (21). All data are re-ported as means ± SEM.
Results
At the beginning of pairing, both fish swam and displayed a silver coloration with sharp black stripes. They then swam closer to one another, approached, attacked (in gen-eral with tail beating), and fled. A few min-utes later, the paired fish became more ag-gressive and attacked or reacted with a vig-orous rebuff, such as mouth fighting and ramming. During this period of intensive interaction, both fish presented a light col-oration, without black stripes. Sometimes, one of the fish chased and bit the flanks of the other fish that was fleeing. However, challenged fish mostly rebuffed attacks and another confrontation began. As shown in Figure 1, at the beginning of pairing there was no significant difference in the number of agonistic behaviors initiated by dominant or subordinate fish. Confrontations were rare after 2.5 h.
Figure 1. Number of agonistic be-haviors (attacks plus rebuffs) initi-ated during the first (1) and last (2) 5 min of pairing of dominant (Dom) and subordinate (Sub) Nile tilapia. Data are reported as means ± SEM for 15 fish. Data for days 16 and 30 were combined. Significantly dif-ferent (P < 0.05) means are indi-cated by different letters (Kruskal-Wallis test).
Figure 2. Plasma cortisol (A), glu-cose (B), triglycerides (C) and to-tal protein (D) observed in domi-nant (Dom) and subordinate (Sub) Nile tilapia while isolated (Isol) and after pairing (Pair). Data are reported as means ± SEM for 15 fish. Significantly differ-ent means (P < 0.05) are indi-cated by different letters (Tukey test).
Cortisol (µg/dl)
14 12
a
b
Isolated Paired
a
b
a
b
Glucose (mg/dl)
150 100
Triglycerides (mg/dl)
200 150 100
Total protein (g/dl)
10 5
A B
C D
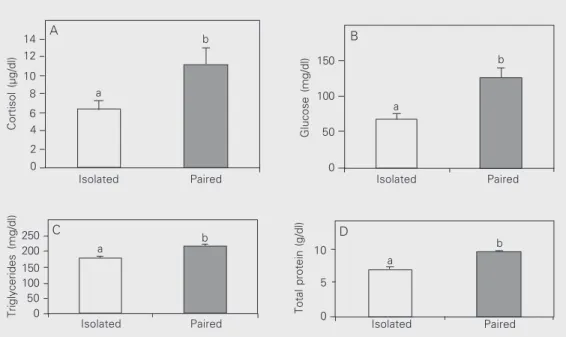
Figure 3. Plasma cortisol (A), glu-cose (B), triglyceride (C) and to-tal protein (D) levels observed in Nile tilapia while isolated and af-ter pairing. Data are reported as means ± SEM for 30 fish. Sig-nificantly different means (P < 0.05) are indicated by different letters (Tukey test).
10 8 6 4 2 0
Isolated Paired 0
50
250
0 50
Isolated Paired 0 Isolated Paired
a b
Agonistic behaviors
a a
a
b Dom 1 Sub 1 Dom 2 Sub 2 7
6 5 4 3 2 1
Cortisol (µg/dl
)
12 8 4
a
a
b b
Dom/Isol Sub/Isol Dom/Pair Sub/Pair
a
a
b
b
a a
b b
Glucose (mg/dl)
150 100 50
Triglycerides (mg/dl)
250 200 150 100
50 Total protein (g/dl) 10
8 6 4 2
A B
C
D
Dom/Isol Sub/Isol Dom/Pair Sub/Pair
Dom/Isol Sub/Isol Dom/Pair Sub/Pair Dom/Isol Sub/Isol Dom/Pair Sub/Pair a a
b b 0
0
0
dominant fish as the one having a silver col-oration with sharp black stripes, swimming normally, and that chased and occasionally attacked the other fish when approached. At the same time, subordinate fish had a dark gray coloration without stripes and did not rebuff the aggressive behaviors of the other fish. Furthermore, subordinate fish remained in the section of the aquarium opposite to the dominant fish and avoided the dominant fish. During this phase, subordinate fish rarely attacked dominant fish and there was a sig-nificant increase in the number of agonistic behaviors initiated by the dominant fish com-pared to the subordinate fish (Figure 1). In general, subordinate fish swam slowly and showed a higher number of injures (wounds with scales missing) than dominant fish.
Glucose, triglyceride, total protein and plasma cortisol levels were not significantly different between fish classified as domi-nant and subordinate, either during isolation or after pairing (Figure 2). However, glu-cose, triglyceride, total protein and plasma cortisol levels measured during isolation were lower than those measured after pairing for the fish as a whole (see Figure 3).
There were no differences in body mass, size or feed intake between dominant and subordinate fish during the experiment. Com-pared to the beginning of the experiment, however, there were numerical increases in body mass (from 236.10 ± 5.60 to 243.57 ± 5.80 g), length (from 19.10 ± 0.22 to 19.30 ± 0.20 cm) and feed intake (from 7.50 ± 0.25 to 9.45 ± 0.50 g/day) at the end of the experi-mental period.
There were positive correlations between levels measured during isolation and after pairing for glucose (r = 0.29, P < 0.05) and triglyceride levels (r = 0.45, P < 0.05), but not for cortisol or total protein levels. At the same time, there was a positive correlation between glucose and cortisol levels (r = 0.65, P < 0.05). However, there was a negative correlation between glucose and triglyceride levels (r = - 0.47, P < 0.05). Cortisol and
triglyceride levels were not correlated and total protein levels were not correlated with any of the other three parameters.
Discussion
Activities and behaviors characteristic of the establishment of dominance relationships were observed during all pairings and it was possible to classify all experimental fish as dominant or subordinate because dominance relationships had been clearly established by the end of pairing. This classical response to acute stress has been previously described in tilapia by others (1,3,5). Our results also agree with those reported by Peters et al. (14) and Domingues (22) who showed that, al-though subordinate fish suffer a greater num-ber of attacks than dominant fish, the domi-nance status is not a good indicator of the stress level.
ap-proaches and threats lead to attacks, rebuffs and fights (2).
In the present study, experimental fish were kept isolated, except during pairing when two fish were transferred to a neutral aquarium. In this case, imposed acute stress can be hypothesized to be more intense than in a group, because the agonistic behaviors, mainly from dominants, were focused on a single animal. Consequently, we observed a clearly significant difference in cortisol lev-els between isolated and paired tilapia. This has been previously described in tilapia sub-mitted to different stressful situations (1,3). In contrast, Ejike and Schreck (4) observed lower glycogen levels and similar cortisol levels when comparing dominant and soli-tary salmon. Thus, these investigators sug-gested that complete isolation is not a healthy situation. However, our results did not con-firm theirs because the same tilapia had lower levels of cortisol, glucose, triglyceride and total protein when isolated than when paired, suggesting that acute stress caused a mobili-zation of extra energy.
As observed in the present study, work carried out with other species of fish has demonstrated that different kinds of stress cause an increase in glucose levels (2,15,23). These studies also reported that high cortisol levels were positively correlated with high glucose levels. For these reasons, it is pos-sible to confirm that stress caused an addi-tional mobilization of glucose. At the same time, establishment of dominance
relation-ships caused an increase in triglyceride lev-els in our study. This supports other studies showing that high cortisol and catecholamine levels cause an increase in lipase activity which promotes the breakdown of triglyceri-des in fat cells and consequently increases triglyceride levels in plasma (12,13).
In the present study, the establishment of dominance relationships also caused a mo-bilization of protein as a source of energy. During the increase in energy demand pro-voked by stress, increased cortisol levels promote the mobilization of muscular pro-tein in trout (2,16,17). Some investigators have not observed a significant increase in total protein levels in fish submitted to social stress (5,14). It is important to note that the mobilization of protein as an energy source has been observed in animals submitted to chronic stress (7,24). In the chronic case, the increase in plasma cortisol concentrations is directly related to a decrease in growth rate (6). However, our data on food intake, body mass and length were not affected by the imposed acute stress, probably because the duration of pairing was not sufficiently long to affect fish development.
During pairing, the intense agonistic in-teractions caused a significant increase in the plasma levels of cortisol and the metabo-lites analyzed. The similarity of response shown by dominant and subordinate animals indicates that the establishment of domi-nance relationships was a stressor for both groups.
References
1. Faisal M & Chiappelli F (1989). Role of endogenous opioids in modulating some immune functions in hybrid tilapia. Journal of Aquatic Animal Health, 1: 301-306.
2. Volpato GL & Fernandes MO (1994). Social control growth in fish.
Brazilian Journal of Medical and Biological Research, 27: 797-810. 3. Barcellos LJG, Nocolaiewsky S, Souza SMG & Lulhier F (1999). The
effect of stocking density and social interactions on acute stress response in Nile tilapia (Oreochromis niloticus) fingerlings. Aquacul-ture Research, 30: 887-892.
4. Ejike C & Schreck CB (1980). Stress and social hierarchy rank in
coho salmon. Transactions of the American Fisheries Society, 109: 423-426.
5. Fernandes MO (1997). Estresse social, metabolismo e crescimento em peixes. Doctoral thesis, Universidade Estadual Paulista, Botu-catu, SP, Brazil.
6. Pickering AD (1993). Growth and stress in fish production. Aquacul-ture, 111: 51-63.
7. Wendelaar Bonga SE (1997). The stress response in fish. Physi-ological Reviews, 77: 591-625.
stress in aquaculture with emphasis on the response and effects of corticosteroids. Annual Review of Fish Diseases, 10: 3-26. 9. Jobling M (1985). Physiological and social constraints on growth of
fish with special reference to Arctic charr (Salvelinus alpinus). Aqua-culture, 44: 83-90.
10. Koebele BP (1985). Growth and the size hierarchy effect: an experi-mental assessment of three proposed mechanisms; activity differ-ences, disproportional food acquisition, physiological stress. Envi-ronmental Biology of Fishes, 12: 181-188.
11. Zayan R (1991). The specificity of social stress. Behavioural Pro-cesses, 25: 91.
12. McDonald DG & Milligan CL (1992). Chemical properties of the blood. In: Hoar WS, Randall DJ & Farrel AP (Editors), Fish Physiolo-gy. Vol. XII. Part B, The Cardiovascular System. Academic Press, San Diego, CA, USA, 55-133.
13. Boeuf G (1993). Salmonid smolting: A pre-adaptation to the oceanic environment. In: Cliff J & Jensen FB (Editors), Fish Ecophysiology. Chapman and Hall, London, UK, 105-135.
14. Peters G, Delventhal H & Klinger H (1980). Physiological and mor-phological effects of social stress in the eel (Anguila anguila L.).
Archiv für Fischereiwissenschaft, 30: 157-180.
15. Kubokawa K, Watanabe T, Yoshioka M & Iwata M (1999). Effects of acute stress on plasma cortisol, sex steroid hormone and glucose levels in male and female sockeye salmon during the breeding season. Aquaculture, 172: 335-349.
16. Vijayan MM, Ballantyne JS & Leatherland JF (1992). Cortisol-in-duced changes in some aspects of the intermediary metabolism of
Salvelinus fontinalis. General and Comparative Endocrinology, 82: 476-486.
17. Sumpter JP (1992). Control of growth of rainbow trout ( Oncorhyn-chus mikiss). Aquaculture, 92: 299-320.
18. Stott GH (1981). What is animal stress and how is it measured?
Journal of Animal Science, 52: 150-153.
19. Auperin B, Baroiller JE, Ricordel MJ, Fostier A & Prunet P (1997). Effect of confinement stress on circulating levels of growth hor-mone and two prolactins in freshwater-adapted tilapia (Oreochromis niloticus). General and Comparative Endocrinology, 108: 35-44. 20. Prism (1999). GraphPad Software Inc. (Version 3.0). San Diego, CA,
USA.
21. SAS (1996). User’s Guide (Release 6.12). SAS Institute Inc., Cary, NC, USA.
22. Domingues CMPM (1990). Efeito do tipo de confronto no metabo-lismo de alevinos de tilápia-do-Nilo (Oreochromis niloticus). Bach-elor thesis, Instituto de Biociências, Universidade Estadual Paulista, Botucatu, SP, Brazil.
23. Leach JL & Taylor MH (1981). The effects of cortisol treatment on carbohydrate and protein metabolism in Fundulus heteroclitus. Gen-eral and Comparative Endocrinology, 42: 76-83.