Adjustment of Cell-Type Composition
Minimizes Systematic Bias in Blood DNA
Methylation Profiles Derived by DNA
Collection Protocols
Yuh Shiwa1,2, Tsuyoshi Hachiya1,2, Ryohei Furukawa2, Hideki Ohmomo2, Kanako Ono2, Hisaaki Kudo3, Jun Hata4,5, Atsushi Hozawa6, Motoki Iwasaki7, Koichi Matsuda8, Naoko Minegishi3, Mamoru Satoh1,2,9,10, Kozo Tanno11, Taiki Yamaji7, Kenji Wakai12, Jiro Hitomi13,14, Yutaka Kiyohara15, Michiaki Kubo16, Hideo Tanaka17, Shoichiro Tsugane7, Masayuki Yamamoto18,19, Kenji Sobue20,21, Atsushi Shimizu2*
1Division of Biobank and Data Management, Iwate Tohoku Medical Megabank Organization, Iwate Medical University Disaster Reconstruction Center, 2-1-1 Nishitokuda, Yahaba-cho, Shiwa-gun, Iwate 028–3694, Japan,2Division of Biomedical Information Analysis, Iwate Tohoku Medical Megabank Organization, Iwate Medical University Disaster Reconstruction Center, 2-1-1 Nishitokuda, Yahaba-cho, Shiwa-gun, Iwate 028– 3694, Japan,3Department of Biobank, Tohoku Medical Megabank Organization, Tohoku University, 2–1 Seiryo-machi, Aoba-ku, Sendai 980–8573, Japan,4Department of Medicine and Clinical Science, Graduate School of Medical Sciences, Kyushu University, Maidashi 3-1-1, Higashi-ku, Fukuoka 812–8582, Japan,
5Center for Cohort Studies, Graduate School of Medical Sciences, Kyushu University, Maidashi 3-1-1, Higashi-ku, Fukuoka 812–8582, Japan,6Preventive Medicine and Epidemiology, Tohoku Medical Megabank Organization, Tohoku University, 2–1 Seiryo-machi, Aoba-ku, Sendai 980–8573, Japan,
7Epidemiology and Prevention Group, Research Center for Cancer Prevention and Screening, National Cancer Center, 5-1-1 Tsukiji, Chuo-ku, Tokyo 104–0045, Japan,8Laboratory of Molecular Medicine, Human Genome Center, Institute of Medical Science, The University of Tokyo, Tokyo, Japan,9Community Medical Supports and Health Record Informatics, Iwate Tohoku Medical Megabank Organization, Iwate Medical University Disaster Reconstruction Center, 2-1-1 Nishitokuda, Yahaba-cho, Shiwa-gun, Iwate 028–3694, Japan,10 Division of Biomedical Information Analysis, Institute for Biomedical Science, Iwate Medical University, 2-1-1 Nishitokuda, Yahaba-cho, Shiwa-gun, Iwate 028–3694, Japan,11Department of Hygiene and Preventive Medicine, Iwate Medical University, 2-1-1 Nishitokuda, Yahaba-cho, Shiwa-gun, Iwate 028– 3694, Japan,12Department of Preventive Medicine, Nagoya University Graduate School of Medicine, 65 Tsurumai-cho, Showa-ku, Nagoya 466–8550, Japan,13Deputy Executive Director, Iwate Tohoku Medical Megabank Organization, Disaster Reconstruction Center, Iwate Medical University, 2-1-1 Nishitokuda, Yahaba-cho, Shiwa-gun, Iwate 028–3694, Japan,14Department of Anatomy, School of Medicine, Iwate Medical University, 2-1-1 Nishitokuda, Yahaba-cho, Shiwa-gun, Iwate 028–3694, Japan,15 Department of Environmental Medicine, Graduate School of Medical Sciences, Kyushu University, Maidashi 3-1-1, Higashi-ku, Fukuoka 812–8582, Japan,16Laboratory for Genotyping Development, Center for Genomic Medicine, RIKEN, Yokohama, Japan,17 Division of Epidemiology and Prevention, Aichi Cancer Center Research Institute, Nagoya, Japan,18 Department of Integrative Genomics, Tohoku Medical Megabank Organization, Tohoku University, 2–1 Seiryo-machi, Aoba-ku, Sendai 980–8573, Japan,19 Department of Medical Biochemistry, Tohoku University Graduate School of Medicine, Seiryo-machi 2–1, Aoba-ku, Sendai 980– 8575, Japan,20Executive Director, Iwate Tohoku Medical Megabank Organization, Disaster Reconstruction Center, Iwate Medical University, 2-1-1 Nishitokuda, Yahaba-cho, Shiwa-gun, Iwate 028–3694, Japan,
21Department of Neuroscience, Institute for Biomedical Science, Iwate Medical University, 2-1-1 Nishitokuda, Yahaba-cho, Shiwa-gun, Iwate 028–3694, Japan
Abstract
Differences in DNA collection protocols may be a potential confounder in epigenome-wide association studies (EWAS) using a large number of blood specimens from multiple
OPEN ACCESS
Citation:Shiwa Y, Hachiya T, Furukawa R, Ohmomo H, Ono K, Kudo H, et al. (2016) Adjustment of Cell-Type Composition Minimizes Systematic Bias in Blood DNA Methylation Profiles Derived by DNA Collection Protocols. PLoS ONE 11(1): e0147519. doi:10.1371/journal.pone.0147519
Editor:Devin C. Koestler, University of Kansas Medical Center, UNITED STATES
Received:May 14, 2015
Accepted:January 5, 2016
Published:January 22, 2016
Copyright:© 2016 Shiwa et al. This is an open access article distributed under the terms of the
Creative Commons Attribution License, which permits unrestricted use, distribution, and reproduction in any medium, provided the original author and source are credited.
Data Availability Statement:All relevant data are within the paper and its Supporting Information files.
biobanks and/or cohorts. Here we show that pre-analytical procedures involved in DNA col-lection can induce systematic bias in the DNA methylation profiles of blood cells that can be adjusted by cell-type composition variables. In Experiment 1, whole blood from 16 volun-teers was collected to examine the effect of a 24 h storage period at 4°C on DNA methyla-tion profiles as measured using the Infinium HumanMethylamethyla-tion450 BeadChip array. Our statistical analysis showed that theP-value distribution of more than 450,000 CpG sites was similar to the theoretical distribution (in quantile-quantile plot,λ= 1.03) when comparing two control replicates, which was remarkably deviated from the theoretical distribution (λ= 1.50) when comparing control and storage conditions. We then considered cell-type compo-sition as a possible cause of the observed bias in DNA methylation profiles and found that the bias associated with the cold storage condition was largely decreased (λadjusted= 1.14) by taking into account a cell-type composition variable. As such, we compared four respec-tive sample collection protocols used in large-scale Japanese biobanks or cohorts as well as two control replicates. Systematic biases in DNA methylation profiles were observed between control and three of four protocols without adjustment of cell-type composition (λ= 1.12–1.45) and no remarkable biases were seen after adjusting for cell-type composition in all four protocols (λadjusted= 1.00–1.17). These results revealed important implications for comparing DNA methylation profiles between blood specimens from different sources and may lead to discovery of disease-associated DNA methylation markers and the develop-ment of DNA methylation profile-based predictive risk models.
Introduction
Recent epigenome-wide association studies (EWAS) have reported that the methylation level of peripheral blood DNA at hundreds of CpG sites is associated with a wide variety of diseases, including rheumatoid arthritis [1], breast cancer [2], cardiovascular diseases [3,4], and skin dis-eases [5], indicating that EWAS may shed light on understanding of the mechanisms of com-plex diseases. Although these studies have led to the successfully discovery of epigenetic markers, several confounding factors related to DNA methylation have been reported. Techni-cal factors—such as batch effects—are a well-known artifact in DNA methylation arrays [6–8]. Biological factors include age, gender, cellular heterogeneity of blood cells, life style, and medi-cation use [9]. Thus, controlling for potential confounders in EWAS is essential to avoid false-positive findings [9].
Large sample sizes are required in EWAS to increase a statistical power. The integration of existing biobanks can offer an adequate number of samples [10]; however, differences in DNA collection protocols among biobanks with respect to anticoagulants, time until centrifugation after blood collection, and the blood fraction used for DNA extraction (whole blood or buffy coat) may be additional potential confounders. Only few studies have examined the effect of the differences in DNA collection protocols on DNA methylation profiles. For instance, a pre-vious study evaluated the effect of an 8 h storage period on the DNA methylation profile of blood cells (n = 4) and reported that the time-dependent variation in DNA methylation profiles was much smaller than that observed between individuals and only 0.6% of CpG sites mea-sured by a microarray were significantly associated with storage conditions [11]; however, the systematic bias in DNA methylation profiles caused by collection procedures has yet to be fully evaluated.
In the present study, we investigated whether pre-analytical procedures involved in DNA collection could induce systematic bias in DNA methylation profiles of blood cells. In Experi-ment 1, we studied about systematic bias caused by a sample storage condition solely. In Exper-iment 2, we investigated whether differences in four DNA collection protocols used in large-scale Japanese biobanks also resulted in systematic biases. Based on these experiments, we found that pre-analytical procedures were sufficient to generate systematic biases in DNA methylation profiles and that these biases can be greatly reduced by adjusting cell-type compo-sition changes.
Materials and Methods
Ethics statement
Ethical approval for the study was obtained from the Ethics Committee of Iwate Medical Uni-versity (Approval ID: HG H25-1). All subjects provided written informed consent to partici-pate in this study and provided samples anonymously.
Experiment 1: Comparison between a cold storage condition and two
control replicates
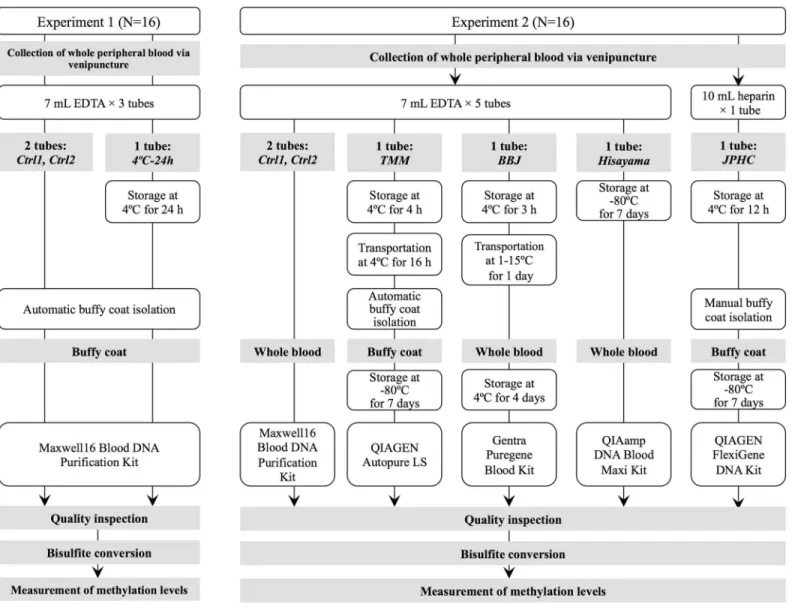
Blood collection and genomic DNA extraction. The workflow is illustrated inFig 1. Peripheral blood from 16 volunteers (10 male and 6 female) was collected in 7-mL EDTA vacu-tainers (Venoject II, VP-NA070K). Three tubes were collected from each volunteer, two of which were immediately processed for the isolation of buffy coats (Ctrl1 and Ctrl2 conditions). The remaining tube was stored at 4°C for 24 h (4°C-24 h condition). The tubes stored at 4°C were maintained for 30 min at room temperature prior processing. To isolate the buffy coat layer, the blood collection tubes were centrifuged at 1,500 ×gfor 10 min at room temperature using a tabletop centrifuge (Kubota Corporation, Tokyo, Japan). The buffy coat layer (700μL)
was applied to four sterile 1.3-mL tubes (FCR & Bio Co. Ltd., Kobe, Japan) automatically by a Freedom Evo100 robot (Tecan Group Ltd., Männedorf, Switzerland). Extraction of genomic DNA was performed immediately after the isolation of buffy coats. Genomic DNA was isolated using the Maxwell116 Blood DNA Purification Kit on a Maxwell116 Instrument according to manufacturer’s instructions. A 3-μL aliquot of extracted DNA was used for quantitative and
qualitative assessment, and the remaining DNA was stored at−80°C until further use. The yield of genomic DNA was measured using the Qubit 2.0 Fluorometer (Life Technologies, Carlsbad, CA, USA) with the Qubit dsDNA BR Assay Kit. The purity of genomic DNA was assessed by the ratio of absorbance at 260 nm and 280 nm (OD260/OD280) using a Nanodrop
2000 UV-Vis Spectrophotometer (Thermo Fisher Scientific, Waltham, MA, USA). Genomic DNA integrity was evaluated by Genomic DNA ScreenTape on an Agilent 2200 TapeStation (Agilent Technologies, Santa Clara, CA, USA). All of the above procedures were performed according to manufacturer’s instructions.
Flow cytometry. Peripheral blood from additional 6 volunteers (1 female and 5 male) was collected and processed to isolate the buffy coats (Ctrl1, Ctrl2, and 4°C-24 h condition) as described above. The buffy coat (50μL) was stained with 5μL of PE/Cy7-CD3, APC-CD4,
backscattered light (BSC-A); monocyte gating was based on positive CD14 expression and low BSC-A; and granulocyte gating was based on negative CD14 expression and broad BSC-A. The proportion of each subset was calculated for all events.
Experiment 2: Comparison between four respective DNA collection
protocols and two control replicates
Blood collection. The workflow is illustrated inFig 1. We recapitulated four DNA collec-tion protocols used in major biobanks and cohorts in Japan (TMM; Tohoku Medical Mega-bank Organization, BBJ; BioBank Japan, JPHC; Japan Public Health Center-based Prospective Study, and Hisayama; Hisayama cohort Study). We adopted the maximum duration to process the blood samples because the permissible elapsed time to process the samples differs in each protocol (S1 Table). J-MICC (Japan Multi-Institutional Collaborative Cohort Study) protocols differ with regard to the maximum time to process blood samples. Since the maximum pro-cessing time did not exceed 24 h in any of the J-MICC propro-cessing sites, we considered it
Fig 1. Workflow of the study design in two experiments.
suitable to substitute J-MICC protocols by the TMM protocol and exclude the former from further consideration. Since BBJ outsourced DNA extraction to three different external nies depending on the project period, we adopted the protocol used by one of the three compa-nies. Peripheral blood samples were collected in 5 7-mL EDTA vacutainers (Venoject II, VP-NA070K, Terumo, Tokyo, Japan) and 1 10-mL heparin sodium vacutainer (Venoject II, VP-H100K, Terumo, Tokyo, Japan) from each of the 16 healthy volunteers (12 male and 4 female). Genomic DNA samples were immediately extracted from 2 of the 5 EDTA tubes (Ctrl1 and Ctrl2 protocols as the ideal conditions), and one was stored at 4°C for 4 h, followed by transportation to Tohoku University Tohoku Medical Megabank Organization at 4°C for 16 h. Next, the tubes were centrifuged, the buffy coat isolated by an automatic robot (Tecan Group, Grodig, Austria), and genomic DNA extracted (TMM protocol). Another of the ETDA tubes was stored at 4°C for 3 h and transported to BML Inc. at 1–15°C for 1 day. After that, the blood collection tube was stored at 4°C for 4 days, following the BBJ protocol of genomic DNA extraction from whole blood (BBJ protocol). The remaining EDTA tube was stored at−80°C for 7 days, and genomic DNA was extracted from whole blood (Hisayama protocol). Buffy coat was isolated from 1 heparin tube after storing the blood collection tube at 4°C for 12 h, and genomic DNA was extracted from the buffy coat (JPHC protocol).
Genomic DNA extraction. Fig 1andTable 1show the DNA extraction protocols of each biobank. For both control protocols (Ctrl1 and Ctrl2), genomic DNA was extracted from whole blood using a Maxwell16 Blood DNA Purification Kit on Maxwell16 Instrument (Pro-mega Inc., Madison, WI, USA) according to the manufacturer’s instructions. According to the TMM protocol, the buffy coat was obtained from whole blood by centrifugation of blood col-lection tubes at 2,300 ×gfor 10 min at 4°C followed by automatic pipetting by a Freedom Evo robot (Tecan Group). After the buffy coat samples were stored at−80°C for 7 days, genomic DNA was automatically extracted by Autopure LS (Qiagen, Hilden, Germany). As per the BBJ protocol, genomic DNA was extracted from whole blood with the Gentra Puregene Blood Kit (Qiagen). According to the Hisayama protocol, frozen whole-blood samples were thawed at 37°C, followed by genomic DNA extraction using the QIAamp DNA Blood Maxi Kit (Qiagen). In the JPHC protocol, the buffy coat was manually obtained from centrifuged blood samples at 2,300 ×gfor 10 min at room temperature and stored at−80°C for 7 days. The genomic DNA was extracted using the FlexiGene DNA Kit (Qiagen) and was purified using Genomic DNA Clean & Concentrator-10 (Zymo Research Corporation, Orange, CA, USA). DNA quality was evaluated as described in Experiment 1.
DNA methylation profiling using Illumina bead arrays
The Infinium HumanMethylation450 (HM450) BeadChip is an allele specific assay with more than 485,000 loci per sample, and each chip (or array) can accommodate 12 samples in a 6-row by 2-column arrangement of wells. The HM450 array has been shown to be a major source of technical biases in DNA methylation profile [6–8,12–16]. To reduce the technical bias of this array, samples derived from the same individual were loaded on the same chip (thus 4 individ-uals on one chip for Experiment 1, 2 individindivid-uals on one chip for Experiment 2) as displayed in S1 Fig. In Experiment 1, 48 samples (16 individuals × 3 conditions) were allocated to 4 chips as shown inS1A Figand processed in two separate batches (S2 Table). In Experiment 2, 96 sam-ples (16 individuals × 6 conditions) were allocated to 8 chips as shown inS1B Figand pro-cessed in one batch (S3 Table). DNA (500 ng) was bisulfite converted with the EZ DNA methylation kit (Zymo Research Corporation) according to manufacturer’s instructions and eluted in 12μL of elution buffer. DNA methylation profiles were measured using the Infinium
bisulfite-converted DNA (4μL) was denatured, neutralized, and isothermally amplified in an Illumina
hybridization oven (20–24 h). The amplified products were fragmented by an enzymatic pro-cess. After an isopropanol precipitation, the precipitated DNA was resuspended in hybridiza-tion buffer. The resuspended DNA samples were dispensed onto HM450 BeadChips (12 samples/chip). The DNA-loaded BeadChips were incubated at 48°C for 16–20 h using the Illu-mina hybridization oven. After this step, unhybridized DNA was washed away, and the chips were stained and subjected to single-base extension. Finally, the BeadChips were scanned using the Illumina iScan. Initial quality control was performed using Illumina GenomeStudio soft-ware (V2011.1).
Data processing
Throughout this study, we evaluated methylation level on the basis of theβ-value, which is defined as the ratio of methylated probe intensity to total signal intensity [16]. Raw intensity data (IDAT) files were imported into the R environment (v.3.1.2) using the Bioconductor minfi package (v 1.12.0) [17]. Background level correction and quantile normalization were performed using CPACOR pipeline [18]. The quality control of methylation probe was assessed by the detectionP-value, which represents the confidence that a given probe intensity is distinguishable from a background noise [16]. We adopted a stringent detectionPthreshold ofP<10−16in order to prevent spurious results as recommended in [18]. Only probes that
passed the detectionP-value threshold and on autosomal chromosomes were retained for fur-ther analyses. These procedures were applied to data from each of two experiments separately. A principal component analysis (PCA) and unsupervised hierarchical clustering was per-formed with the function prccomp and hclust in R, respectively.
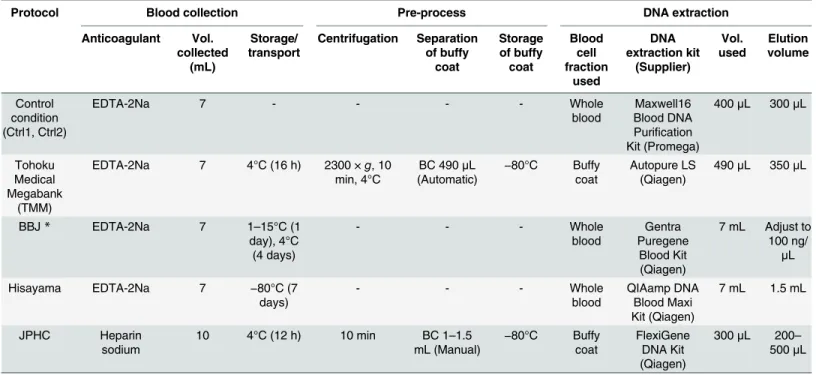
Table 1. DNA collection protocols used in Experiment 2.
Protocol Blood collection Pre-process DNA extraction
Anticoagulant Vol. collected (mL) Storage/ transport Centrifugation Separation of buffy coat Storage of buffy coat Blood cell fraction used DNA extraction kit (Supplier) Vol. used Elution volume Control condition (Ctrl1, Ctrl2)
EDTA-2Na 7 - - - - Whole
blood
Maxwell16 Blood DNA Purification Kit (Promega)
400μL 300μL
Tohoku Medical Megabank
(TMM)
EDTA-2Na 7 4°C (16 h) 2300 ×g, 10 min, 4°C
BC 490μL (Automatic)
−80°C Buffy coat
Autopure LS (Qiagen)
490μL 350μL
BBJ* EDTA-2Na 7 1–15°C (1
day), 4°C (4 days)
- - - Whole
blood
Gentra Puregene
Blood Kit (Qiagen)
7 mL Adjust to 100 ng/
μL
Hisayama EDTA-2Na 7 −80°C (7
days)
- - - Whole
blood
QIAamp DNA Blood Maxi Kit (Qiagen)
7 mL 1.5 mL
JPHC Heparin
sodium
10 4°C (12 h) 10 min BC 1–1.5 mL (Manual) −
80°C Buffy coat
FlexiGene DNA Kit (Qiagen)
300μL 200– 500μL
*DNA extraction outsourced to an external company.
Estimation of cell-type compositions from DNA methylation profiles
To estimate cell-type compositions from DNA methylation profiles, we used the algorithm designed by Houseman et al. [19] implemented as estimateCellCounts function [20] in the minfi package with a slight modification for the compatibility with the CPACOR pipeline. DNA methylation signatures on sorted human blood cells measured by the HM450 arrays were used as a reference data set [21]. Raw intensity data files of the reference data set were pro-cessed and normalized together with those of each experiment.
Linear regression models to test bias without adjustment of cell-type
composition
We tested systematic bias between an ideal (Ctrl1) and other conditions based on linear regres-sion analysis. In the linear regresregres-sion models, principal components (PCs) of signal intensities of the control probes were included in equation terms as described in [18] to remove technical bias arising from HM450 array. To account for biological variation, we compared DNA meth-ylation profiles and cell-type composition between conditions within the same individual. Let
ΔYijbe the difference in theβ-values of an individualjat a CpG siteibetween a condition in interest and an ideal condition (Ctrl1),Dbi0mean difference between conditions,DX
j
PCðkÞ
differ-ence ink-th PCs of control probes between conditions for individualj,biPCðkÞregression coeffi -cients forDXPCj ðkÞ, andεijis a residual parameter normally distributed around zero. Then, we solved the following regression model:
DYij¼Db
i
0þ X
kb i
PCðkÞDX j
PCðkÞþεij: ð1Þ
In this model,Dbi
0 ¼0indicates there is no difference inβ-values between conditions, whereasDbi06¼0indicates some measure of difference. Accordingly, we tested whetherDb
i
0¼0 to obtain aP-value for each CpG site. TheP-value distribution of more than 450,000 CpG sites was compared to the theoretical distribution using a quantile-quantile (QQ) plot and the geno-mic inflation factor lambda. The genomic inflation factor lambda was calculated by dividing the median of observed chi-square statistics by the median of theoretical chi-square statistics with 1 degree of freedom [22], which quantifies the systematic bias of test statistic. In our analysis, P-values from linear regression were converted to chi-square statistics by the“qchisq”function in R.
Linear regression models to test bias with adjustment of cell-type
composition
To examine whether the bias in DNA methylation profiles can be corrected by adjusting cell-type composition, we added a cell-cell-type composition variable, namely a proportion of granulo-cytes estimated from DNA methylation profiles (see“Estimation of cell-type compositions from DNA methylation profiles”, for detail), to (Eq 1) as shown in the following equation:
DYij ¼ Dbi
0þ X
kb i
PCðkÞDX j PCðkÞþb
i
GranDX j
Granþεij: ð2Þ
whereDXGranj represents difference in proportions of granulocytes between conditions and
biGranis a regression coefficient forDXjGran. Then, we tested whetherDb i
Results
Experiment 1: Comparison between a cold storage condition and two
control replicates
In the first experiment, three 7 mL tubes of EDTA whole-blood samples were collected from 16 subjects (Fig 1). Two of the three tubes were immediately processed to the automatic isolation of buffy coats and DNA (Ctrl1 and Ctrl2 conditions) as duplicate controls. The remaining one tube was stored at 4°C for 24 h followed by the isolation of buffy coats and DNA (4°C-24 h con-dition). After DNA extraction, the yield and quality of genomic DNA were compared among the conditions. No significant difference in the yield or quality of extracted DNA was detected between conditions (S4 Table).
We measured 48 genome-wide DNA methylation profiles (16 individuals × 3 conditions) using the Illumina Infinium HumanMethylation450 array (HM450 array) in two separate batches (S2 Table). Over 470,800 good probes (99.35%) were detected in all samples (no sam-ples were excluded), indicating that HM450 assays were performed with sufficiently high qual-ity (S4 Table). To evaluate technical biases of HM450 array data, we performed an initial quality control. A similar methylation level distribution across chips (β-values) was observed (S2 Fig). A principal component analysis (PCA) showed that the samples on one chip from another batch tended to separate from other samples, indicating a non-negligible batch effect (S3A Fig). Unsupervised hierarchical clustering showed that variation of DNA methylation profiles between conditions was smaller than that between individuals (S3B Fig).
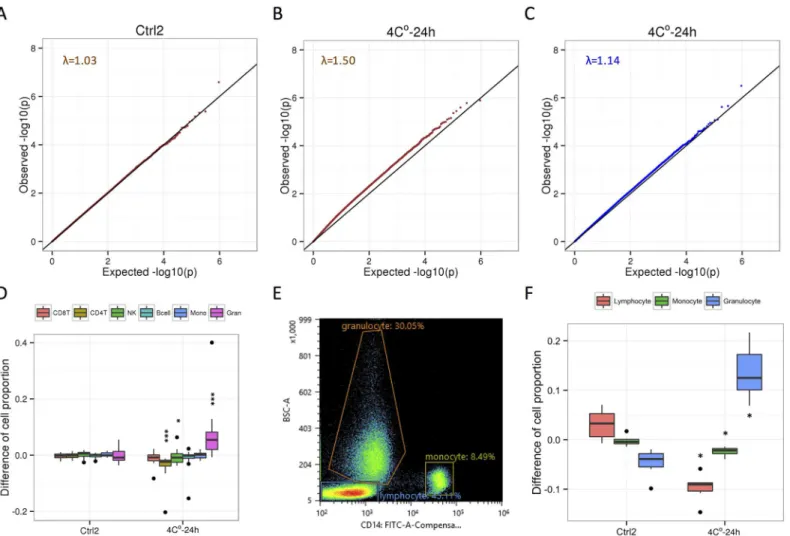
To investigate whether the 4°C-24 h condition causes biases on DNA methylation profile, we used linear regression to compare pairedβ-values from the 16 individuals. To reduce tech-nical biases in HM450 array data, we applied the recently developed correction method [18], which uses principal components (PCs) of signal intensities for the HM450 array control probes (SeeMaterial and Methods). When we compared DNA methylation profiles between duplicates (Ctrl1 vs. Ctrl2) with adjustment for first 3 PCs of control probes, theP-value distri-bution of more than 450,000 CpG sites was similar to the theoretical distridistri-bution (λ= 1.03,Fig 2AandS4 Fig), indicating effectiveness of technical biases reduction of this method. When we compared DNA methylation profiles between Ctrl1 and 4°C-24 h conditions, theP-value dis-tribution remarkably deviated from the theoretical disdis-tribution (λ= 1.50,Fig 2B), indicating that there was the bias caused by a cold storage.
Since whole blood is a heterogeneous collection of different cell-types, we hypothesized that the 4°C-24 h condition changes the cell-type composition of blood cells. We estimated the cell-type composition from DNA methylation profiles [19], and calculated the change of cell proportion between duplicates conditions and between Ctrl1 and 4°C-24 h conditions within the same individual (Fig 2D). No statistical difference of estimated cell-type composi-tion between duplicates condicomposi-tions (P>0.05) was observed. In the 4°C-24 h condition
com-pared with a control condition, the cell proportions of CD4T and NK were significantly decreased (P= 3.05 × 10⁻⁵for CD4T;P= 2.90 ×10⁻²for NK) and the proportion of
granulo-cytes was significantly increased (P= 3.05 × 10⁻⁵). This observation is consistent with findings
To investigate whether the change in cell-type composition could correct the systematic bias in the methylation profiles, a variable indicating the change in cell-type composition of granulo-cytes was added to our linear regression model as an additional covariate. As the result we found that the bias associated with the 4°C-24 h condition was largely decreased (λ= 1.14,Fig 2C). To validate our model, we randomly assign the labels of covariates using a linear regression model (S5 Fig). This could not decrease the DNA methylation biases, indicating that linear regression analysis of our models could reduce the biases caused by the 4°C-24 h condition.
Differences in DNA collection protocols among large-scale Japanese
biobanks and cohorts
To investigate whether differences in DNA collection protocols cause systematic biases on DNA methylation profile, first we surveyed DNA collection protocols among large-scale
Fig 2. Correction of systematic biases in DNA methylation profile caused by cold storage using cell-type composition. A. Quantile-quantile (QQ) plot for the comparison of pairedβ-values from the 16 individuals between duplicates (Ctrl1 vs. Ctrl2). The genomic inflation factor lambda (medianP-value of obs/exp) is shown.B. QQ plot for the comparison of 16 individuals between Ctrl1 and 4°C-24 h conditions.C. QQ plot for the comparison of 16 individuals between Ctrl1 and 4°C-24 h conditions after adjustment for the change in the estimated proportion of granulocytes.D. Differences of cell proportion between conditions (Ctrl2: Ctrl1 vs. Ctrl2; 4°C-24 h: Ctrl1 vs. 4°C-24 h) within the same individual are estimated by the cell-type composition from DNA methylation profiles. CD8T, CD8+ T cells; CD4T, CD4+ T cells; NK, natural killer cells; Bcell, B cells; Mono, monocytes; Gran, granulocytes.*,P<0.05;**,P<0.01;
***,P<0.001 (Wilcoxon sighed rank test compared with Ctrl1)E. Gating strategy used to analyze populations of lymphocytes, monocytes, and granulocytes.F. Differences of cell proportion between conditions (Ctrl2: Ctrl1 vs. Ctrl2; 4°C-24 h: Ctrl1 vs. 4°C-24 h) within the same individual are measured by FACS using samples derived another 6 individuals.*,P<0.05 (Wilcoxon signed-rank test compared with Ctrl1).
biobanks and cohorts in Japan (S1 Table). There are 3 major respects charactering the differ-ences between the protocols, listed inS1 Table, i.e., anticoagulants (EDTA or heparin), time until centrifugation after blood collection, and the blood fraction used for DNA extraction (whole blood or buffy coat). All the biobanks and cohorts, except for JPHC, adopt an EDTA anticoagulant, whereas JPHC uses sodium heparin anticoagulant. For most biobanks, whole-blood samples are transported at a low temperature (e.g., 4°C) from collection sites to a central laboratory and are processed within 24 h. The Hisayama cohort freezes blood collection tubes
at−80°C immediately after sampling.
The time from blood collection to processing and storage temperature during transporta-tion as well as the DNA extractransporta-tion method are varied between the biobanks and cohort studies (S1 Table). For example, genomic DNA is extracted from the buffy coat in the TMM protocol, while in the BBJ and Hisayama protocols, genomic DNA is extracted from whole blood. Although extraction of DNA from the buffy coat needs an additional centrifugation step, it offers not only high yields of DNA, but also other fractions such as plasma and red blood cells for future use, compared with that from whole blood. Based on protocol differences described above, we chose four DNA collection protocols (TMM, BBJ, Hisayama, and JPHC) that utilize two anticoagulants (EDTA and heparin) and different blood fractions for DNA extraction (whole blood or buffy coat).
Experiment 2: Comparison between four DNA collection protocols and
two control replicates
In Experiment 2, we employed four DNA collection protocols (TMM, BBJ, Hisayama, and JPHC) and an immediate extraction protocol (Ctrl1 and Ctrl2) as duplicate controls (Fig 1and Table 1). After DNA extraction, the yield and quality of genomic DNA were compared among protocols (S5 Table). The mean DNA concentration derived from buffy coat DNA (TMM and JPHC) was higher than that derived from whole blood (Ctrl1, Ctrl2, BBJ, and Hisayama; P= 3.73 × 10⁻¹¹). DNA quality was evaluated based on OD
260/280. All DNA obtained from
each condition yielded an OD260/280of 1.8–2.0, indicating high-quality, intact DNA.
Further-more, the results of gel electrophoresis indicated that the DNA samples were of good quality and none of them had degraded (data not shown).
We measured 96 genome-wide DNA methylation profiles (16 individuals × 6 conditions) using the HM450 array in one batch (S3 Table) and evaluated the suitability of these DNA preparations for HM 450 array analysis. Over 472,351 good probes (99.68%) were detected in all samples (no samples were excluded), indicating that all DNA collection protocols evalu-ated in this study retained sufficient genomic DNA quality for DNA methylation profiles (S5 Table). Similarβ-values were observed across chips (S6 Fig). PCA showed that the samples on one chip tended to separate from other samples (S7 Fig). Unsupervised hierarchical clustering showed that variation of DNA methylation profiles between conditions was smaller than that between individuals (S8 Fig). Two samples (CY5 and DC5) processed by JPHC protocol were not included in each individual cluster, possibly due to manual isolation of buff coats, which may lead to a large variation of cell-type compositions. Estimated cell-compositions were sig-nificantly different between a control condition and TMM, Hisayama and BBJ protocols (Fig 3A). For the JPHC protocol, the difference was not significant, whereas the estimated cell-com-positions had large variations, possibly due to the manual isolation in the protocol.
CpG sites is similar to the theoretical distribution (λ= 1.08Fig 3BandS4 Fig). When we com-pared DNA methylation profiles between Ctrl1 and each protocol, theP-value distribution was remarkably deviated from the theoretical distribution in the BBJ protocol (λ= 1.45;Fig 3D). For the Hisayama protocol,λwas slightly inflated (λ= 1.17;Fig 3E). TheP-value distribution in the TMM protocol was similar to the theoretical distribution (λ= 1.12,Fig 3C). For the JPHC protocol,λ= 0.81, implying that large variations of cell-type composition may decrease the power of tests (Fig 3F). In Hisayama protocols, and remarkably deviated from the theoreti-cal distribution in BBJ, indicating systematic biases in DNA methylation profiles between con-trol and the three protocols.
After the adjustment by a cell-type composition variable indicating the difference of granu-locyte proportions, theP-value distributions of the four protocols were similar to the theoreti-cal distribution (λadjustedranged from 1.00 to 1.17;Fig 3), whereas theP-value distributions were not similar in permutation tests (S9 Fig). For the BBJ and Hisayama protocols, wherein
Fig 3. Systematic biases in DNA methylation profile caused by difference of DNA collection protocols. A. Differences of cell proportion between conditions (Ctrl1 vs. Ctrl2, TMM, BBJ, Hisayama, and JPHC) within the same individual are estimated by the cell-type composition from DNA methylation profiles. CD8T, CD8+ T cells; CD4T, CD4+ T cells; NK, natural killer cells; Bcell, B cells; Mono, monocytes; Gran, granulocytes.*,P<0.05;**,P<0.01;
***,P<0.001 (Wilcoxon sighed rank test compared with Ctrl1).B-F. QQ plots for the comparison of 16 individuals between conditions (Ctrl1 vs. Ctrl2, TMM, BBJ, Hisayama, and JPHC) before (brown points) and after adjustment for the change in the estimated proportion of granulocytes (blue points). The genomic inflation factor lambda (medianP-value of obs/exp) is shown.
the systematic bias was the largest and the second largest, respectively, the bias was substan-tially decreased. For the TMM protocol,λdid not decrease because the bias was not evident before the adjustment. Interestingly, theλwas close to 1.0 after the adjustment for the JPHC protocol (Fig 3F), indicating that the power of tests may be improved by the adjustment of the cell-type compositions when the manual isolation is included in sample collection protocols.
Discussion
To our knowledge, this is the first finding that differences in DNA collection protocols cause systematic bias in DNA methylation profiles. Hebels et al. [11] reported that condition-depen-dent variation in DNA methylation profiles was much smaller than that observed between individuals, which is consistent with our experimental data (S3B Fig). This result indicated that a careful analytical method would be necessary to compare DNA methylation profiles derived from the same individuals with varying conditions and address the systematic bias caused by these differences. For that purpose, we made use of the quantile-quantile plot, which compares observed and theoreticalPvalue distributions and is suited for the detection of systematic bias. This methodology revealed that pre-analytical procedures were sufficient to induce systematic bias in DNA methylation profiles.
Through these experiments, we showed that changes of cell-type composition due to pre-analytical procedures are a major source of bias. The cause of the change of cell-type composi-tions is different due to blood cell fraction used for DNA extraction. For buffy coat, previous studies demonstrated that buffy coat separated after overnight storage of whole blood at 4°C was contaminated with a large number of granulocytes due to the change of the specific density of granulocytes [23,24]. For DNA derived from whole-blood, previous study showed that the number of lymphocytes (CD4T and CD8T) was found to decrease after frozen storage of whole blood at−80°C [25]. It is possible that by BBJ and Hisayama protocols, decreasing lym-phocyte cells due to storage causes an apparent increase in the granulocyte proportion (Fig 3A). Although the adjustment of cell-type composition has been used in previous EWAS [1,20,26,27], this is the first report showing that the bias in DNA methylation profiles intrinsic to DNA collection protocols can be corrected by adjustment of cell-type composition variables.
While we showed that the adjustment of cell-type composition variables could be corrected confounding by DNA collection protocols, other sources of confounding factors must be con-sidered. Batch effects are major technical confounders related to array experimental factors such as experimental day and chip position [7]. To avoid the batch effects across chips, samples derived from the same individual were loaded on the same chip as displayed inS1 Fig. Since each condition was assigned to the specific row position of chip, there is a concern of con-founding between chip position and conditions. When we compared DNA methylation pro-files between control duplicates in two experiments, we observed theP-value distribution slightly deviated from the theoretical distribution (λ= 1.28,S4 Fig), indicating that there was the technical bias caused by chip position. To address these issues, we employed recently devel-oped CPACOR pipeline, which uses principal components (PCs) of signal intensities of the control probes for statistical adjustments [18]. This method successfully removed technical bias between duplicate conditions (S4 Fig). Although we cannot completely exclude the possi-bility of confounding between chip position and conditions, it is worth noting that our statisti-cal adjustment models could reduce the bias in DNA methylation profiles intrinsic to DNA collection protocols using cell-type composition variables.
profiles between blood specimens from different sources and will lead to discovery of DNA methylation markers associated with diseases as well as to the development of DNA methyla-tion profile-based predictive risk models.
Supporting Information
S1 Fig. Chip layout in Experiment 1 (A) and Experiment 2 (B). A. Three conditions (Ctrl1, Ctrl2, and 4°C-24 h) are assigned to the specific row positions.B. Six conditions (Ctrl1, Ctrl2, TMM protocol, BBJ protocol, JPHC protocol, and Hisayama protocol) are assigned to the spe-cific row position. Samples derived from the same individual are assigned to the same column (C01 or C02), and highlighted by the same color.
(PDF)
S2 Fig. DNA methylation for 48 samples presented as boxplots in Experiment 1.Box plot of normalized beta values for four chips of 48 samples. Each color represents a distinct chip. One chip (purple) is the different batch.
(PDF)
S3 Fig. Relationship of samples based on DNA methylation profiles in Experiment 1. A. PCA plot for 48 samples. Each color represents a distinct chip. One chip (purple) is the differ-ent batch.B. Unsupervised hierarchical clustering for 48 samples. Samples from the same indi-vidual (A-P) are labeled with the initial letter. Duplicates (Ctrl1 and Ctrl2) and 4°C-24 h conditions from individual are labeled with 1, 2, and 4, respectively. Red bars indicate samples derived from the same individual are clustered together.
(PDF)
S4 Fig. Correction of technical biases between duplicates using control probes in two exper-iments.Lehne et al. developed a new method to correct for technical biases in the HM450 array data using PCs (PC1-3) of intensities of control probes [18]. In two experiments (Ex1: Experiment 1; and Ex2: Experiment 2), we compared QQ plots for the comparison of 16 indi-viduals between duplicates (Ctrl1 vs. Ctrl2) with no adjustments, first 1 PC (PC1), two PCs (PC1-2), and three PCs (PC1-3) of control probes.
(PDF)
S5 Fig. QQ plot adjustment for shuffled covariates in Experiment 1.QQ plot for the com-parison of 16 individuals between Ctrl1 and 4°C-24 h conditions after adjustment for the value of shuffled covariates (brown points: PCs of control probes as covariates; blue points: addi-tional covariates of the change in the estimated proportion of granulocytes).
(PDF)
S6 Fig. DNA methylation for 96 samples presented as boxplots in Experiment 2.Box plot of normalized beta values for eight chips of 96 samples. Each color represents a distinct chip. All chips are the same batch.
(PDF)
S7 Fig. PCA plot for 96 samples in Experiment 2.Each color represents a distinct chip. Although all chips are the same batch, the samples on one chip (orange) tended to separate from other samples.
(PDF)
derived from the same individual are clustered together. Blue bar indicates samples are clus-tered separately from each individual cluster.
(PDF)
S9 Fig. QQ plots adjustment for shuffled values in Experiment 2.QQ plot for the compari-son of 16 samples between conditions (Ctrl1 vs. Ctrl2, TMM, BBJ, Hisayama, and JPHC) after adjustment for the shuffled value of three PCs (PC1-3) of control probes (brown points) and in addition to the change of cell proportion of granulocytes (blue points).
(PDF)
S1 Table. DNA collection protocols among major cohorts and biobanks in Japan.
(XLSX)
S2 Table. Sample allocation of HM450 array in Experiment 1.
(XLSX)
S3 Table. Sample allocation of HM450 array in Experiment 2.
(XLSX)
S4 Table. Purity and quantity of DNA and quality of beads arrays in Experiment 1.
(XLSX)
S5 Table. Purity and quantity of DNA and quality of beads arrays in Experiment 2.
(XLSX)
Acknowledgments
This work was supported by the Tohoku Medical Megabank Project (Special Account for reconstruction from the Great East Japan Earthquake) from the Ministry of Education, Cul-ture, Sports, Science and Technology (MEXT) and Japan Agency for Medical Research and Development (AMED). The authors thank the members of Iwate Tohoku Medical Megabank Organization of Iwate Medical University (IMM) for their encouragement and support. We thank Dr. Taira Mayanagi, Department of Neuroscience, Institute for Biomedical Sciences, Iwate Medical University, for sample management. We are deeply grateful to Ms. Kumi Furu-sawa and Ms. Naoe Suzuki for their assistance. We also thank Ms. Fumiko Okano, Ms. Atsuko Sugawara, Ms. Haruna Kadoguchi, Ms. Shuko Chiba, and Ms. Mugiho Segawa, genome medi-cal research coordinators of IMM, for their help with blood sample collection, as well as the voluntary contributions of all participants.
Author Contributions
Conceived and designed the experiments: YS TH JHI KS AS. Performed the experiments: YS RF HO KO HK. Analyzed the data: YS TH. Contributed reagents/materials/analysis tools: TH HK JHA AH MI KM NM MS KT TY KW. Wrote the paper: YS TH RF HO KO AS. Contrib-uted to critical review of the manuscript: TH HK JHA AH MI KM NM MS KT TY KW JHI YK MK HT ST MY KS. Prepared the final manuscript: YS AS.
References
1. Liu Y, Aryee MJ, Padyukov L, Fallin MD, Hesselberg E, Runarsson A, et al. Epigenome-wide associa-tion data implicate DNA methylaassocia-tion as an intermediary of genetic risk in rheumatoid arthritis. Nat Bio-technol. 2013; 31: 142–7. doi:10.1038/nbt.2487PMID:23334450
3. Sun C, Burgner DP, Ponsonby A-L, Saffery R, Huang R-C, Vuillermin PJ, et al. Effects of early-life envi-ronment and epigenetics on cardiovascular disease risk in children: highlighting the role of twin studies. Pediatr Res. 2013; 73: 523–30. doi:10.1038/pr.2013.6PMID:23314296
4. Irvin MR, Zhi D, Joehanes R, Mendelson M, Aslibekyan S, Claas SA, et al. Epigenome-wide associa-tion study of fasting blood lipids in the genetics of lipid lowering drugs and diet network study. Circula-tion. 2014; doi:10.1161/CIRCULATIONAHA.114.009158
5. Seow WJ, Kile ML, Baccarelli AA, Pan W-C, Byun H-M, Mostofa G, et al. Epigenome-wide DNA methyl-ation changes with development of arsenic-induced skin lesions in Bangladesh: A case-control follow-up study. Environ Mol Mutagen. 2014; 55: 449–56. doi:10.1002/em.21860PMID:24677489
6. Sun Z, Chai HS, Wu Y, White WM, Donkena K V, Klein CJ, et al. Batch effect correction for genome-wide methylation data with Illumina Infinium platform. BMC Med Genomics. 2011; 4: 84. doi:10.1186/ 1755-8794-4-84PMID:22171553
7. Buhule OD, Minster RL, Hawley NL, Medvedovic M, Sun G, Viali S, et al. Stratified randomization con-trols better for batch effects in 450K methylation analysis: a cautionary tale. Front Genet. 2014; 5: 354. doi:10.3389/fgene.2014.00354PMID:25352862
8. Harper KN, Peters BA, Gamble M V. Batch effects and pathway analysis: two potential perils in cancer studies involving DNA methylation array analysis. Cancer Epidemiol Biomarkers Prev. 2013; 22: 1052– 60. doi:10.1158/1055-9965.EPI-13-0114PMID:23629520
9. Chen W, Gao G, Nerella S, Hultman CM, Magnusson PKE, Sullivan PF, et al. MethylPCA: a toolkit to control for confounders in methylome-wide association studies. BMC Bioinformatics. 2013; 14: 74. doi: 10.1186/1471-2105-14-74PMID:23452721
10. Watson RWG, Kay EW, Smith D. Integrating biobanks: addressing the practical and ethical issues to deliver a valuable tool for cancer research. Nat Rev Cancer. 2010; 10: 646–51. doi:10.1038/nrc2913 PMID:20703251
11. Hebels DGAJ, Georgiadis P, Keun HC, Athersuch TJ, Vineis P, Vermeulen R, et al. Performance in omics analyses of blood samples in long-term storage: opportunities for the exploitation of existing bio-banks in environmental health research. Environ Health Perspect. 2013; 121: 480–7. doi:10.1289/ehp. 1205657PMID:23384616
12. Wang D, Yan L, Hu Q, Sucheston LE, Higgins MJ, Ambrosone CB, et al. IMA: an R package for high-throughput analysis of Illumina’s 450K Infinium methylation data. Bioinformatics. 2012; 28: 729–30. doi: 10.1093/bioinformatics/bts013PMID:22253290
13. Morris TJ, Butcher LM, Feber A, Teschendorff AE, Chakravarthy AR, Wojdacz TK, et al. ChAMP: 450k Chip Analysis Methylation Pipeline. Bioinformatics. 2014; 30: 428–30. doi:10.1093/bioinformatics/ btt684PMID:24336642
14. Wang T, Guan W, Lin J, Boutaoui N, Canino G, Luo J, et al. A systematic study of normalization meth-ods for Infinium 450K methylation data using whole-genome bisulfite sequencing data. Epigenetics. 2015; 10: 662–9. doi:10.1080/15592294.2015.1057384PMID:26036609
15. Maksimovic J, Gordon L, Oshlack A. SWAN: Subset-quantile within array normalization for illumina infi-nium HumanMethylation450 BeadChips. Genome Biol. 2012; 13: R44. doi:10.1186/gb-2012-13-6-r44 PMID:22703947
16. Kuan PF, Wang S, Zhou X, Chu H. A statistical framework for Illumina DNA methylation arrays. Bioin-formatics. 2010; 26: 2849–55. doi:10.1093/bioinformatics/btq553PMID:20880956
17. Aryee MJ, Jaffe AE, Corrada-Bravo H, Ladd-Acosta C, Feinberg AP, Hansen KD, et al. Minfi: a flexible and comprehensive Bioconductor package for the analysis of Infinium DNA methylation microarrays. Bioinformatics. 2014; 30: 1363–9. doi:10.1093/bioinformatics/btu049PMID:24478339
18. Lehne B, Drong AW, Loh M, Zhang W, Scott WR, Tan S-T, et al. A coherent approach for analysis of the Illumina HumanMethylation450 BeadChip improves data quality and performance in epigenome-wide association studies. Genome Biol. 2015; 16: 37. doi:10.1186/s13059-015-0600-xPMID: 25853392
19. Houseman EA, Accomando WP, Koestler DC, Christensen BC, Marsit CJ, Nelson HH, et al. DNA meth-ylation arrays as surrogate measures of cell mixture distribution. BMC Bioinformatics. 2012; 13: 86. doi: 10.1186/1471-2105-13-86PMID:22568884
20. Jaffe AE, Irizarry RA. Accounting for cellular heterogeneity is critical in epigenome-wide association studies. Genome Biol. 2014; 15: R31. doi:10.1186/gb-2014-15-2-r31PMID:24495553
21. Reinius LE, Acevedo N, Joerink M, Pershagen G, Dahlén S-E, Greco D, et al. Differential DNA methyla-tion in purified human blood cells: implicamethyla-tions for cell lineage and studies on disease susceptibility. PLoS One. 2012; 7: e41361. doi:10.1371/journal.pone.0041361PMID:22848472
23. Van Lambalgen R, Van Meurs GJ. Lymphocyte subpopulations do not alter during blood storage at 4 degrees C. J Immunol Methods. 1985; 80: 39–43. PMID:3159799
24. Nicholson JK, Jones BM, Cross GD, McDougal JS. Comparison of T and B cell analyses on fresh and aged blood. J Immunol Methods. 1984; 73: 29–40. PMID:6333461
25. Fiebig EW, Johnson DK, Hirschkorn DF, Knape CC, Webster HK, Lowder J, et al. Lymphocyte subset analysis on frozen whole blood. Cytometry. 1997; 29: 340–50. PMID:9415417
26. Elliott HR, Tillin T, McArdle WL, Ho K, Duggirala A, Frayling TM, et al. Differences in smoking associ-ated DNA methylation patterns in South Asians and Europeans. Clin Epigenetics. 2014; 6: 4. doi:10. 1186/1868-7083-6-4PMID:24485148