Patients and Its Application for Early Detection
Yohei Miyagi1*, Masahiko Higashiyama2, Akira Gochi3, Makoto Akaike4, Takashi Ishikawa5, Takeshi Miura6, Nobuhiro Saruki7, Etsuro Bando8, Hideki Kimura9, Fumio Imamura10, Masatoshi Moriyama11, Ichiro Ikeda12, Akihiko Chiba13, Fumihiro Oshita14, Akira Imaizumi15*, Hiroshi Yamamoto15, Hiroshi Miyano15, Katsuhisa Horimoto16, Osamu Tochikubo17, Toru Mitsushima18, Minoru Yamakado19, Naoyuki Okamoto20
1Molecular Pathology and Genetics Division, Kanagawa Cancer Center, Yokohama, Japan,2Department of Thoracic Surgery, Osaka Medical Center for Cancer and Cardiovascular Diseases, Osaka, Japan,3Department of Gastroenterological Surgery, Transplant and Surgical Oncology, Okayama University Graduate School of Medicine, Dentistry, and Pharmaceutical Sciences, Okayama, Japan,4Department of Gastrointestinal Surgery, Kanagawa Cancer Center, Yokohama, Japan,5Department of Breast and Thyroid Surgery, Yokohama City University Medical Center, Yokohama, Japan,6Department of Urology, Kanagawa Cancer Center, Yokohama, Japan,7Department of Anesthesia, Gunma Prefectural Cancer Center, Ohta, Japan,8Division of Gastric Surgery, Shizuoka Prefectural Cancer Center, Nagaizumi, Japan,9Division of Thoracic Diseases, Chiba Prefectural Cancer Center, Chiba, Japan,10Department of Pulmonary Oncology, Osaka Medical Center for Cancer and Cardiovascular Diseases, Osaka, Japan, 11Department of Urology, Yokohama Municipal Citizen’s Hospital, Yokohama, Japan,12Department of Urology, Yokohama Minami Kyosai Hospital, Yokohama, Japan, 13Department of Breast and Thyroid Surgery, Kanagawa Cancer Center, Yokohama, Japan,14Department of Thoracic Oncology, Kanagawa Cancer Center, Yokohama, Japan,15Institute for Innovation, Ajinomoto, Co., Inc., Kawasaki, Japan,16Computational Biology Research Center, National Institute of Advanced Industrial Science and Technology, Tokyo, Japan,17Kanagawa Health Service Association, Yokohama, Japan,18Department of Gastroenterology, Kameda Medical Center Makuhari, Chiba, Japan, 19Center for Multiphasic Health Testing and Services, Mitsui Memorial Hospital, Tokyo, Japan,20Department of Epidemiology, Kanagawa Cancer Center, Yokohama, Japan
Abstract
Background: Recently, rapid advances have been made in metabolomics-based, easy-to-use early cancer detection methods using blood samples. Among metabolites, profiling of plasma free amino acids (PFAAs) is a promising approach because PFAAs link all organ systems and have important roles in metabolism. Furthermore, PFAA profiles are known to be influenced by specific diseases, including cancers. Therefore, the purpose of the present study was to determine the characteristics of the PFAA profiles in cancer patients and the possibility of using this information for early detection.
Methods and Findings: Plasma samples were collected from approximately 200 patients from multiple institutes, each diagnosed with one of the following five types of cancer: lung, gastric, colorectal, breast, or prostate cancer. Patients were compared to gender- and age- matched controls also used in this study. The PFAA levels were measured using high-performance liquid chromatography (HPLC)–electrospray ionization (ESI)–mass spectrometry (MS). Univariate analysis revealed significant differences in the PFAA profiles between the controls and the patients with any of the five types of cancer listed above, even those with asymptomatic early-stage disease. Furthermore, multivariate analysis clearly discriminated the cancer patients from the controls in terms of the area under the receiver-operator characteristics curve (AUC of ROC.0.75 for each cancer), regardless of cancer stage. Because this study was designed as case-control study, further investigations, including model construction and validation using cohorts with larger sample sizes, are necessary to determine the usefulness of PFAA profiling.
Conclusions:These findings suggest that PFAA profiling has great potential for improving cancer screening and diagnosis and understanding disease pathogenesis. PFAA profiles can also be used to determine various disease diagnoses from a single blood sample, which involves a relatively simple plasma assay and imposes a lower physical burden on subjects when compared to existing screening methods.
Citation:Miyagi Y, Higashiyama M, Gochi A, Akaike M, Ishikawa T, et al. (2011) Plasma Free Amino Acid Profiling of Five Types of Cancer Patients and Its Application for Early Detection. PLoS ONE 6(9): e24143. doi:10.1371/journal.pone.0024143
Editor:Libing Song, Sun Yat-sen University Cancer Center, China
ReceivedApril 8, 2011;AcceptedAugust 1, 2011;PublishedSeptember 7, 2011
Copyright:ß2011 Miyagi et al. This is an open-access article distributed under the terms of the Creative Commons Attribution License, which permits unrestricted use, distribution, and reproduction in any medium, provided the original author and source are credited.
Funding:This work has been supported by Grant-in-Aid for Scientific Research on Basic Research B (No. 17390195) from the Ministry of Education, Culture, Sports, Science and Technology of Japan. The funder had no role in study design, data collection and analysis, decision to publish, or preparation of the manuscript. Ajinomoto, Co., Inc. did have a role in study design, data collection and analysis, decision to publish, or preparation of the manuscript.
Competing Interests:The authors have read the journal’s policy and have the following conflicts: Dr. Horimoto, Dr. Tochikubo, Dr. Yamakado, and Dr. Okamoto have been consultants for Ajinomoto, Co., Inc. and receive consultancy fees from Ajinomoto, Co., Inc. Dr. Imaizumi, Dr. Yamamoto, and Dr. Miyano are employees of Ajinomoto, Co., Inc. Dr. Miyagi, Dr. Higashiyama, Dr. Gochi, Dr. Akaike, Dr. Ishikawa, Dr. Miura, Dr. Saruki, Dr. Bando, Dr. Kimura, Dr. Imamura, Dr. Moriyama, Dr. Ikeda, Dr. Chiba, Dr. Oshita, Dr. Tochikubo, Dr. Mitsushima, Dr. Yamakado, and Dr. Okamoto received research grants from Ajinomoto, Co., Inc. Dr. Higashiyama, Dr. Imamura, Dr. Imaizumi, and Dr. Okamoto have applied for patents for plasma amino-acid profiling using multivariate analysis as a diagnostic tool for lung cancer and cancers (WO2008/016111 and WO2009/110517), Dr. Gochi, Dr. Imaizumi, and Dr. Yamamoto have applied for patents for plasma amino-acid profiling using multivariate analysis as a diagnostic tool for gastric cancer (WO2009/099005), Dr. Imaizumi and Dr. Okamoto have applied for patents for plasma amino-acid profiling using multivariate analysis as a diagnostic tool for colorectal cancer (WO2008/075663), Dr. Imaizumi and Dr. Okamoto have applied for patents for plasma amino-acid profiling using multivariate analysis as a diagnostic tool for breast cancer (WO2008/075662), Dr. Miyagi, Dr. Miura, Dr. Imaizumi, Dr. Yamamoto, and Dr. Okamoto have applied for patents for plasma amino-acid profiling using multivariate analysis as a diagnostic tool for prostate cancer (WO2009/154297), and Dr. Miyano has applied for patents for plasma amino acid measurement systems(WO2003/069328 and WO2005/116629). This does not alter the authors’ adherence to all the PLoS One policies on sharing data and materials.
Introduction
Several minimally-invasive, easy-to-use cancer diagnostic meth-ods using peripheral blood or urine samples have recently been developed to ease the physical burden on patients and to reduce the costs and time involved [1,2,3,4,5,6,7,8]. Rapid advances have been made in cancer diagnosis and prognosis methods based on metabolome analysis [3,9,10,11,12,13,14], which frequently involves the use of multivariate analysis techniques, such as computer-aided, machine-learning systems for data mining.
Although metabolome analysis is a promising approach in screening for diseases such as cancer, some practical limitations remain. These include the necessity to measure a huge number of metabolites [15,16,17], data-redundancy problems, including the false-discovery rate (FDR) and overfitting, and cost constraints. One approach to overcoming these problems is ‘‘focused metabolomics’’, which limits the objects of the analysis to those that play roles in general metabolism and share physical similarities.
Amino acids are among the most suitable candidates for focused metabolomics as they are either ingested or synthesized endoge-nously and play essential physiological roles both as basic metabolites and metabolic regulators. To measure amino acids, plasma free amino acids (PFAAs), which abundantly circulate as a medium linking all organ systems, would be the most favorable target because their profiles have been known to be influenced by metabolic variations in specific organ systems induced by specific diseases [18,19,20,21]. Additionally, plasma samples can be collected easily from patients.
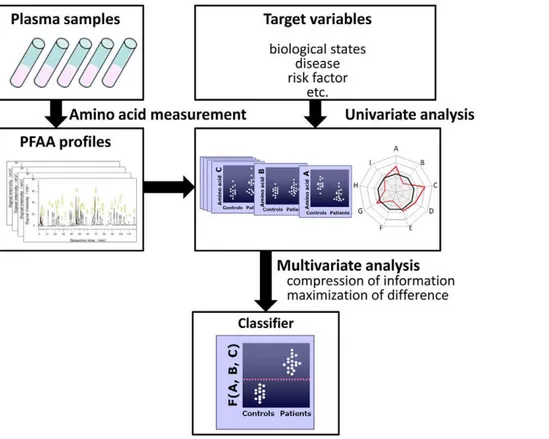
Several investigators have also reported changes in PFAA profiles in cancer patients [22,23,24,25,26,27,28]. However, despite evidence of a relationship between PFAA profiles and some types of cancer, few studies have explored the use of PFAA profiles for diagnosis because, although PFAA profiles differ significantly between patients, the differences in individual amino acids do not always provide sufficient discrimination abilities by themselves [24,29,30]. To address this issue, we previously constructed and tested a diagnostic index based on PFAA concentrations, known as the ‘‘AminoIndex technology’’ [29,30,31,32,33], to compress multidimensional information from PFAA profiles into single dimension and maximize the differences between patients and controls (Figure 1). We obtained preliminary data on the efficacy of the ‘‘AminoIndex technology’’ for the early detection of colorectal, breast, and lung cancers in approximately 150 samples from a single medical institute [29,30].
Moreover, technologies have recently been developed to analyze amino acids with high accuracy. For example, we developed a method to measure PFAA profiles using high-performance liquid chromatography (HPLC)–electrospray ioniza-tion (ESI)–mass spectrometry (MS) [34,35,36].
The present study aimed to determine the possibility of PFAA profiling for cancer diagnosis using a large number of samples from multiple medical institutes. We measured the PFAA profiles of approximately 200 cancer patients from three different institutes each with one of the following five types of cancer: lung, gastric, colorectal (CRC), breast, or prostate cancer. Patients were compared to five times sizes of gender- and age-matched controls also used in this study. We then compared the alterations in the
Figure 1. Concept of the generation of ‘‘AminoIndex technology’’.At the top of the diagram, PFAA concentrations are measured for each subject. In the middle, target variables and univariate analysis of PFAA profiles are represented. At the bottom, an estimation of the classifier with optimized discriminating power using multivariate analysis is presented.
PFAA profiles between the cancer patients and the controls using univariate and multivariate analyses. As a result, significant alterations in PFAA profiles were observed in cancer patients in comparison to control subjects. We demonstrated two types of alterations in PFAA profiles in cancer patients: some differences reflected the metabolic changes common to many cancers, while others were specific to each type of cancer. We also found that both common and cancer type-specific alterations in PFAA profiles were observed even in the patients with early stage cancer. Furthermore, using a large number of samples allowed us to verify the robustness of PFAA profiling for the early detection of various cancers.
Materials and Methods
Ethics
The study was conducted in accordance with the Declaration of Helsinki, and the protocol was approved by the ethics committees of the Kanagawa Cancer Center, the Osaka Medical Center for Cancer and Cardiovascular Diseases, the Okayama University Hospital, the Yokohama City University Medical Center, the Gunma Prefectural Cancer Center, the Shizuoka Prefectural Cancer Center, the Chiba Prefectural Cancer Center, the Yokohama Municipal Citizen’s Hospital, the Yokohama Minami Kyosai Hospital, the Kanagawa Health Service Association, the Kameda Medical Center Makuhari, and the Mitsui Memorial Hospital. All subjects gave their written informed consent for inclusion before they participated in the study. All data were analyzed anonymously throughout the study.
Subjects
Data from Japanese patients with lung cancer (LC), gastric cancer (GC), colorectal cancer (CRC), breast cancer (BC), and prostate cancer (PC) were analyzed in this study. The patients had been histologically diagnosed with primary cancer at various Japanese medical institutes between 2006 and 2009. The LC patients were recruited from the Osaka Medical Center for Cancer and Cardiovascular Diseases, the Chiba Prefectural Cancer
Center, the Kanagawa Cancer Center, and the Gunma Prefec-tural Cancer Center. The GC patients were recruited from the Okayama University Hospital, the Gunma Prefectural Cancer Center, and the Shizuoka Prefectural Cancer Center. The CRC patients were recruited from the Kanagawa Cancer Center, the Shizuoka Prefectural Cancer Center, and the Gunma Prefectural Cancer Center. The BC patients were recruited from the Yokohama City University Medical Center, the Kanagawa Cancer Center, and the Gunma Prefectural Cancer Center. The PC patients were recruited from the Kanagawa Cancer Center, the Yokohama Municipal Citizen’s Hospital, the Yokohama Minami Kyosai Hospital, and the Gunma Prefectural Cancer Center. Control subjects with no apparent cancer were chosen from among those undergoing comprehensive medical examina-tions at three different Japanese medical institutes (the Center for Multiphasic Health Testing and Services of the Mitsui Memorial Hospital, the Kameda Medical Center Makuhari, and the Kanagawa Health Service Association) between 2008 and 2009.
Colonic polyp patients were recruited from among those undergoing endoscopic polypectomy at the Kameda Medical Center Makuhari between 2006 and 2008.
For the purposes of data analysis, the patients were assigned to five groups based on their primary cancer diagnoses (,140–200 patients per group), and five age- and gender-matched control groups were also established (Table 1). Data sets for all of the cancer patients and controls, as well as all cancer patients stratified by gender, were also analyzed.
PFAA measurement
Blood samples were collected from the controls and the patients prior to any medical treatment. Blood samples (5 ml) were collected from forearm veins after overnight fasting in tubes containing ethylenediaminetetraacetic acid (EDTA; Termo, To-kyo, Japan) and were immediately placed on ice. Plasma was prepared by centrifugation at 3,000 rpm at 4uC for 15 min and then stored at280uC until analysis. After the plasma collection, all samples were stored and processed at the Institute for Innovation of the Ajinomoto Co., Inc. (Kawasaki, Japan). To reduce any bias
Table 1.Demographic and clinical characteristics of subjects.
Data set LC GC CRC BC PC
Patients Controls Patients Controls Patients Controls Patients Controls Patients Controls
Size Total 200 996 199 985 199 995 196 976 134 666
M/F 125/75 635/371 126/73 626/359 114/85 570/425 0/196 0/976 134/0 666/0
Age Mean 65.0a 63.2 64.8a 62.9 63.7 62.4 55.3 54.5 69.4c 65.8
(SD) (10.0) (9.2) (10.8) (9.7) (9.5) (9.5) (12.6) (11.1) (6.7) (6.1)
BMI Mean 22.5 22.9 22.7 22.8 23.0 22.8 22.4 22.0 23.4 23.4
(SD) (3.8) (3.0) (3.2) (3.0) (3.7) (3.0) (3.4) (3.5) (2.7) (2.5)
Stage 0 - - 8 26 -
-I(A) 29 120 63 75 0
II(B) 16 29 48 73 95
III(C) 54 26 59 13 19
IV(D) 28 24 19 0 15
Uncharacterized 1 0 2 9 5
ap
,0.05,
cp
,0.001.
For LC, GC, CRC, and BC, cancer stages were determined according to the International Union Against Cancer TNM Classification of Malignant Tumors, 6th edition [38], and for PC, cancer stages were determined according to Jewett staging system [39].
introduced prior to analysis, samples were analyzed in random order. The plasma samples were deproteinized using acetonitrile at a final concentration of 80% before measurement. The amino-acid concentrations in the plasma were measured by HPLC–ESI– MS, followed by precolumn derivatization. The analytical methods used were as described previously [34,35,36].
Among the 20 genetically-encoded amino acids, glutamate (Glu), aspartate (Asp), and cysteine (Cys) were excluded from the analysis because they are unstable in blood. Citrulline (Cit) and ornithine (Orn) were measured instead because they are relatively abundant in blood and are known to play important roles in metabolism. The following 19 amino acids and related molecules were therefore measured and analyzed: alanine (Ala), arginine (Arg), asparagine (Asn), Cit, glutamine (Gln), glycine (Gly), histidine (His), isoleucine (Ile), leucine (Leu), lysine (Lys), methionine (Met), Orn, phenylalanine (Phe), proline (Pro), serine (Ser), threonine (Thr), tryptophan (Trp), tyrosine (Tyr), and valine (Val).
Two metrics were made for each of the 19 amino acids including the absolute concentration of each amino acid, which directly reflected its availability and consumption, and the ratios associated with the specific metabolic status in each organ. The concentrations of the amino acids in the plasma were expressed in
mM, and the ratios of the amino acid concentrations were expressed by the follow equation:
X2i,j~XXi,j
k
Xi,k
where X2i,j is ratio of the amino-acid concentration of the j-th
amino acid of i-th subject, and Xi,j is the plasma concentration
(mM) of the j-th amino acid of i-th subject.
Statistical analysis
Two types of metric were used for each data set for analysis using either the amino-acid concentration or the ratio as explanatory variables.
Mean and SD. The mean amino-acid concentrations 6
standard deviations (SDs) were calculated to determine summarized PFAA profiles for both patients and controls.
Mann-Whitney U-test. The Mann-WhitneyU-test was used
to assess significant differences of the plasma amino-acid concentrations between the patients and the controls.
ROC analysis. Receiver-operator characteristic (ROC) curve
analyses were performed to determine the abilities of uni- and multi-variate analyses to discriminate between patients and controls. The patient labels were fixed as positive class labels. Therefore, an area under the ROC curve (AUC of ROC) value of
,0.5 indicated that the amino acid level was lower in the patients than the controls, whereas an AUC of ROC value of .0.5 indicated that it was higher. The 95% confidence interval (95% CI) of AUC of ROC for the discrimination of patients based on amino acid concentrations and ratios was also estimated as described by Hanley and McNeil [37].
Two-way analysis of variance (ANOVA). The two-way
ANOVA was used to evaluate the effects of gender, age, and smoking status as potential confounding factors. The presence of cancer and gender were assumed to be independent factors, age was treated as a continuous predictor rather than a categorical predictor, and the interaction term between the presence of cancer and smoking status was analyzed.
Two-class linear discrimination analysis (LDA). Linear
discrimination analysis (LDA) with stepwise variable selection was
performed to distinguish patients with each type of cancer from the control subjects, in which both the maximum and the minimum p-values for a term to be added or removed were set at 0.001.
Multi-class LDA for discrimination. LDA with stepwise
variable selection was also performed to distinguish patients with a specific cancer from the complete data set containing all cancer patients stratified by gender (four kinds of cancer patients in each data set). Because the size of each group was smaller than that of two-class LDA, the maximum p-value for a term to be added was set at 0.05 and the minimum p-value for a term to be removed was set at 0.10. The Mahalanobis distance was used as a metric of classification. The accuracy was defined as the ratio of the correctly discriminated patients to the total number of patients with each cancer instead of AUC of ROC because ROC analysis could be applied only for two-class discrimination.
Leave one out cross—validation (LOOCV). LOOCV was
performed to correct potential over-optimization for obtained LDA models. Briefly, one sample was omitted from the study data set, and the LDA model was calculated for the remaining samples to estimate coefficients for each amino acid. The function values for the left-out sample were calculated based on the model. This process was repeated until every sample in the study data set had been left out once.
Conditional logistic-regression (c-logistic) analysis.
C-logistic analysis was also performed to verify the effects of age and gender, potential confounding factors, on the discriminatory abilities of obtained LDA models to differentiate patients with each type of cancer from the controls.
Subgroup analysis. To assess the effects of cancer stage,
each data set was divided into a sub-data set according to disease stage and including corresponding controls, and analyzed using the ROC analysis in each data set.
Software
MATLAB (The Mathworks, Natick, MA) was used for the calculations of mean and SD, the Mann-Whitney U-test, ROC analysis, two-way ANOVA, LDAs, and LOOCV. GraphPad Prism (GraphPad Software, La Jolla, CA) was also used for the ROC curve analysis. LogXact (Cytel, Cambridge, MA) was used for the c-logistic analysis.
Results
Characteristics of subjects
Table 1 summarizes the characteristics of the subjects in this study. The data sets comprised 200 LC patients and 996 controls, 199 GC patients and 985 controls, 199 CRC patients and 995 controls, 198 BC patients and 976 controls, and 134 PC patients and 666 controls (Table 1). The sample size for each cancer type was greater than those in previous reports [25] and provided sufficient statistical power to test the robustness of the PFAA profiles for cancer diagnosis.
There were no significant differences in body mass index (BMI) among the data sets (Table 1). Weight loss due to malnutrition was therefore not expected to influence the results. Although significant differences in average age were observed among the data sets (LC,p,0.05; GC,p,0.05; and PC,p,0.001), the effects appeared to be relatively minor because the absolute values of these differences were small (Table 1).
according to the Jewett staging system [39]. For all types of cancer, a large proportion of the patients had early-stage disease. The fractions of patients at each stage according to type of cancer were as follows:,50% stage I,,10% stage II,,25% stage III, and ,15% stage IV for LC; ,60% stage I, ,15% stage II,,13% stage III, and ,12% stage IV for GC; ,35% stages 0 and I, ,25% stage II,,30% stage IV, and,10% stage IV for CRC; ,5% stage 0,,25% stage I,,25% stage II, and,7% stage III for BC; and,75% stage B,,13% stage C, and,12% stage D for PC (Table 1).
The patients with each type of cancer could be further subdivided based on histological type (for LC, GC, CRC, and BC) or Gleason score (for PC), as is summarized in Table S1. The characteristics of 34 colonic polyp patients as well as the smoking status of patients are also summarized in Table S1.
Shared PFAA profiles among cancers
Univariate analysis was used to compare the PFAA profiles of the cancer patients and controls. The differences in the significance levels of each amino acid between the patients and the controls are shown in Figure 2A. The results of the ROC analysis are depicted in Figure 2B because the levels of significance depend on sample size. The concentrations and ratios of each amino acid profile for both patients and controls are shown in Tables S2. And the AUCs of ROC and their CIs of each amino acid are shown in Table S3 (concentration) and Table S4 (ratio), respectively.
Two-way ANOVA was used to evaluate the potential confounding effects of gender, age, and smoking status. Correcting for these factors did not greatly affect the significance levels of each amino acid, suggesting that their effects on the PFAA profiles were minor (Table S5).
The plasma concentrations of Gln, Trp, and His were significantly decreased in all of the cancers except PC, and none of the amino acids showed increased concentrations across all types of cancer (p,0.05). The ratios of Trp and His were significantly decreased, while those of Pro and Orn were increased, in all cancers (p,0.05) (Figure 2).
To further examine the shared traits among cancer patients, the PFAA profiles were compared using a pooled data set including all cancer patients and controls. Notably, the amino acids that were affected by this type of analysis had significant differences in both concentration and ratio: 11 amino acids (Asn, Gln, Cit, Val, Met, Leu, Tyr, Phe, His, Trp, and Arg) showed decreases, while four amino acids (Ser, Pro, Gly, and Orn) exhibited increases (Figure 2). Changes in Gln, Trp, His, Pro, and Orn were detected in the analysis for all types of cancer. Alterations in these amino acids might therefore reflect characteristic changes in metabolism that are common to all cancers.
Specific PFAA profiles for each cancer
In addition to the changes that were common to all of the cancers, we detected alterations in PFAA profiles that were specific to each disease type (Figure 2). Overall, the concentrations of most amino acids were decreased in GC and CRC patients, whereas no clear trends in amino acid concentrations were observed in the other groups (Figure 2). Furthermore, some of the amino acids showed opposite trends in different types of cancer. For example, the concentrations of Thr were decreased in GC and CRC patients, but increased in BC patients (Figure 2). These variations in the PFAA profiles might reflect specific characteristics of each cancer, in contrast to the limited set of amino acids that are responsible for the metabolic changes shared by all cancers.
Changes in PFAA profiles in early-stage cancers
Although alterations in the PFAA profiles of cachexic patients with advanced cancer have been well documented, few reports have considered early-stage patients. However, a large fraction of the cancer patients in the current data set were in the early stages of disease (Table 1). The differences in PFAA profiles according to disease stage were therefore examined for each cancer (Figure 3, Figure S1, Table S3, Table S4).
Notably, alterations in the PFAA profiles were detected in all patients, including those in the early stages of disease, in the current study. All amino-acid concentrations and ratios were drastically decreased in early stage disease patients, regardless of the subsequent progression. In particular, significant decreases of each amino acid concentration were observed in GC and CRC patients (Figure 3A), and changes in each ratio were notable in all of the cancer patients (Figure 3B).
Early-stage cancer patients are generally asymptomatic. More-over, most of the subjects in the present study did not show significant weight loss (a symptom typical of cachectic patients) (Table 1), anorexia, or decreases in serum albumin concentrations (data not shown). The changes in the PFAA profiles in cancer patients therefore appeared to be independent of any effects caused by poor nutrition resulting from tumor progression.
Discriminating cancer patients and controls by PFAA profiles
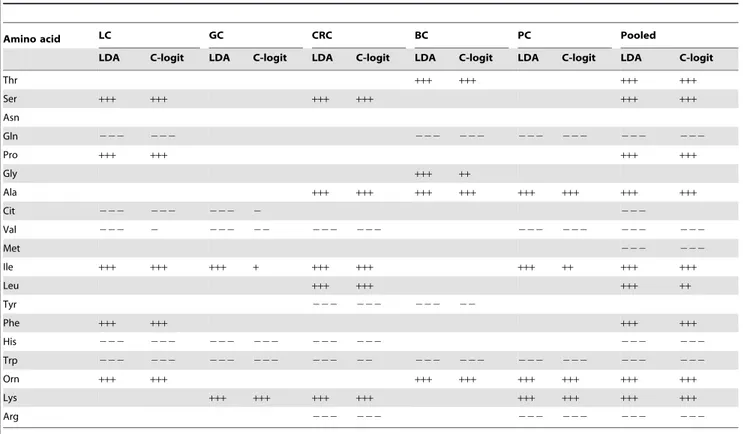
The results of the univariate analyses suggested that cancer patients and controls could be discriminated using multivariate analysis. By assuming that the presence of cancer and the concentrations or ratios of the PFAA profiles were objective and explanatory variables, respectively, LDA was able to distinguish cancer patients from the corresponding controls with variable selection. The results of variable selection are indicated in Table 2 (concentration) and Table S6 (ratio), respectively.
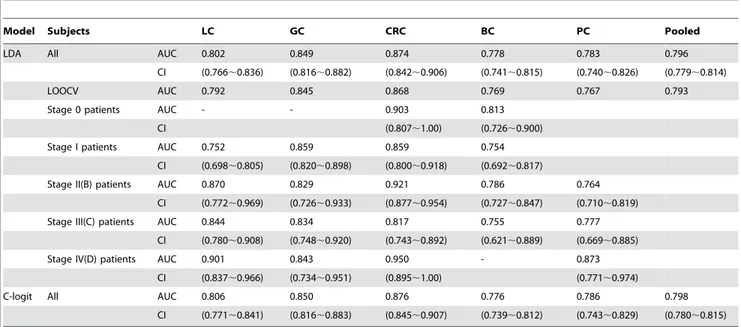
The discrimination abilities for each cancer patient were evaluated using the AUC of ROC of the discriminate score and were found to be.0.75 in all cases (Table 3 and Table S7). In concrete analysis, AUCs for the discrimination of patients based on the amino acid concentrations and ratios, respectively, were also estimated as follows: 0.802 (95% CI: 0.766,0.838) and 0.802 (95% CI: 0.767,0.837) for LC; 0.849 (95% CI: 0.816,0.882) and 0.816 (95% CI: 0.780,0.852) for GC; 0.874 (95% CI: 0.842,0.906) and 0.881 (95% CI: 0.851,0.910) for CRC; 0.778 (95% CI: 0.741,0.815) and 0.778 (95% CI: 0.741,0.815) for BC; and 0.783 (95% CI: 0.740,0.826) and 0.779 (95% CI: 0.740,0.819) for PC (Table 3 and Table S7). The discriminate analysis was therefore able to adequately distinguish between different types of patient cancer.
detected by the univariate analysis alone. Indeed, Spearman’s partial correlation coefficient between Val and cancer (or not) was20.127 (p,0.001), while the correlation coefficient between these two factors was 0.035 (not significant). Therefore, this suggested that the obtained LDA model reflected the metabolic network of PFAAs, which were not apparent thorough univariate analysis.
Because the obtained results may have been over-optimized, LOOCV was carried out to generate an unbiased analysis. This produced AUCs similar to those obtained for LDA, suggesting that there was no obvious over-optimization in the obtained LDA models (Table 3 and Table S7).
Subgroup analyses of divided data sets according to cancer stage, including corresponding controls, were then performed to assess the ability of PFAA profiles to distinguish between stages of cancer for each type of disease. In any stage of each cancer, the AUC of ROC was found to be higher than 0.75, suggesting that the obtained LDA models would thus be expected to be effective in detecting early as well as advanced stage cancers (Table 3 and Table S7).
The discrimination abilities for all cancer patients were also evaluated. The AUCs of ROC for both concentrations and ratios were 0.796 (95% CI: 0.779,0.814) and 0.785 (95% CI: 0.767,0.803), respectively (Table 3 and Table S7). Notably, most of the 19 amino acids were statistically selected for these discriminations: 16 for the concentrations and 12 for the ratios. Even using a rough classification, regardless of the type of cancer, it was possible to discriminate between patients and controls with high accuracy, and the overall contributions of numerous amino acids might reflect the large-scale characteristic changes associated with cancer metabolism.
A c-logistic analysis using matching factors (gender and age) was performed for each data set to evaluate and correct for potential confounding factors. Note that we used the combinations of amino acids obtained from the LDA models as explanatory variables. Although the c-logistic analysis was performed using all of the significant variables identified by the univariate analysis, the amino acids identified in the LDA were utilized to correct for potential confounding factors more adequately (data not shown). Both the levels of significance (Table 2 and Table S6) and the discrimina-tion abilities (Table 3 and Table S7) were not significantly altered by correcting for the potentially confounding factors, suggesting that these results were independent of gender and age effects.
To evaluate patients with non-neoplastic diseases, the PFAA profiles of colonic polyp patients were substituted into the LDA model for CRC. Most of the colonic polyp patients (31/34, 91.2%) were classified into the control group for the concentrations and ratios of both models, suggesting that the obtained models could discriminate CRC patients specifically.
Discrimination between cancer types by PFAA profiles In addition to differentiating between patients with each type of cancer and the controls, discrimination among patients within each cancer group was also performed by separating all the cancer patients into each disease subtype according to gender. This was done because the results of the present analyses identified changes in PFAA profiles that were common to all types of cancer as well as those specific to individual cancers.
The accuracies of all discriminant analyses using amino acid concentrations as explanatory variables were close to or better than 50% both in male patients (Table 4) and female patients (Table 5) data set. The discrimination accuracy among cancer patients was less than that between patients and controls. Six amino acids (Gly, Cit, Val, Tyr, Trp, and Arg) were commonly selected in these analyses, regardless of gender (data not shown). An additional six amino acids (Gln, Met, Leu, His, Orn, and Lys) were selected in the male patient data set, and four (Thr, Ser, Ile, and Phe) were selected in the female patient data set (data not shown). Five of the 16 amino acids listed above were selected in the discrimination between patients and controls, while the remainder might have been responsible for the characteristic features of each cancer.
The accuracies were similar between the analyses using ratios as explanatory variables and those using concentrations both in male patients (Table S8) and female patients (Table S9). Seven amino acids (Gln, Cit, Val, Tyr, Trp, Lys, and Arg) were commonly selected regardless of gender in these analyses (data not shown). An additional four amino acids (Ala, Met, Leu, and His) were selected in the male patient data set, and four (Thr, Ser, Ile, Orn) were selected in the female patient data set (data not shown). Five amino acids (Cit, Val, Tyr, Trp, and Arg) from each set were selected for both explanatory variables, suggesting that the changes to the respective PFAAs were specific to certain types of cancer.
LOOCV was also carried out and resulted in similar accuracies for the discrimination analyses, suggesting that there was no obvious over-optimization in the obtained models (Table 4, Table 5, Table S8 and Table S9).
Discussion
The present study demonstrated the use of PFAA profiling as a focused metabolomics approach for the early detection of patients with any of five types of cancer. Combining novel analytical techniques and both univariate and multivariate statistical analyses, previously unknown aspects of amino acid metabolism in humans have been revealed. The sample size in the present study was considerably larger than those reported previously [25,29,30], and provided sufficient statistical power to test the robustness of PFAA profiling for cancer diagnosis. We also demonstrated the possibility of detecting cancers, both specifically and broadly, using multivariate analysis to compress the PFAA profile data, even for patients with early stage cancer.
In the previous studies, the alterations in PFAA profiles in cancer patients sometimes seem inconsistent[22,23,24,25,26,27,28,29,30], and some discrepancies existed between our current study and those reported in the literature [25]. This discrepancy may be due not only to sample size and the varying predominance of early stage cancers but also to some other factors such as amino acid measurement methods. On the other hand, alterations in the PFAA profiles in our present study were consistent with the results of our previous studies, in which samples were collected from a single medical institute [29,30]. Furthermore, there are also many similarities between our results and those of previous studies. For example, decreases in His and Gln levels, which have been observed broadly in previous reports, and increases in Pro and Ala levels in BC are consistent with our findings [25].
Figure 2. PFAA profiles of cancer patients.The results of the Mann-WhitneyU-test (A) and receiver-operator characteristic (ROC) curve analysis (B) are indicated. A. Colored cells indicate that the concentration or ratio is increased in cancer patients at p,0.001 (red), p,0.01 (orange), and p,0.05 (pink), and decreased in cancer patients at p,0.001 (blue), p,0.01(sky blue), and p,0.05 (light blue), respectively. B. Axes show the AUC of ROC for each amino acid to discriminate patients from controls. Concentrations and ratios of each cancer patient and the pooled data set are indicated, respectively. Black bold lines indicate the point where the AUC of ROC = 0.5.
Cancer is expected to become the leading cause of death worldwide within a few years. Therefore, it is crucial that methods for the prevention, early detection, and treatment of cancers should be implemented to reduce mortality. Various screening methods have been established for the cancers included in our study. However, the high specificity of these methods means that subjects must undergo each screening examination separately, which can be expensive and time consuming. These examinations can also impose a physical and/or mental burden upon subjects, which can lead to avoidance. By contrast, the method described in the present study involves a relatively simple plasma assay and imposes a low physical burden on subjects. This method could also be used as versatile health assessment as other diseases in which PFAA profiles can be altered, such as diabetes[18], hepatic failure[19], and renal failure[21], can also be evaluated.
It should be noted that the models derived from this case-control study could not be used directly to make further observations or predictions, despite providing a preliminary demonstration of the potentially high value of this method for cancer discrimination. Further investigations, including model construction and validation using cohorts with larger sample sizes, are in progress to clarify the clinical utility of this approach. Moreover, the possibility of continuous PFAA profiling as a means to determine prognosis after surgery or chemotherapy is also being investigated.
Our investigation demonstrated two types of alterations in PFAA profiles of cancer patients: those in a limited set of amino acids reflecting metabolic changes common to many cancers; and those in a larger group of amino acids representing metabolic characteristics specific to each cancer. Alterations in PFAA profiles were observed even in patients with early-stage cancer, most of whom had no apparent symptoms. This strongly suggested that the alterations in PFAA profiles identified in the current study were independent of the effects of poor nutrition caused by tumor progression.
Many previous reports have shown that metabolism, including that of amino acids, is notably altered in cancer cells [3,13,40] and that changes in PFAA profiles can also occur [22,24,25,26,27,28,29,30], especially in cachexic patients with advanced cancer [23,25]. Among whole metabolites, amino acids have been frequently identified as having associations with cancer in other studies [10,13,41,42,43]. The current study demonstrated that mechanisms other than malnutrition can drive the changes in PFAA profiles.
Besides cancer-dependent malnutrition, significant decreases in PFAA concentrations and various indicators of nutritional status such as BMI and serum albumin levels are observed in cancer-independent cachexia [44,45,46]. In the present study, no apparent decreases in those indicators were observed, strongly suggesting that alterations in PFAA were also independent of nutritional status mediated by factors not related to cancer. Figure 3. PFAA profiles of early- and advanced-stage cancer patients.The axes show the AUC of ROC for each amino acid for discriminating patients from controls. A. Comparison of concentrations of cancer patients and controls. B. Comparison of ratios of cancer patients and controls. Scale as described for Figure 2. For LC, GC, CRC, and BC, cancer stages were determined according to the International Union Against Cancer TNM Classification of Malignant Tumors, 6th edition [38], and for PC, cancer stages were determined according to Jewett staging system [39]. doi:10.1371/journal.pone.0024143.g003
Table 2.Variables incorporated into LDA and c-logistic models using concentrations as explanatory variables.
Amino acid LC GC CRC BC PC Pooled
LDA C-logit LDA C-logit LDA C-logit LDA C-logit LDA C-logit LDA C-logit
Thr +++ +++ +++ +++
Ser +++ +++ +++ +++ +++ +++
Asn
Gln 222 222 222 222 222 222 222 222
Pro +++ +++ +++ +++
Gly +++ ++
Ala +++ +++ +++ +++ +++ +++ +++ +++
Cit 222 222 222 2 222
Val 222 2 222 22 222 222 222 222 222 222
Met 222 222
Ile +++ +++ +++ + +++ +++ +++ ++ +++ +++
Leu +++ +++ +++ ++
Tyr 222 222 222 22
Phe +++ +++ +++ +++
His 222 222 222 222 222 222 222 222
Trp 222 222 222 222 222 22 222 222 222 222 222 222
Orn +++ +++ +++ +++ +++ +++ +++ +++
Lys +++ +++ +++ +++ +++ +++ +++ +++
Arg 222 222 222 222 222 222
Nevertheless, it remains unclear how the metabolic changes occurring in cancer patients affect the PFAA profile of the whole body, even in patients with early-stage tumors. To clarify the relationship between carcinogenesis and changes in PFAA profiles, we are further investigating the contribution of local effects caused by cancer cell metabolism and the systemic responses of the immune system against tumors or factors released by cancer cells. Changes in metabolism can be detected in cancer cells even in early-stage patients. Hirayama et al. reported no significant correlation between the levels of cancer cell metabolites, including several amino acids, and the tumor stage [13]. The metabolism of Trp is of particular interest because it was identified as one of the most important amino acids in relation to cancer progression in our study. Overexpression of indoleamine-2,3- dioxygenase (IDO), the first enzyme in the kynurenine Trp metabolism pathway in humans, has been reported in cancer cells [47]. IDO is induced in many different tumors and has been suggested to play a role in cancer-mediated evasion of the immune system [47,48,49,50].
Arg, Orn, Cit, and Pro are known to be closely related to immune function. For example, Qiuet al.reported an association between the urea cycle and metabolic alterations in CRC patients and found no correlation between the metabolite profile and cancer progression [43]. Cancer cells also release factors that can
alter general physical conditions. For example, the transcriptional regulatory molecule high-mobility group B1 (HMGB1) was recently shown to regulate cancer-cell tumorigenesis, expansion, and invasion [51,52,53].
Further elucidation of these mechanisms might allow for the development of both static and dynamic models of carcinogenesis through system analysis [31]. Recently, computer-aided studies have been reported that integrate hierarchical ‘omics’ datasets for the systemic understanding of metabolic phenotypes to reconstruct the regulatory network from physiological data by means of system analysis. System analysis of cancer patients based on whole body amino acid metabolism could reveal information concerning the nature of a disease and help to establish strategies for its prevention, early detection, prognosis, monitoring, and treatment. In contrast to many similar efforts to detect biomarkers of disease as single specific molecules (DNA, microRNA, proteins, peptides, or metabolites) in peripheral blood, our approach was to focus on the metabolic status, which is indicative of multivariate function, using non-specific metabolites. Therefore, we believe that our method is superior to those used in other studies, both in versatility and efficiency, because only one amino acid measure-ment can be applied for detection of various disease states (i.e., renal failure, hepatic failure, and nutritional status).
Table 3.Discrimination performance of LDA and c-logistic models using concentrations as explanatory variables.
Model Subjects LC GC CRC BC PC Pooled
LDA All AUC 0.802 0.849 0.874 0.778 0.783 0.796
CI (0.766,0.836) (0.816,0.882) (0.842,0.906) (0.741,0.815) (0.740,0.826) (0.779,0.814)
LOOCV AUC 0.792 0.845 0.868 0.769 0.767 0.793
Stage 0 patients AUC - - 0.903 0.813
CI (0.807,1.00) (0.726,0.900)
Stage I patients AUC 0.752 0.859 0.859 0.754
CI (0.698,0.805) (0.820,0.898) (0.800,0.918) (0.692,0.817)
Stage II(B) patients AUC 0.870 0.829 0.921 0.786 0.764
CI (0.772,0.969) (0.726,0.933) (0.877,0.954) (0.727,0.847) (0.710,0.819)
Stage III(C) patients AUC 0.844 0.834 0.817 0.755 0.777
CI (0.780,0.908) (0.748,0.920) (0.743,0.892) (0.621,0.889) (0.669,0.885)
Stage IV(D) patients AUC 0.901 0.843 0.950 - 0.873
CI (0.837,0.966) (0.734,0.951) (0.895,1.00) (0.771,0.974)
C-logit All AUC 0.806 0.850 0.876 0.776 0.786 0.798
CI (0.771,0.841) (0.816,0.883) (0.845,0.907) (0.739,0.812) (0.743,0.829) (0.780,0.815)
doi:10.1371/journal.pone.0024143.t003
Table 4.Multiclass discriminant analyses of male cancer patients using concentrations as explanatory variables.
Patients with:
LC GC CRC PC
Discriminated as: LC 72(69) 19(22) 12(13) 26(26)
GC 18(19) 58(52) 16(17) 25(25)
CRC 13(14) 25(28) 71(69) 16(17)
PC 22(23) 24(24) 15(15) 67(66)
Total 125 126 114 134
Accuracy 57.6%(55.2%) 46.0%(41.3%) 62.3%(60.5%) 50.0%(49.3%)
Supporting Information
Figure S1 PFAA profiles of cancer patients stratified by
progression stage. The axes show the AUC of ROC for each amino acid for discriminating patients from controls. A. Comparison of concentrations of cancer patients and controls. B. Comparison of ratios of cancer patients and controls. Scale as described for Figure 2. For LC, GC, CRC, and BC, cancer stages were determined according to the International Union Against Cancer TNM Classification of Malignant Tumors, 6th edition [38], and for PC, cancer stages were determined according to Jewett staging system [39].
(TIF)
Table S1 Detailed demographic and clinical
character-istics of subjects.a:p,0.05, c:p,0.001 *: For LC, GC, CRC, and BC, cancer stages were determined according to the International Union Against Cancer TNM Classification of Malignant Tumors, 6th edition [38], and for PC, cancer stages were determined according to Jewett staging system [39]. (XLS)
Table S2 PFAA profiles of cancer patients and controls.
(XLS)
Table S3 AUCs of ROC of each amino acid
concentra-tion for discriminaconcentra-tion for cancer patients from con-trols.
(XLS)
Table S4 AUCs of ROC of each amino acid ratio for
discrimination for cancer patients from controls.AUCs were calculated using all patients and controls, and patiens and matched controls stratified by cancer stage.
(XLS)
Table S5 Significance values for PFAA profiles for each
data set by two-way ANOVA for the effects of cancer existence and other parameters.Column headings indicate Mann-Whitney U-test of cancer existence (None), two-way ANOVA for the effects of cancer existence and gender (Gender), cancer existence and age (Age), and cancer existence and smoking status (Smoking).
(XLS)
Table S6 Variables incorporated into LDA and
c-logistic models using ratios as explanatory variables. +, ++, +++: positive coefficients in the model 2, 22, 222: negative coefficients in the model+,2: p,0.05,++,22: p,0.01,
+++,222: p,0.001. (XLS)
Table S7 Discrimination performance of LDA and
c-logistic models using ratios as explanatory variables. (XLS)
Table S8 Multiclass discriminant analyses of male
cancer patients using ratios as explanatory variables. The numbers in the blanket indicate the results of LOOCV. (XLS)
Table S9 Multiclass discriminant analyses of female
cancer patients using ratios as explanatory variables. The numbers in the blanket indicate the results of LOOCV. (XLS)
Acknowledgments
We thank Mr. Takashi Yamamoto and Ms. Naoko Kageyama for the amino acid analysis, Dr. Takashi Daimon for help with the statistical analysis, and Ms. Mariko Takasu and Ms. Tomoko Kasakura for help with data acquisition. We also thank all members of the medical staffs of the Osaka Medical Center for Cancer and Cardiovascular Diseases, the Chiba Prefectural Cancer Center, the Kanagawa Cancer Center, the Okayama University Hospital, the Shizuoka Prefectural Cancer Center, the Gunma Prefectural Cancer Center, Yokohama City University Medical Center, the Yokohama Municipal Citizen’s Hospital, the Yokohama Minami Kyosai Hospital, the Center for Multiphasic Health Testing and Services of the Mitsui Memorial Hospital, the Kameda Medical Center Makuhari, and the Kanagawa Health Service Association for help with sample collection.
Author Contributions
Conceived and designed the experiments: YM HY MY NO. Performed the experiments: MH AG MA TI T. Miura NS EB HK FI MM II AC FO HM OT T. Mitsushima MY NO. Analyzed the data: YM AI KH. Contributed reagents/materials/analysis tools: HM. Wrote the paper: YM AI KH.
References
1. Couzin J (2009) Biomarkers. Metabolite in urine may point to high-risk prostate cancer. Science 323: 865.
2. Hunter MP, Ismail N, Zhang X, Aguda BD, Lee EJ, et al. (2008) Detection of micro-RNA expression in human peripheral blood microvesicles. PLoS One 3: e3694. 3. Kim Y, Koo I, Jung BH, Chung BC, Lee D (2010) Multivariate classification of urine
metabolome profiles for breast cancer diagnosis. BMC Bioinformatics 11 Suppl 2: S4.
4. Nevedomskaya E, Ramautar R, Derks R, Westbroek I, Zondag G, et al. (2010) CE-MS for metabolic profiling of volume-limited urine samples: application to accelerated aging TTD mice. J Proteome Res 9: 4869–4874.
5. Pasikanti KK, Esuvaranathan K, Ho PC, Mahendran R, Kamaraj R, et al. (2010) Noninvasive urinary metabonomic diagnosis of human bladder cancer. J Proteome Res 9: 2988–2995.
Table 5.Multiclass discriminant analyses of female cancer patients using concentrations as explanatory variables.
Patients with:
LC GC CRC BC
Discriminated as: LC 41(37) 4(6) 8(11) 43(44)
GC 13(14) 40(38) 15(16) 30(30)
CRC 6(8) 13(13) 52(47) 17(17)
BC 15(16) 16(16) 10(11) 106(105)
Total 75 73 85 196
Accuracy 54.7%(49.3%) 54.8%(52.1%) 61.2%(55.2%) 54.1(53.6%)
6. Tiziani S, Lopes V, Gunther UL (2009) Early stage diagnosis of oral cancer using 1H NMR-based metabolomics. Neoplasia 11: 269–276, 264p following 269.
7. Roth C, Kasimir-Bauer S, Pantel K, Schwarzenbach H (2011) Screening for circulating nucleic acids and caspase activity in the peripheral blood as potential diagnostic tools in lung cancer. Mol Oncol 5: 281–291.
8. Roth C, Rack B, Muller V, Janni W, Pantel K, et al. (2010) Circulating microRNAs as blood-based markers for patients with primary and metastatic breast cancer. Breast Cancer Res 12: R90.
9. Abate-Shen C, Shen MM (2009) Diagnostics: The prostate-cancer metabolome. Nature 457: 799–800.
10. Asiago VM, Alvarado LZ, Shanaiah N, Gowda GA, Owusu-Sarfo K, et al. (2010) Early detection of recurrent breast cancer using metabolite profiling. Cancer Res 70: 8309–8318.
11. Bictash M, Ebbels TM, Chan Q, Loo RL, Yap IK, et al. (2010) Opening up the ‘‘Black Box’’: metabolic phenotyping and metabolome-wide association studies in epidemiology. J Clin Epidemiol 63: 970–979.
12. Chadeau-Hyam M, Ebbels TM, Brown IJ, Chan Q, Stamler J, et al. (2010) Metabolic profiling and the metabolome-wide association study: significance level for biomarker identification. J Proteome Res 9: 4620–4627.
13. Hirayama A, Kami K, Sugimoto M, Sugawara M, Toki N, et al. (2009) Quantitative metabolome profiling of colon and stomach cancer microenviron-ment by capillary electrophoresis time-of-flight mass spectrometry. Cancer Res 69: 4918–4925.
14. Slupsky CM, Steed H, Wells TH, Dabbs K, Schepansky A, et al. (2010) Urine metabolite analysis offers potential early diagnosis of ovarian and breast cancers. Clin Cancer Res 16: 5835–5841.
15. Blaise BJ, Shintu L, Elena B, Emsley L, Dumas ME, et al. (2009) Statistical recoupling prior to significance testing in nuclear magnetic resonance based metabonomics. Anal Chem 81: 6242–6251.
16. Denkert C, Budczies J, Kind T, Weichert W, Tablack P, et al. (2006) Mass spectrometry-based metabolic profiling reveals different metabolite patterns in invasive ovarian carcinomas and ovarian borderline tumors. Cancer Res 66: 10795–10804.
17. Rubtsov DV, Waterman C, Currie RA, Waterfield C, Salazar JD, et al. (2010) Application of a Bayesian deconvolution approach for high-resolution (1)H NMR spectra to assessing the metabolic effects of acute phenobarbital exposure in liver tissue. Anal Chem 82: 4479–4485.
18. Felig P, Marliss E, Ohman JL, Cahill CF, Jr. (1970) Plasma amino acid levels in diabetic ketoacidosis. Diabetes 19: 727–728.
19. Fischer JE, Rosen HM, Ebeid AM, James JH, Keane JM, et al. (1976) The effect of normalization of plasma amino acids on hepatic encephalopathy in man. Surgery 80: 77–91.
20. Holm E, Sedlaczek O, Grips E (1999) Amino acid metabolism in liver disease. Curr Opin Clin Nutr Metab Care 2: 47–53.
21. Hong SY, Yang DH, Chang SK (1998) The relationship between plasma homocysteine and amino acid concentrations in patients with end-stage renal disease. J Ren Nutr 8: 34–39.
22. Cascino A, Muscaritoli M, Cangiano C, Conversano L, Laviano A, et al. (1995) Plasma amino acid imbalance in patients with lung and breast cancer. Anticancer Res 15: 507–510.
23. Heber D, Byerly LO, Chlebowski RT (1985) Metabolic abnormalities in the cancer patient. Cancer 55: 225–229.
24. Kubota A, Meguid MM, Hitch DC (1992) Amino acid profiles correlate diagnostically with organ site in three kinds of malignant tumors. Cancer 69: 2343–2348.
25. Lai HS, Lee JC, Lee PH, Wang ST, Chen WJ (2005) Plasma free amino acid profile in cancer patients. Semin Cancer Biol 15: 267–276.
26. Norton JA, Gorschboth CM, Wesley RA, Burt ME, Brennan MF (1985) Fasting plasma amino acid levels in cancer patients. Cancer 56: 1181–1186. 27. Proenza AM, Oliver J, Palou A, Roca P (2003) Breast and lung cancer are
associated with a decrease in blood cell amino acid content. J Nutr Biochem 14: 133–138.
28. Vissers YL, Dejong CH, Luiking YC, Fearon KC, von Meyenfeldt MF, et al. (2005) Plasma arginine concentrations are reduced in cancer patients: evidence for arginine deficiency? Am J Clin Nutr 81: 1142–1146.
29. Maeda J, Higashiyama M, Imaizumi A, Nakayama T, Yamamoto H, et al. (2010) Possibility of multivariate function composed of plasma amino acid profiles as a novel screening index for non-small cell lung cancer: a case control study. BMC Cancer 10: 690.
30. Okamoto N, Miyagi Y, Chiba A, Akaike M, Shiozawa M, et al. (2009) Diagnostic modeling with differences in plasma amino acid profiles between non-cachectic colorectal/breast cancer patients and healthy individuals. Int J Med Med Sci 1: 1–8.
31. Kimura T, Noguchi Y, Shikata N, Takahashi M (2009) Plasma amino acid analysis for diagnosis and amino acid-based metabolic networks. Curr Opin Clin Nutr Metab Care 12: 49–53.
32. Noguchi Y, Zhang QW, Sugimoto T, Furuhata Y, Sakai R, et al. (2006) Network analysis of plasma and tissue amino acids and the generation of an amino index for potential diagnostic use. Am J Clin Nutr 83: 513S–519S. 33. Zhang Q, Takahashi M, Noguchi Y, Sugimoto T, Kimura T, et al. (2006)
Plasma amino acid profiles applied for diagnosis of advanced liver fibrosis in patients with chronic hepatitis C infection. Hepatol Res 34: 170–177. 34. Shimbo K, Kubo S, Harada Y, Oonuki T, Yokokura T, et al. (2009) Automated
precolumn derivatization system for analyzing physiological amino acids by liquid chromatography/mass spectrometry. Biomed Chromatogr 24: 683–691. 35. Shimbo K, Oonuki T, Yahashi A, Hirayama K, Miyano H (2009) Precolumn
derivatization reagents for high-speed analysis of amines and amino acids in biological fluid using liquid chromatography/electrospray ionization tandem mass spectrometry. Rapid Commun Mass Spectrom 23: 1483–1492. 36. Shimbo K, Yahashi A, Hirayama K, Nakazawa M, Miyano H (2009)
Multifunctional and highly sensitive precolumn reagents for amino acids in liquid chromatography/tandem mass spectrometry. Anal Chem 81: 5172–5179. 37. Hanley JA, McNeil BJ (1982) The meaning and use of the area under a receiver
operating characteristic (ROC) curve. Radiology 143: 29–36.
38. Sobin L, Wittekind C, eds. TNM Classification of Malignant Tumours, Sixth Edition. New York: Wiley-Liss.
39. Jewett HJ (1975) The present status of radical prostatectomy for stages A and B prostatic cancer. Urol Clin North Am 2: 105–124.
40. Borgan E, Sitter B, Lingjaerde OC, Johnsen H, Lundgren S, et al. (2010) Merging transcriptomics and metabolomics - advances in breast cancer profiling. BMC Cancer 10: 628.
41. Rocha CM, Barros AS, Gil AM, Goodfellow BJ, Humpfer E, et al. (2010) Metabolic profiling of human lung cancer tissue by 1H high resolution magic angle spinning (HRMAS) NMR spectroscopy. J Proteome Res 9: 319–332. 42. Urayama S, Zou W, Brooks K, Tolstikov V (2010) Comprehensive mass
spectrometry based metabolic profiling of blood plasma reveals potent discriminatory classifiers of pancreatic cancer. Rapid Commun Mass Spectrom 24: 613–620.
43. Qiu Y, Cai G, Su M, Chen T, Zheng X, et al. (2009) Serum metabolite profiling of human colorectal cancer using GC-TOFMS and UPLC-QTOFMS. J Proteome Res 8: 4844–4850.
44. Bossola M, Tazza L, Luciani G (2009) Mechanisms and treatment of anorexia in end-stage renal disease patients on hemodialysis. J Ren Nutr 19: 2–9. 45. Morrison WL, Gibson JN, Rennie MJ (1988) Skeletal muscle and whole body
protein turnover in cardiac cachexia: influence of branched-chain amino acid administration. Eur J Clin Invest 18: 648–654.
46. Polge A, Bancel E, Bellet H, Strubel D, Poirey S, et al. (1997) Plasma amino acid concentrations in elderly patients with protein energy malnutrition. Age Ageing 26: 457–462.
47. Lob S, Konigsrainer A, Zieker D, Brucher BL, Rammensee HG, et al. (2009) IDO1 and IDO2 are expressed in human tumors: levo- but not dextro-1-methyl tryptophan inhibits tryptophan catabolism. Cancer Immunol Immunother 58: 153–157.
48. Lob S, Konigsrainer A, Rammensee HG, Opelz G, Terness P (2009) Inhibitors of indoleamine-2,3-dioxygenase for cancer therapy: can we see the wood for the trees? Nat Rev Cancer 9: 445–452.
49. Muller AJ, DuHadaway JB, Donover PS, Sutanto-Ward E, Prendergast GC (2005) Inhibition of indoleamine 2,3-dioxygenase, an immunoregulatory target of the cancer suppression gene Bin1, potentiates cancer chemotherapy. Nat Med 11: 312–319.
50. Zamanakou M, Germenis AE, Karanikas V (2007) Tumor immune escape mediated by indoleamine 2,3-dioxygenase. Immunol Lett 111: 69–75. 51. Chung HW, Lee SG, Kim H, Hong DJ, Chung JB, et al. (2009) Serum high
mobility group box-1 (HMGB1) is closely associated with the clinical and pathologic features of gastric cancer. J Transl Med 7: 38.
52. Lotze MT, DeMarco RA (2003) Dealing with death: HMGB1 as a novel target for cancer therapy. Curr Opin Investig Drugs 4: 1405–1409.