A Novel Multivariate Index for Pancreatic
Cancer Detection Based On the Plasma Free
Amino Acid Profile
Nobuyasu Fukutake1, Makoto Ueno2, Nobuyoshi Hiraoka3, Kazuaki Shimada4,
Koichi Shiraishi5, Nobuhiro Saruki6, Toshifumi Ito7, Minoru Yamakado8, Nobukazu Ono9*, Akira Imaizumi9, Shinya Kikuchi9, Hiroshi Yamamoto9, Kazuhiro Katayama1*
1Department of Hepatobiliary and Pancreatic Oncology, Osaka Medical Center of Cancer and Cardiovascular Diseases, Osaka, Japan,2Division of Hepatobiliary and Pancreatic Medical Oncology, Kanagawa Cancer Center, Kanagawa, Japan,3Division of Pathology and Clinical Laboratories, National Cancer Center Hospital, Tokyo, Japan,4Hepatobiliary and Pancreatic Surgery Division, National Cancer Center Hospital, Tokyo, Japan,5Division of Gastroenterology, Department of Internal Medicine, Tokai University Oiso Hospital, Kanagawa, Japan,6Department of Anesthesia, Gunma Prefectural Cancer Center, Gunma, Japan,7Department of Gastroenterology and Hepatology, Japan Community Healthcare Organization (JCHO), Osaka Hospital, Osaka, Japan,8Center for Multiphasic Health Testing and Services, Mitsui Memorial Hospital, Tokyo, Japan,9Institute for Innovation, Ajinomoto Co., Inc., Kanagawa, Japan
*[email protected](NO);[email protected](KK)
Abstract
Background
The incidence of pancreatic cancer (PC) continues to increase in the world, while most patients are diagnosed with advanced stages and survive<12 months. This poor prognosis is attributable to difficulty of early detection. Here we developed and evaluated a multivari-ate index composed of plasma free amino acids (PFAAs) for early detection of PC.
Methods
We conducted a cross-sectional study in multi-institutions in Japan. Fasting plasma sam-ples from PC patients (n = 360), chronic pancreatitis (CP) patients (n = 28), and healthy con-trol (HC) subjects (n = 8372) without apparent cancers who were undergoing
comprehensive medical examinations were collected. Concentrations of 19 PFAAs were measured by liquid chromatography–mass spectrometry. We generated an index consist-ing of the followconsist-ing six PFAAs: serine, asparagine, isoleucine, alanine, histidine, and trypto-phan as variables for discrimination in a training set (120 PC and matching 600 HC) and evaluation in a validation set (240 PC, 28 CP, and 7772 HC).
Results
Several amino acid concentrations in plasma were significantly altered in PC. Plasma tryp-tophan and histidine concentrations in PC were particularly low, while serine was particu-larly higher than that of HC. The area under curve (AUC) based on receiver operating characteristic (ROC) curve analysis of the resulting index to discriminate PC from HC were
OPEN ACCESS
Citation:Fukutake N, Ueno M, Hiraoka N, Shimada K, Shiraishi K, Saruki N, et al. (2015) A Novel Multivariate Index for Pancreatic Cancer Detection Based On the Plasma Free Amino Acid Profile. PLoS ONE 10(7): e0132223. doi:10.1371/journal. pone.0132223
Editor:Francisco X. Real, Centro Nacional de Investigaciones Oncológicas (CNIO), SPAIN
Received:January 6, 2015
Accepted:June 12, 2015
Published:July 2, 2015
Copyright:© 2015 Fukutake et al. This is an open access article distributed under the terms of the
Creative Commons Attribution License, which permits unrestricted use, distribution, and reproduction in any medium, provided the original author and source are credited.
Data Availability Statement:The authors confirm that, for approved reasons, some access restrictions apply to the data underlying the findings. The data underlying the findings in our study cannot made public due the nature of ethical approvals for the study. The data are available from the Osaka Medical Center of Cancer and Cardiovascular Diseases Ethics Committee (via email to katayama-ka@mc. pref.osaka.jp) for researchers who meet the criteria for access to confidential data.
0.89 [95% confidence interval (CI), 0.86–0.93] in the training set. In the validation set, AUCs based on ROC curve analysis of the PFAA index were 0.86 (95% CI, 0.84–0.89) for all PC patients versus HC subjects, 0.81 (95% CI, 0.75–0.86) for PC patients from stage IIA to IIB versus HC subjects, and 0.87 (95% CI, 0.80–0.93) for all PC patients versus CP patients.
Conclusions
These findings suggest that the PFAA profile of PC was significantly different from that of HC. The PFAA index is a promising biomarker for screening and diagnosis of PC.
Introduction
Pancreatic cancer (PC) is currently the eighth leading cause of cancer-related mortality, with an estimated 266,000 deaths worldwide in 2008 [1], and remains one of the most challenging malignancies to treat. The only potentially curative therapy is surgical resection; however, approximately 70% of cases initially present with advanced disease (stage III–IV), which can-not be cured by surgery. Advanced PC has a very poor prognosis, which is attributable to absence of early symptoms and useful screening methods, with a median survival period of 7.7 months for stage III and 2.5 months for stage IV disease[2]. Moreover, the 5-year survival rates are reportedly only 21.3% for local stage, 8.9% for regional stage, and 1.8% for distant stage [3].
Several tumor-associated antigens have been evaluated as potential prognostic factors for PC, including carcinoembryonic antigen (CEA) and carbohydrate antigen (CA) 19–9. CA19-9 is the most clinically useful diagnostic marker, with sensitivity of 79%–81% and specificity of 82%–90% in symptomatic patients, but its low positive predictive value makes it a poor marker for screening [4]. In addition, enhanced computed tomography (CT) and endoscopic ultra-sound (EUS) are useful for the diagnosis of PC; however, these modalities are costly and poten-tially hazardous. Therefore, it is necessary to establish more effective screening methods for PC, particularly in the early stages of the disease. Amino acids are either ingested or endogenously synthesized and play essential physiological roles both as basic metabolites and metabolic regu-lators. Plasma free amino acids (PFAAs) present favorable targets of biomarkers because PFAA profiles are known to be influenced by metabolic variations in specific organ systems induced by specific diseases [5][6][7][8] [9]. Previous comprehensive metabolomic studies have often focused on changes in PFAA profiles [10][11][12][13]. Measurement of PFAA concentrations as possible marker of disease is also a more advantageous strategy for accurate and high-throughput analysis using mass spectroscopy than comprehensive metabolomics. Changes in PFAAs profiles are characteristic of several cancers; thus, the development of a multivariate index composed of these PFAAs could be used to better discriminate individual cancer types from healthy controls [14][15]. In the present study, we investigated the patterns of PFAA pro-files, and then developed and validated a multivariate index for detection of PC.
Materials and Methods
Ethics statement
This study was conducted in accordance with the Declaration of Helsinki and the protocol was approved by the ethics committees of the Osaka Medical Center of Cancer and Cardiovascular Diseases, Kanagawa Cancer Center, the National Cancer Center Hospital, Tokai University Hospital, Gunma Prefectural Cancer Center, JCHO Osaka Hospital, Mitsui Memorial Hospital,
salaries for authors NO, AI, SK, and HY, but did not have any additional role in the study design, data collection and analysis, decision to publish, or preparation of the manuscript. The specific roles of these authors are articulated in the‘author contributions’section.
Kameda Medical Center, and the Kanagawa Health Service Association. All subjects gave writ-ten informed consent before participation in this study. All clinical information was anon-ymized before data analysis.
Subjects
PC patients (n = 360) included in this study were recruited from the Osaka Medical Center of Cancer and Cardiovascular Diseases, the Kanagawa Cancer Center, the National Cancer Center Hospital, Tokai University Hospital, and the Gunma Prefectural Cancer Center between 2007 and 2014. Patients with chronic pancreatitis (CP; n = 28) were recruited from JCHO Osaka Hospital between 2013 and 2014, while healthy control (HC) subjects (n = 8372) who under-went comprehensive health examination were recruited from Kanagawa Health Service Associ-ation, Kameda Medical Center (Makuhari Clinic), and Mitsui Memorial Hospital between 2008 and 2010. Over 95% of consecutive PC and CP cases and HCs agreed to provide consent during the study period. PC patients with the following characteristics were excluded: (1) simultaneously diagnosed with cancer in another organ, (2) hepatitis C, and (3) under treat-ment with anti-cancer agents. CP patients with the following characteristics were excluded: (1) diagnosed with cancer and (2) hepatitis C. The inclusion criteria of HC subjects were as fol-lows: (1) no history of any cancer, and (2) no history of hepatitis C. PC stage was determined according to the Sixth Edition of the International Union Against Cancer (UICC) Tumor–
Node–Metastasis (TNM) Classification of Malignant Tumors [16]
Dataset preparation
Among the 360 PC patients, 120 PC patients obtained early in blood collection order were used as a training dataset. To prepare the HC subjects in the training data set, 600 of 8372 HC subjects were selected using propensity score matching based on gender and age distribution. The remaining 240 PC and all 28 CP patients and 7772 HC subjects were used as a validation dataset.
Body mass index (BMI)
The height and weight of all subjects were measured. BMI was calculated as weight in kilo-grams divided by height in square meters. BMI values were categorized as follows: underweight (<18.50 kg/m2), normal weight (18.50–24.99 kg/m2), overweight (25.00–29.99 kg/m2), and
obese (>30.00 kg/m2).
PFAA analysis
After overnight fasting, blood samples (5 mL) were collected from antecubital veins into tubes containing ethylenediaminetetraacetic acid disodium salt as an anticoagulant and were imme-diately (<1 min) placed in ice water or an ice-cold cooling container (Forte Grow Medical Co.,
Ltd., Tochigi, Japan). Plasma was separated from the whole blood samples by centrifugation at 3,000 rpm and 4°C for 15 min and stored at−80°C until analysis. After thawing, the plasma
(Leu), lysine (Lys), methionine (Met), ornithine (Orn), phenylalanine (Phe), proline (Pro), ser-ine (Ser), threonser-ine (Thr), tryptophan (Trp), tyrosser-ine (Tyr), and valser-ine (Val).
Statistical analysis
Mean and standard deviation (SD). The mean amino acid concentrations ± SDs were cal-culated to determine summarized PFAA profiles for both patients and controls.
Mann–WhitneyU-test. The Mann–WhitneyU-test was used to assess significant differ-ences of PFAA concentrations between patients and controls.
Receiver–operator characteristic (ROC) analysis. ROC analysis was performed to deter-mine the capabilities of uni- and multivariate analyses to discriminate between patients and controls. The patient labels were fixed as positive class labels. Therefore, an area under the ROC curve (AUC of ROC) value of<0.5 indicated that the amino acid level was lower in
patients than controls, whereas an AUC of ROC value of>0.5 indicated that it was higher. The
95% confidence intervals (95% CI) of the AUC of ROC for the discrimination of patients based on amino acid concentrations and ratios was also estimated using the methods described by Hanley and McNeil [20].
Logistic regression analysis. Multivariate logistic regression analysis was performed to estimate the model discriminating PC patient from control subjects.
Model selection of PFAA index. The PFAA index was defined as a multivariate model using PFAA concentrations as variables. Logistic regression analysis with variable selection was performed to distinguish PC patients from the HC subjects. The maximum number of explana-tory variables was restricted to less than seven to avoid potential multicollinearity. For model selection, the AUC of ROC was obtained after leave one out cross validation (LOOCV). In brief, one matched set composed of one PC patient and corresponding control subjects was omitted from the training data set, and the logistic regression model was calculated using the remaining samples to estimate coefficients for each amino acid. The function values for the left-out matched set were calculated based on this model. This process was repeated until every sample in the study data set had been left out once.
Software
All statistical and multivariate analyses were performed using MATLAB (MathWorks, Natick, MA, USA) and Prism (GraphPad Software, Inc., San Diego, CA, USA) statistical software.
Results
Characteristics of patients and control subjects
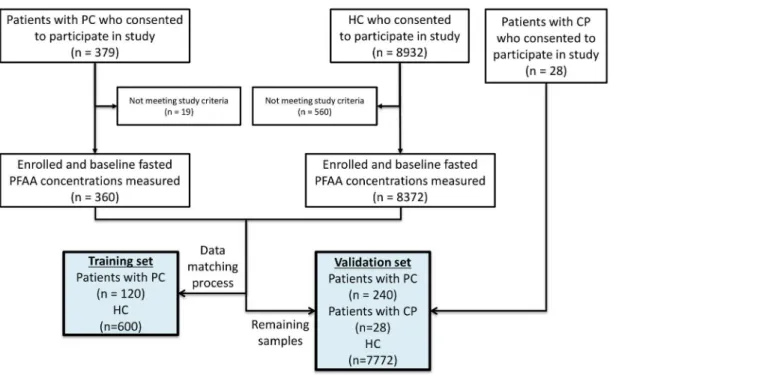
Fig 1shows an overview of this study. Fasting plasma samples were collected from the subjects
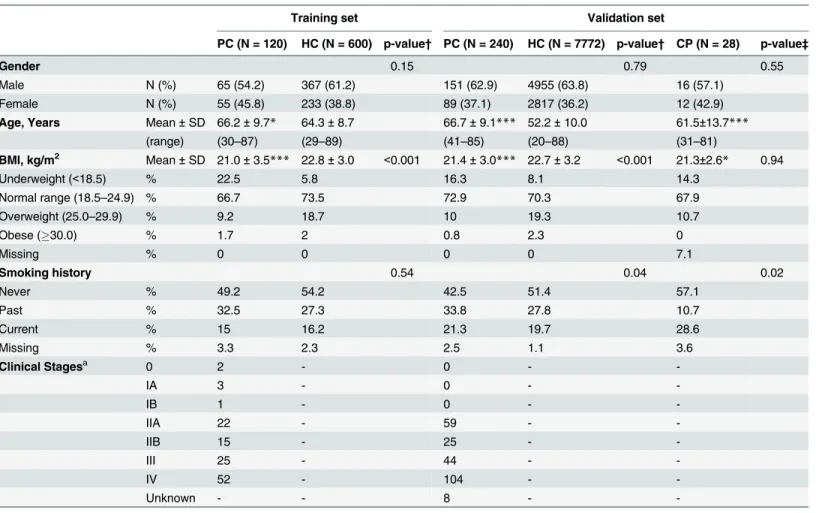
(PC patients, n = 360; CP patients, n = 28; HC subjects, n = 8372).Table 1summarizes the characteristics of PC and HC subjects included in this study. PC patients with stage 0–IIB dis-ease, as a resectable stage subgroup, accounted for 35.8% of the training set and 35.0% of the validation set.
PFAA profiles of PC patients
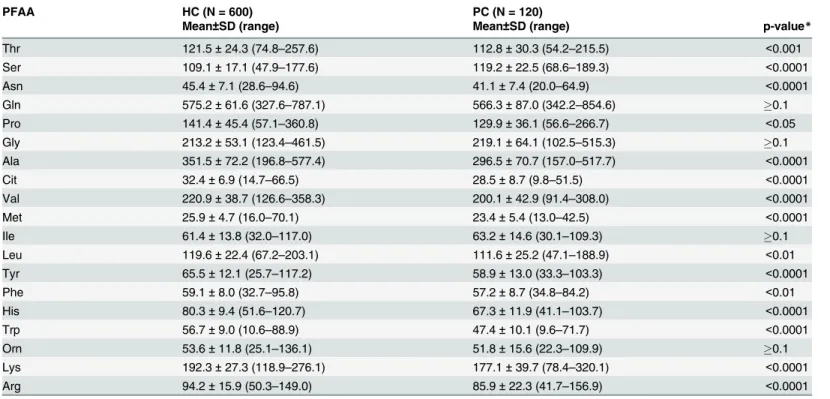
We first measured the concentrations of 19 plasma amino acids in the training set by HPLC–
ESI–MS and found significant increases in Ser concentrations and significant decreases in the concentrations of 14 amino acids (Thr, Asn, Pro, Ala, Cit, Val, Met, Leu, Tyr, Phe, His, Trp, Lys and Arg) in PC patients compared with HC subjects (p<0.05) (Table 2,S1 Fig). The
dependent on the sample size (Fig 2,S1 Table). Plasma Ser concentrations were especially higher, while Trp and His concentrations were particularly lower in PC patients compared with HC subjects. The PFAA profiles of PC patients with stage 0–IIB disease, as a resectable stage subgroup, were almost similar to those of all other PC patients.
Multivariate PFAA index
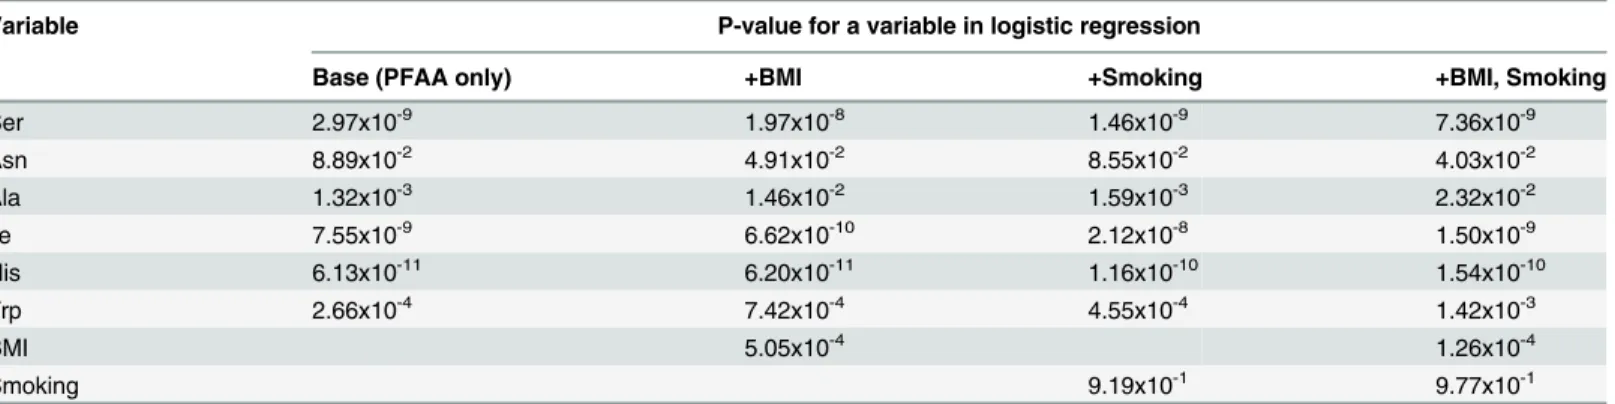
For effective detection of PC patients, we calculated optimal PFAA indices by multiple logistic regression analysis. The AUC of ROC values obtained after LOOCV in the top 50 models were virtually the same (0.88–0.89). We evaluated a representative model composed of Ser, Asn, Ile, Ala, His, and Trp as the best model (Table 3). Then, additional logistic regression analyses add-ing BMI and/or smokadd-ing history into explanatory variables were performed to estimate the effects of potential confounding. No obvious elevation of significance was observed in each amino acid when those factors were added into the model, suggesting that the changes of the plasma level of those amino acids caused by PC were independent to BMI or smoking status of subjects (Table 3).
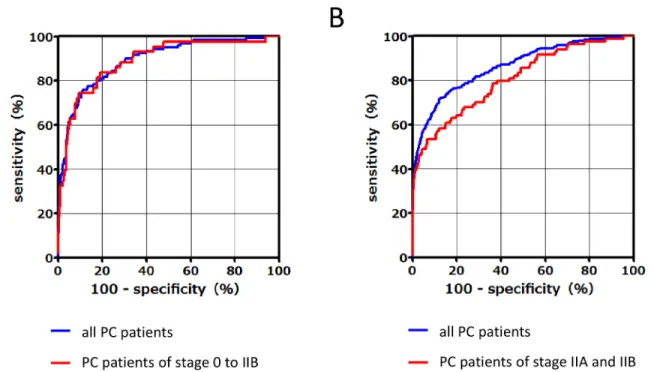
In terms of discriminating PC patients from control subjects, ROC curves for the PC vs. HC or CP subgroups between the training set and validation set were calculated (Fig 3A and 3B, respectively). In the training set, the AUCs of the PFAA indices for detection of PC patients vs. HC subjects was 0.89 (95% CI, 0.86–0.93) among all PC patients and 0.89 (95% CI, 0.83–0.95) among PC patients with stage 0–IIB disease. The sensitivities of the PFAA indices at 95% and 80% specificity were 60.0% and 82.5%, respectively, for all PC patients, and 53.5% and 83.7% for PC patients with stage 0–IIB disease, respectively (Table 4). In the validation set, the AUC of the PFAA index was 0.86 (95% CI, 0.84–0.89) for all PC patients and 0.81 (95% CI, 0.75–
0.86) for PC patients with stages IIA and IIB disease (Fig 3B). The sensitivities of the PFAA indices at a specificity of 95% and 80% were 57.5% and 76.7% for all PC patients, and 48.8% and 64.3% for PC patients with stage IIA and IIB disease (Table 4). The AUC of the PFAA
Fig 1. Summary of study design and inclusion and exclusion criteria.
index for detection of PC vs. CP was 0.87 (95% CI, 0.80–0.93) for all PC patients and the false-positive rates at 95% and 80% specificity were 7.1% and 25.0%, respectively (Table 4).S2 Fig shows box plots of PFAA index in HC, PC, and CP in the validation set.
We confirmed that the variance inflating factor (VIF), the maximum of the diagonal ele-ment of the inverse matrix of correlation coefficient matrix, of all the top 50 models not to choose the inappropriate models showing multicolinearity. All the models passed the test, that is, VIFs were less than 10. Most of all, VIF of the representative model was 1.70, suggesting that no multicolinearity occured.
Furthermore, subgroup analysis was performed for tumor stage, size, and location in the pan-creas. The AUC of the PFAA index according to tumor stage was as follows: 0.79 (95% CI, 0.72–
0.86) for stage IIA, 0.85 (95% CI, 0.77–0.92) for stage IIB, 0.88 (95% CI, 0.83–0.94) for stage III, and 0.91 (95% CI, 0.88–0.94) for stage IV (Fig 4A). The AUC of the PFAA index according to tumor size was as follows: 0.76 (95% CI, 0.66–0.86) for TS1, 0.87 (95% CI, 0.83–0.90) for TS2,
Table 1. Characteristics of PC patients and healthy controls.
Training set Validation set
PC (N = 120) HC (N = 600) p-value† PC (N = 240) HC (N = 7772) p-value† CP (N = 28) p-value‡
Gender 0.15 0.79 0.55
Male N (%) 65 (54.2) 367 (61.2) 151 (62.9) 4955 (63.8) 16 (57.1)
Female N (%) 55 (45.8) 233 (38.8) 89 (37.1) 2817 (36.2) 12 (42.9)
Age, Years Mean±SD 66.2±9.7* 64.3±8.7 66.7±9.1*** 52.2±10.0 61.5±13.7***
(range) (30–87) (29–89) (41–85) (20–88) (31–81)
BMI, kg/m2 Mean±SD 21.0±3.5*** 22.8±3.0 <0.001 21.4±3.0*** 22.7±3.2 <0.001 21.3±2.6* 0.94
Underweight (<18.5) % 22.5 5.8 16.3 8.1 14.3
Normal range (18.5–24.9) % 66.7 73.5 72.9 70.3 67.9
Overweight (25.0–29.9) % 9.2 18.7 10 19.3 10.7
Obese (30.0) % 1.7 2 0.8 2.3 0
Missing % 0 0 0 0 7.1
Smoking history 0.54 0.04 0.02
Never % 49.2 54.2 42.5 51.4 57.1
Past % 32.5 27.3 33.8 27.8 10.7
Current % 15 16.2 21.3 19.7 28.6
Missing % 3.3 2.3 2.5 1.1 3.6
Clinical Stagesa 0 2 - 0 -
-IA 3 - 0 -
-IB 1 - 0 -
-IIA 22 - 59 -
-IIB 15 - 25 -
-III 25 - 44 -
-IV 52 - 104 -
-Unknown - - 8 -
-Mann–Whitney U-test (versus HC), *p<0.05;
***p<0.001
a: Cancer stages were determined according to the Union Internationalis Contra Cancrum (UICC) TNM Classification of Malignant Tumors, 6th Edition. †Chi-square tests to test the differences between PC and HC for categorical data of gender, BMI, and smoking history.
‡Chi-square tests to test the differences between PC and CP for categorical data of gender, BMI, and smoking history.
0.91 (95% CI, 0.86–0.95) for TS3, and 0.97 (95% CI, 0.95–1.00) for TS4 (Fig 4B). The AUC of the PFAA index according to tumor location was as follows: 0.86 (95% CI, 0.82–0.90) for the pancreatic head, 0.88 (95% CI, 0.83–0.93) for the pancreatic body, and 0.90 (95% CI, 0.83–0.96) for the pancreatic tail (Fig 4C). In addition, we evaluated the correlations between PFAA index values and other biomarkers (i.e., CA19-9, CEA, and elastase-1) because the combinatorial use of multiple independent tumor markers is effective to detect PC. There were no significant corre-lations between the PFAA indices and levels of CA19-9 (r = 0.075,p= 0.247), CEA (r =−0.005, p= 0.957), or elastase-1 (r = 0.009,p= 0.351) in PC (Fig 5,S2 Table).
Discussion
Dysregulation of PFAA content in PC has been investigated in several recent studies using metabolomics or amino acid analysis [21][22][23]. However, specific PFAA profiles in PC, par-ticularly at resectable stages, remain unconfirmed because of the relatively small number of PC patients and control subjects used in these studies. Therefore, we measured fasting PFAA con-centrations in a large-scale study of 360 PC patients and 8372 control subjects to identify spe-cific PFAA profiles in PC patients as compared with a gender- and age-matched training set (PC120, HC600) (Fig 2). In addition, a similar PFAA profile was observed in patients with stage 0–IIB disease, which accounted for 35.8% of the PC patients included in this study. (Fig
2). As shown inTable 2, the plasma concentrations of several amino acids were significantly
altered in PC patients, which were in accordance with the PFAA profiles of five types of cancer reported by Miyagi et al. [14], although plasma His and Trp concentrations were particularly decreased, while Ser concentrations were notably increased (Fig 2). Furthermore, we developed a PFAA index using a training set composed of six amino acids that were clearly characteristic
Table 2. PFAA values (μmol/L) for patients with PC and healthy controls in the training set.
PFAA HC (N = 600) PC (N = 120)
Mean±SD (range) Mean±SD (range) p-value*
Thr 121.5±24.3 (74.8–257.6) 112.8±30.3 (54.2–215.5) <0.001
Ser 109.1±17.1 (47.9–177.6) 119.2±22.5 (68.6–189.3) <0.0001
Asn 45.4±7.1 (28.6–94.6) 41.1±7.4 (20.0–64.9) <0.0001
Gln 575.2±61.6 (327.6–787.1) 566.3±87.0 (342.2–854.6) 0.1
Pro 141.4±45.4 (57.1–360.8) 129.9±36.1 (56.6–266.7) <0.05
Gly 213.2±53.1 (123.4–461.5) 219.1±64.1 (102.5–515.3) 0.1
Ala 351.5±72.2 (196.8–577.4) 296.5±70.7 (157.0–517.7) <0.0001
Cit 32.4±6.9 (14.7–66.5) 28.5±8.7 (9.8–51.5) <0.0001
Val 220.9±38.7 (126.6–358.3) 200.1±42.9 (91.4–308.0) <0.0001
Met 25.9±4.7 (16.0–70.1) 23.4±5.4 (13.0–42.5) <0.0001
Ile 61.4±13.8 (32.0–117.0) 63.2±14.6 (30.1–109.3) 0.1
Leu 119.6±22.4 (67.2–203.1) 111.6±25.2 (47.1–188.9) <0.01
Tyr 65.5±12.1 (25.7–117.2) 58.9±13.0 (33.3–103.3) <0.0001
Phe 59.1±8.0 (32.7–95.8) 57.2±8.7 (34.8–84.2) <0.01
His 80.3±9.4 (51.6–120.7) 67.3±11.9 (41.1–103.7) <0.0001
Trp 56.7±9.0 (10.6–88.9) 47.4±10.1 (9.6–71.7) <0.0001
Orn 53.6±11.8 (25.1–136.1) 51.8±15.6 (22.3–109.9) 0.1
Lys 192.3±27.3 (118.9–276.1) 177.1±39.7 (78.4–320.1) <0.0001
Arg 94.2±15.9 (50.3–149.0) 85.9±22.3 (41.7–156.9) <0.0001
*p values were calculated using the Mann–Whitney U-test.
of the amino acid profile in PC. We demonstrated that this index can be used to efficiently dif-ferentiate not only progressive PC but also operable PC, from stage IIA and IIB disease in an independent validation set (Table 4). Moreover, we also showed that the PFAA index hardly detects chronic pancreatitis (Table 4).
PFAA profiles of PC patients have been reported in several previous studies, among which, several amino acid profiles were similar, although there were some obvious discrepancies [21] [22][23] For example, we found a significant increase in plasma Ser concentrations in PC,
Fig 2. PFAA profiles of PC patients.The results of receiver–operator characteristic (ROC) curve analysis of PFAA profiles in the training set (120 PC and matching 600 HC). Axes show the AUC of ROC for each amino acid to discriminate patients from healthy controls. Black bold lines indicate the point where the AUC of ROC = 0.5.
doi:10.1371/journal.pone.0132223.g002
Table 3. Independence between PFAA used in the index and potential confounders such as BMI and smoking history.
Variable P-value for a variable in logistic regression
Base (PFAA only) +BMI +Smoking +BMI, Smoking
Ser 2.97x10⁻⁹ 1.97x10⁻⁸ 1.46x10⁻⁹ 7.36x10⁻⁹
Asn 8.89x10⁻² 4.91x10⁻² 8.55x10⁻² 4.03x10⁻²
Ala 1.32x10⁻³ 1.46x10⁻² 1.59x10⁻³ 2.32x10⁻²
Ile 7.55x10⁻⁹ 6.62x10⁻¹⁰ 2.12x10⁻⁸ 1.50x10⁻⁹
His 6.13x10⁻¹¹ 6.20x10⁻¹¹ 1.16x10⁻¹⁰ 1.54x10⁻¹⁰
Trp 2.66x10⁻⁴ 7.42x10⁻⁴ 4.55x10⁻⁴ 1.42x10⁻³
BMI 5.05x10⁻⁴ 1.26x10⁻⁴
Smoking 9.19x10⁻¹ 9.77x10⁻¹
while this trend was not observed in other studies. In addition, there were discrepancies in Asn, Gln, Met, Ile, Phe, Leu, and Pro levels. In contrast, these previous studies commonly reported a significant decrease in Thr concentrations, while changes in Arg, Cit, and Trp concentrations were not determined in one study, and significant decreases in these amino acids in PC were observed in our study as well as two others. We considered several reasons for these discrepan-cies. First, these previous studies included relatively small numbers of subjects compared with the present study, which included the largest number of subjects to date. In this study, the PFAA index was robust and the AUC barely decreased even with the validation set because it was developed based on a training set with an adequate sample size. Second, differences between our results and those of other studies may have occurred because of variations in
Fig 3. ROC curves of the PFAA index of PC patients compared with those of healthy controls in the training set (120 PC and matching 600 HC) (A) and the validation set (240 PC and 7772 HC) (B).
doi:10.1371/journal.pone.0132223.g003
Table 4. Discrimination performance of PFAA index.
PFAA indexa
Specificity (%) 95 80
Training set: AUC 0.89
(95% confidence interval) (0.86–0.93)
Sensitivity (%) 60.0 82.5
Sensitivity for stage 0 to IIB PC (%) 53.5 83.7
Validation set: AUC 0.86
(95% confidence interval) (0.84–0.89)
Sensitivity (%) 57.5 76.7
Sensitivity for stage IIA and IIB PC (%) 48.8 64.3
False-positive rate in CP (%) 7.1 25.0
a: Following PFAAs was used as variables: Ser, Asn, Ile, Ala, His, and Trp.
sample preparation conditions and analytical methods. Third, PFAA profiles exhibit diurnal fluctuations [24][25][26] and change according to circadian rhythms [27][28] because they are largely dependent on recent meals, even among healthy subjects [24][25][26][29]. Further-more, leaving collected blood samples at room temperature is known to alter plasma amino acid concentrations [30]. To overcome this confounding factor, all participating facilities in this study used the same protocol, in which blood was drawn in the morning before breakfast after overnight fasting and the collected samples were quickly cooled to prevent alterations in amino acid concentrations because of enzymatic reactions. Therefore, the acquired samples were of high quality and the extracted data accurately reflects in vivo amino acid profiles dur-ing fastdur-ing. Furthermore, determination of amino acid concentrations usdur-ing HPLC–ESI–MS in this study was calculated not as a semiquantified value using metabolomics as in previous stud-ies but rather as directly quantified absolute concentrations by creating a calibration curve from the peak area of standard references of each amino acid [19]. These measurements were highly accurate and precise to guarantee validation, reproducibility, and limited daily error [19]. Thus, the findings of this study may more clearly demonstrate profile characteristics in comparison with those demonstrated by previous studies. The use of multivariate analysis of
Fig 4. ROC curves of the PFAA index with different tumor stages, sizes, and locations.(A) ROC curves of the PFAA index in stage IIA (red), stage IIB (pink), stage III (orange), and stage IV (yellow–green), respectively. (B) ROC curves in TS1 (red), TS2 (pink), TS3 (orange), and TS4 (yellow–green), respectively. TS12.0 cm, 2.0 cm<TS24.0 cm, 4.0 cm<TS36.0 cm, and TS4>6.0 cm. (C) ROC curves in the pancreatic head (red), body (pink), and tail (orange), respectively.
doi:10.1371/journal.pone.0132223.g004
Fig 5. Correlation of PFAA index and other biomarkers (CA19-9, CEA, and elastase 1).The dotted line shows the cut-off of each biomarker or PFAA index. For data analysis, the upper normal limits of CA19-9, CEA, and elastase-1 were defined as 37 U/mL, 5 ng/dL, and 300 ng/dL, respectively. There were no significant correlations between each biomarker and the PFAA index.
markers for PC has also been reported [23,31]. For example, Kobayashi et al. [23] constructed a multiple logistic regression model using a 43-case training set with the concentrations of four metabolites selected as variables from data comprehensively semiquantified from metabolite concentrations by GC–MS. Meanwhile, of the four selected metabolites, xylitol is a food-derived substance that is present at very low concentrations in healthy individuals [32][33]. However, it was unclear whether these concentrations are physiologically maintained at certain levels in vivo. Furthermore, Leichtle et al. [31] constructed a combined metabolite panel to dis-criminate PC from CP and HC using aspartic acid (Asp) and CA19-9 as variables. However, the plasma Asp concentration tends to be comparatively low and an analytical variability of
>25%, as reported elsewhere [34]. In the present study, the PFAA index was constructed with
only amino acids with moderate to high plasma concentrations to secure measurement preci-sion. Therefore, we believe that the PFAA index offers a high discriminatory ability without being influenced by measurement errors. Because amino acid analysis is widely used clinically, the PFAA index is likely to be quickly verified and we suspect its use will be widespread in the near future. Meanwhile, genetic, racial, and geographical elements may also be factors impact-ing these differences, which should be clarified in future research.
There are several possible mechanisms that may influence PFAA profiles in cancer patients. First, previous studies have demonstrated marked metabolic changes in local cancer, including varied amino acid profiles and different expression of amino acid transporter in cancer cells compared with healthy cells [10][35]. For example, L-neutral amino acid transporter 1 (LAT1) is strongly expressed in PC cells [36]. With respect to Ser, de novo Ser biosynthesis is upregu-lated in cancer cells and Ser acts as an allosteric activator of pyruvate kinase isozyme M2 [37]. This characteristic may be related to factors that also increase plasma Ser concentrations. A second possible mechanism is the induction of remote organ metabolic changes caused by fac-tors emitted from cancer cells. For example, Luo et al. [38] reported that HMGB-1 secreted by cancer cells caused the breakdown of remote muscle tissue proteins into amino acids, some of which leak out into the blood, thereby altering the PFAA profile. A third possible mechanism is involvement of the immune system. For example, plasma concentrations of Trp have been correlated with common metabolic changes, both in our study and a previous study that inves-tigated Trp levels in five different types of cancer [14]. Expression of indoleamine 2,3-dioxy-genase (IDO), which is involved in the kynurenine metabolic pathway, is induced in various types of cancer (cancer cells or immune cells) and known to play an important role in immu-nosuppression [39]. IDO is also known to be overexpressed in PC cells [40]. Thus, several points regarding the mechanisms behind changes in PFAA profiles in PC remain unclear; thus, further research is needed to clarify these issues.
systemic amino acid profiles together with changes in plasma BCAA concentrations in the pre-cancerous phase or extremely early stages of PC [41]. Therefore, the observed changes in PFAA profiles of the patients with PC lesions, which could be diagnosed via imaging and considered for resection in our study, may also have been caused by systemic metabolic changes.
Currently, CA19-9 is the most widely used marker to predict PC treatment outcome and post-treatment prognosis [42]. However, CA19-9 is not synthesized by patients classified as Lewis blood group Lea-b-, which accounts for 10% of cases; therefore, this marker may not be elevated in some patients, even those with advanced stage PC [43]. CEA is widely used as a prognostic marker in gastrointestinal cancers; however, its sensitivity and specificity for PC are poor [44]. The pancreatic enzyme elastase-1, which is thought to increase with pancreatitis caused by pancreatic duct stenosis, has been demonstrated as an effective early diagnostic marker [45]. In the present study, we found no correlations between the PFAA index and CA19-9, CEA, or elastase-1 levels (Fig 5). Thus, when used concurrently, the PFAA index with CA19-9, CEA, or elastase-1 may complement each other in order to more accurately detect PC. However, CA19-9 and elastase-1 were not measured in the HC subjects in this study. Thus, to confirm the comparison of accurate discriminatory ability and synergetic effect with these markers, further studies are needed. The discriminatory ability of the PFAA index was shown to be high even for small pancreatic tumors of TS-1 according to subgroup analysis
(ROC_AUC = 0.76) (Fig 4B). We also found that the PFAA index was not dependent on the location of the pancreatic tumor (Fig 4C). Although general abdominal ultrasonography is used to diagnose PC in the initial phase, it is difficult to image small tumors or lesions in the pancre-atic tail or uncinate process using this modality. Our results suggested that the proposed PFAA index developed in this study offers the same sensitivity without depending on tumor location. Therefore, combinatorial use of abdominal ultrasonography and the PFAA index may be a good marker to increase the detection rate of lesions of the pancreatic tail and uncinate process. In this study, the training set and validation set were divided chronologically. As a result, no early cases of stage I or less were included in the validation set that occurred chronologically later in time. The fact that the discriminatory ability of the PFAA index for early stage cases of stage I or less remains unknown is a limitation of this study. However, this study was cross-sec-tional; therefore, we cannot exclude the possibility of reverse causation or residual confounding from complications such as diabetes or indigestion. In our future work, we plan to demonstrate the clinical significance of our proposed PFAA index and confirm its ability to discriminate the early stages of PC and the association of the PFAA index with the complications of PC.
Conclusions
In this study, we successfully developed a novel PFAA index using fasting PFAA profiles to dis-criminate PC patients from control subjects, and validated the index in an independent large validation set, although the study was cross-sectional and the reversal causality, including symptoms associated with PC or complications, cannot be ruled out. Additional studies with larger patient cohort that include patients with early stage PC are also required. However, we believe the PFAA index will help to improve the early detection of PC in patients with asymp-tomatic and resectable stage disease.
Supporting Information
S1 Fig. Box plot of amino acid values (μmol/L) for patients with pancreatic cancer
(n = 120) and healthy controls (n = 600).Box plots display the 10th, 25th, 50th (median), 75th, and 90th percentiles. P values were calculated by the Mann-Whitney test.
S2 Fig. Box plots of PFAA index in patients with pancreatic cancer (n = 240), pancreatitis (n = 28), and healthy controls (n = 7772).Box plots display the 10th, 25th, 50th (median), 75th, and 90th percentiles. Kruskal-Wallis test with Dunn’s post-test, PC versus HC, CP,
p<0.001.
(DOCX)
S1 Table. AUCs of ROC of each amino acid concentration for discrimination of cancer patients from controls.
(DOC)
S2 Table. Pearson's coefficient of correlations (r-values) for relationship between PFAA index and other biomarkers with different stages.
(DOC)
Acknowledgments
We wish to thank Ms. Naoko Kageyama, Dr. Toshimi Mizukoshi, and Dr. Hiroshi Miyano for the amino acid analysis, and Ms. Mariko Takasu and Dr. Nahoko Shikata for help with data acquisition, and Dr. Takashi Daimon (Hyogo College of Medicine) for helpful discussions of statistical analysis. We also thank all members of the medical staff of Osaka Medical Center of Cancer and Cardiovascular Diseases, the Kanagawa Cancer Center, the National Cancer Center Hospital, Tokai University Hachioji Hospital, the Gunma Prefectural Cancer Center, JCHO Osaka Hospital, Mitsui Memorial Hospital, Kameda Medical Center, and the Kanagawa Health Service Association for sample collection.
Author Contributions
Conceived and designed the experiments: NF NO SK HY KK. Performed the experiments: NF MU NH K. Shimada K. Shiraishi NS TI MY KK. Analyzed the data: NO SK AI. Wrote the paper: NF NO SK KK.
References
1. Jemal A, Bray F, Ferlay J. Global Cancer Statistics. CA Cancer J Clin. 2011; 61: 69–90. doi:10.3322/ caac.20107PMID:21296855
2. Greene FL, Page DL, Fleming ID, Fritz AG, Balch CM, Haller DG, et al, editor. AJCC Cancer Staging Manual. 6th ed. New York: Springer-Verlag; 2002.
3. Simard EP, Ward EM, Siegel R, Jemal A. Cancers with increasing incidence trends in the United States: 1999 through 2008. CA Cancer J Clin. 2012; 62: 118–128. doi:10.3322/caac.20141PMID: 22281605
4. Ballehaninna UK, Chamberlain RS. The clinical utility of serum CA 19–9 in the diagnosis, prognosis and management of pancreatic adenocarcinoma: An evidence based appraisal. J Gastrointest Oncol. 2012; 3: 105–119. doi:10.3978/j.issn.2078-6891.2011.021PMID:22811878
5. Fischer JE, Rosen HM, Ebeid AM, James JH, Keane JM, Soeters PB. The effect of normalization of plasma amino acids on hepatic encephalopathy in man. Surgery. 1976; 80: 77–91. PMID:818729
6. Holm E, Sedlaczek O, Grips E. Amino acid metabolism in liver disease. Curr Opin Clin Nutr Metab Care. 1999; 2: 47–53. PMID:10453330
7. Hong SY, Yang DH, Chang SK. The relationship between plasma homocysteine and amino acid con-centrations in patients with end-stage renal disease. J Ren Nutr. 1998; 8:34–39. PMID:9724828
8. Felig P, Marliss E, Ohman JL, Cahill GF, Haven N. Plasma Amino Acid Levels in Diabetic Ketoacidosis. Diabetes. 1970; 19: 727–729. PMID:4990780
10. Hirayama A, Kami K, Sugimoto M, Sugawara M, Toki N, Onozuka H, et al. Quantitative metabolome profiling of colon and stomach cancer microenvironment by capillary electrophoresis time-of-flight mass spectrometry. Cancer Res. 2009; 69: 4918–4925. doi:10.1158/0008-5472.CAN-08-4806PMID: 19458066
11. Wang TJ, Larson MG, Vasan RS, Cheng S, Rhee EP, McCabe E, et al. Metabolite profiles and the risk of developing diabetes. Nat Med. 2011; 17: 448–453. doi:10.1038/nm.2307PMID:21423183
12. Cheng S, Rhee EP, Larson MG, Lewis GD, McCabe EL, Shen D, et al. Metabolite profiling identifies pathways associated with metabolic risk in humans. Circulation. 2012; 125: 2222–2231. doi:10.1161/ CIRCULATIONAHA.111.067827PMID:22496159
13. Kimberly WT, Wang Y, Pham L, Furie KL, Gerszten RE. Metabolite profiling identifies a branched chain amino acid signature in acute cardioembolic stroke. Stroke. 2013; 44:1389–1395. doi:10.1161/ STROKEAHA.111.000397PMID:23520238
14. Miyagi Y, Higashiyama M, Gochi A, Akaike M, Ishikawa T, Miura T, et al. Plasma free amino acid profil-ing of five types of cancer patients and its application for early detection. PLoS One. 2011; 6:e24143. doi:10.1371/journal.pone.0024143PMID:21915291
15. Ihata Y, Miyagi E, Numazaki R, Muramatsu T, Imaizumi A, Yamamoto H, et al. Amino acid profile index for early detection of endometrial cancer: verification as a novel diagnostic marker. Int J Clin Oncol. 2014; 19:364–372. doi:10.1007/s10147-013-0565-2PMID:23700142
16. Sobin L WC, editor. TNM Classification of Malignant Tumours, Sixth Edition. New York: Wiley-Liss.; 2002.
17. Shimbo K, Oonuki T, Yahashi A, Hirayama K, Miyano H. Precolumn derivatization reagents for high-speed analysis of amines and amino acids in biological fluid using liquid chromatography/electrospray ionization tandem mass spectrometry. Rapid Commun Mass Spectrom. 2009; 23:1483–1492. doi:10. 1002/rcm.4026PMID:19350529
18. Shimbo K, Yahashi A, Hirayama K, Nakazawa M, Miyano H. Multifunctional and highly sensitive precol-umn reagents for amino acids in liquid chromatography/tandem mass spectrometry. Anal Chem. 2009; 81:5172–5179. doi:10.1021/ac900470wPMID:19480430
19. Shimbo K, Kubo S, Harada Y, Oonuki T, Yokokura T, Yoshida H, et al. Automated precolumn derivati-zation system for analyzing physiological amino acids by liquid chromatography/mass spectrometry. Biomed Chromatogr. 2010; 24: 683–691. doi:10.1002/bmc.1346PMID:19830681
20. Hanley A, Mcneil J,. The Meaning of Use of the Area under a Receiver Characteristic (ROC) curve. Radiology. 1982: 143:29–36. PMID:7063747
21. Schrader H, Menge BA, Belyaev O, Uhl W, Schmidt WE, Meier JJ. Amino Acid Malnutrition in Patients With Chronic Pancreatitis and Pancreatic Carcinoma. 2013; 38: 416–421.
22. Vissers YLJ, Dejong CHC, Luiking YC, Fearon KCH, von Meyenfeldt MF, Deutz NEP. Plasma arginine concentrations are reduced in cancer patients: evidence for arginine deficiency? Am J Clin Nutr. 2005; 81:1142–1146. PMID:15883440
23. Kobayashi T, Nishiumi S, Ikeda A, Yoshie T, Sakai A, Matsubara A, et al. A novel serum metabolomics-based diagnostic approach to pancreatic cancer. Cancer Epidemiol Biomarkers Prev. 2013; 22:571– 579. doi:10.1158/1055-9965.EPI-12-1033PMID:23542803
24. Fernstrom D, Rand M, Wuriman J, Munro N, Davidson S. Diurnal variations in plasma concentrations of tryptophan, tryosine, and other neutral amino acids: effect of dietary protein intake. 1979; 32:1912– 1922.
25. Ashley V, Barclay V, Sc M, Chauffard F. Plasma amino acid responses in humans to evening meals of differing nutritional composition. Am J Clin Nutr. 1982; 36(1): 143–153. PMID:7091024
26. Nasset ES, Heald FP, Calloway DH, Margen S, Schneeman P. Amino Acids in Human Blood Plasma after Single Meals of Meat, Oil Sucrose and Whiskey. J Nutr. 1979; 109(4):621–30. PMID:571014
27. Riggio O, Merli M, Pièche U, Romiti A, Pasqualetti P, Coppola A, et al. Circadian rhythmicity of plasma
amino acid variations in healthy subjects. Recenti Prog Med. 1989; 80: 591–593. PMID:2623324
28. Tsai PJ, Wu WH, Huang PC. Circadian variations in plasma neutral and basic amino acid concentra-tions in young men on an ordinary Taiwanese diet. J Formos Med Assoc. 2000; 99:151–157. PMID: 10770030
29. Nishioka M, Imaizumi A, Ando T, Tochikubo O. The overnight effect of dietary energy balance on post-prandial plasma free amino acid (PFAA) profiles in Japanese adult men. PLoS One. 2013; 8:e62929. doi:10.1371/journal.pone.0062929PMID:23667542
31. Leichtle AB, Ceglarek U, Weinert P, Nakas CT, Nuoffer J-M, Kase J, et al. Pancreatic carcinoma, pan-creatitis, and healthy controls: metabolite models in a three-class diagnostic dilemma. Metabolomics. 2013; 9:677–687. PMID:23678345
32. Shetty HU, Holloway HW, Rapoport SI. Capillary gas chromatography combined with ion trap detection for quantitative profiling of polyols in cerebrospinal fluid and plasma. Anal Biochem. 1995; 224:279–85. PMID:7710082
33. Huck JHJ, Verhoeven NM, Struys EA, Salomons GS, Jakobs C, van der Knaap MS. Ribose-5-phos-phate isomerase deficiency: new inborn error in the pentose phosRibose-5-phos-phate pathway associated with a slowly progressive leukoencephalopathy. Am J Hum Genet. 2004; 74:745–751. PMID:14988808
34. Brauer R, Leichtle AB, Fiedler GM, Thiery J, Ceglarek U. Preanalytical standardization of amino acid and acylcarnitine metabolite profiling in human blood using tandem mass spectrometry. Metabolomics. 2010; 7:344–352.
35. Borgan E, Sitter B, Lingjærde OC, Johnsen H, Lundgren S, Bathen TF, et al. Merging transcriptomics and metabolomics—advances in breast cancer profiling. BMC Cancer. 2010; 10:628. doi:10.1186/ 1471-2407-10-628PMID:21080935
36. Kaira K, Sunose Y, Arakawa K, Ogawa T, Sunaga N, Shimizu K, et al. Prognostic significance of L-type amino-acid transporter 1 expression in surgically resected pancreatic cancer. Br J Cancer. 2012; 107:632–638. doi:10.1038/bjc.2012.310PMID:22805328
37. Chaneton B, Hillmann P, Zheng L, Martin ACL, Oliver DK, Chokkathukalam A, et al. Serine is a natural ligand and allosteric activator of pyruvate kinase M2. Nature. 2012; 491: 458–462. doi:10.1038/ nature11540PMID:23064226
38. Luo Y, Yoneda J, Ohmori H, Sasaki T, Shimbo K, Eto S, et al. Cancer usurps skeletal muscle as an energy repository. Cancer Res. 2014; 74: 330–340. doi:10.1158/0008-5472.CAN-13-1052PMID: 24197136
39. Munn DH, Mellor AL. Indoleamine 2,3-dioxygenase and tumor-induced tolerance. J Clin Invest. 2007; 117: 1147–1154. PMID:17476344
40. Witkiewicz A, Williams TK, Cozzitorto J, Durkan B, Showalter SL, Yeo CJ, et al. Expression of indolea-mine 2,3-dioxygenase in metastatic pancreatic ductal adenocarcinoma recruits regulatory T cells to avoid immune detection. J Am Coll Surg. 2008; 206: 849–854; discussion 854–856. doi:10.1016/j. jamcollsurg.2007.12.014PMID:18471709
41. Mayers JR, Wu C, Clish CB, Kraft P, Torrence ME, Fiske BP, et al. Elevation of circulating branched-chain amino acids is an early event in human pancreatic adenocarcinoma development. Nat Med.; 2014;1–11. doi:10.1038/nm.3456PMID:24398945
42. Ballehaninna UK, Chamberlain RS. Serum CA 19–9 as a Biomarker for Pancreatic Cancer-A Compre-hensive Review. Indian J Surg Oncol. 2011; 2:88–100. doi:10.1007/s13193-011-0042-1PMID: 22693400
43. Tempero MA, Uchida E, Takasaki H. Relationship of carbohydrate antigen 19–9 and Lewis antigens in pancreatic cancer. Cancer Res 1987; 47: 5501–5503. PMID:3308077
44. Nazli O, Bozdag AD, Tansug T, Kir R, Kaymak E. The diagnostic importance of CEA and CA 19–9 for the early diagnosis of pancreatic carcinoma. Hepatogastroenterology. 47:1750–1752. PMID: 11149048