NEUCIR SZINWELSKI
DIVERSIDADE DE GRILOS (ORTHOPTERA: GRYLLOIDEA):
ASPECTOS ECOL ´OGICOS E METODOL ´OGICOS
Tese apresentada `a Universidade Fede-ral de Vi¸cosa, como parte das exigˆen-cias do Programa de P´os-gradua¸c˜ao em Entomologia, para obten¸c˜ao do t´ıtulo de
Doctor Scientiae.
VI ¸COSA
Ficha catalográfica preparada pela Seção de Catalogação e Classificação da Biblioteca Central da UFV
T
Szinwelski, Neucir, 1980-
S998d Diversidade de grilos (Orthoptera: Grylloidea) : aspectos 2013 ecológicos e metodológicos / Neucir Szinwelski. – Viçosa,
MG, 2013.
x, 62f. : il. ; (algumas color.) ; 29cm.
Orientador: Carlos Frankl Sperber.
Tese (doutorado) - Universidade Federal de Viçosa. Inclui bibliografia.
1. Sucessão ecológica. 2. Biodiversidade. 3. Florestas - Reprodução. 4. Álcool. 5. Ácido desoxirribonucleico. 6. Amostragem. 7. Armadilhas para insetos. 8. Grilo. I. Universidade Federal de Viçosa. Departamento de
Entomologia. Programa de Pós-Graduação em Entomologia.
II. Título.
NEUCIR SZINWELSKI
DIVERSIDADE DE GRILOS (ORTHOPTERA: GRYLLOIDEA):
ASPECTOS ECOL ´OGICOS E METODOL ´OGICOS
Tese apresentada `a Universidade Fede-ral de Vi¸cosa, como parte das exigˆen-cias do Programa de P´os-gradua¸c˜ao em Entomologia, para obten¸c˜ao do t´ıtulo de
Doctor Scientiae.
APROVADA: 18 de janeiro de 2013.
Prof. Ricardo Ildefonso de Campos Prof. Og Francisco Fonseca de Souza (Coorientador)
Profa. Karla Suemy Clemente Yotoko Prof. Marcos Gon¸calves Lhano
`
A minha m˜ae, Nilsa Szinwelski Cardias, que me deu uma vida digna onde eu pudesse crescer confiando que tudo ´e poss´ıvel.
`
Agradecimentos
Ao Grande Esp´ırito pela vida. `
A Universidade Federal de Vi¸cosa e ao programa de P´os-Gradua¸c˜ao em Entomologia pela excelente forma¸c˜ao profissional. Ao CNPq pela bolsa concedida. Ao CNPq/SISBIOTA (563360/2010-0) e FAPEMIG (APQ-01478-11) pelo financia-mento de minha pesquisa.
`
A minha m˜ae, dona Nilsa, exemplo de mulher e de m˜ae. Obrigado por acreditar que eu seja t˜ao bom quanto vocˆe pensa. Obrigado pela ajuda na triagem dos grilos.
Aos meus irm˜aos, especialmente ao La´ercio, por me ajudar nas coletas dos grilos.
`
A minha esposa Izana Stamm Brol pelo apoio e fortaleza nos momentos dif´ıceis e pelas alegrias do casamento. Obrigado pela compreens˜ao, afeto, carinho e amor. Obrigado pela ajuda nas coletas, por me compreender e estar ao meu lado sempre. Obrigado pelos excelentes momentos vividos ao seu lado e pelos que, com certeza, viveremos.
`
A Iracema L. S. Brol e Romildo Brol, por me acolherem em vossa casa de bra¸cos abertos. Obrigado por existirem e serem t˜ao generosos comigo. Obrigado pelo empr´estimo do carro para a realiza¸c˜ao das coletas e pela ajuda na captura e triagem dos grilos.
Ao Edison Zefa, grande professor e amigo, a quem tenho profundo apre¸co e admira¸c˜ao. Seu incentivo foi sempre importante!
e pessoal. Valeu!
Ao professor Jos´e Henrique Schoereder, pela amizade, coorienta¸c˜ao, pelas discuss˜oes da tese, das an´alises estat´ısticas e pelos diversos conselhos e conversas. Obrigado por me “salvar” do Carlos diversas vezes. Valeu gremista.
Ao Marcos Gon¸calves Lhano. Simplesmente um grande e inesquec´ıvel amigo. ´
E sempre uma alegria trocar ideias contigo. `
A Karla S. C. Yotoko pela amizade, por me ajudar nos artigos e me ensinar uma forma mais sucinta de escrever.
Ao Ricardo I. Campos por me atender em todos os momentos e pelas diversas discuss˜oes e ideias para trabalhos futuros.
`
A Marinˆez Isaac Marques pela amizade intensa constru´ıda em t˜ao pouco tempo.
Ao Og Francisco Fonseca de Souza, pelo pux˜oes de orelha, pelas “prensas”, pelos questionamentos e por me ensinar a pensar como cientista. N˜ao sei se aprendi, mas estou tentando.
Ao Ricardo Solar pela ajuda nos artigos e pela ajuda no inglˆes.
Ao Pedro G. S. B. Dias, pela grande amizade, sinceridade e ajuda. Espero poder conviver mais com vocˆe a partir de agora.
Ao Cassiano Souza Rosa, por me incentivar no uso do Linux. Atrav´es de seu incentivo conheci um mundo maravilhoso e com muitas possibilidades.
`
Ao Marcelo Ribeiro Pereira e Maria Luiza Fernandes pela identifica¸c˜ao dos grilos coletados para composi¸c˜ao do cap´ıtulo quatro.
`
A Fabiene Maria de Jesus pela ajuda na impress˜ao e distribui¸c˜ao da tese.
Ao Eraldo Lima, pelas aulas de LATEX que possibilitaram diagramar essa
tese facilmente. `
A todos os professores com quem convivi e pude trocar ideias sobre ciˆencia e demais assuntos.
`
A todos os membros do Laborat´orio de Orthoptera. Foi fant´astico compar-tilhar minha vida com vocˆes. Obrigado tamb´em por comparcompar-tilhar a vida de vocˆes comigo. Foi um presente divino ter conhecido todos vocˆes.
`
A toda a galera do SISBIOTA, com quem pude aprender muito. `
A todos os amigos e inimigos, que me ajudam (ou ajudaram) e que torcem (ou torceram) por mim. OBRIGADO.
Aos que esqueci de mencionar, minhas sinceras desculpas e meu profundo agradecimento.
“Agrade¸co imensamente, sem esquecer o oportuno e benquisto gesto, o favor, o pr´estimo, a t´abua de salva¸c˜ao me atirada. N˜ao ou-sando discutir a qualidade da madeira daquela, gostaria, contudo, de n˜ao me sentir devedor de um barco inteiro quando me insinuam a lembran¸ca”.
Sum´
ario
Resumo vii
Abstract ix
1 Introdu¸c˜ao Geral 1
2 Cap´ıtulo um 9
2.1 Effects of forest regeneration on crickets: Evaluating environmental drivers in a 300-years’ chronosequence . . . 9
3 Cap´ıtulo dois 23
3.1 Resource addition improves cricket diversity? . . . 23
4 Cap´ıtulo trˆes 35
4.1 Ethanol fuel improves arthropod capture in pitfall traps and preserves DNA . . . 35
5 Cap´ıtulo quatro 48
5.1 Ethanol fuel improves pitfall traps through rapid sinking and death of captured organisms . . . 48
RESUMO
SZINWELSKI, Neucir, D.Sc., Universidade Federal de Vi¸cosa, janeiro de 2013.
Diversidade de grilos (Orthoptera: Grylloidea): Aspectos ecol´ogicos e
metodol´ogicos. Orientador: Carlos Frankl Sperber. Coorientadores: Jos´e
Hen-rique Schoereder e Og Francisco Fonseca de Souza.
ABSTRACT
SZINWELSKI, Neucir, D.Sc., Universidade Federal de Vi¸cosa, January, 2013.
Cricket diversity (Orthoptera, Grylloidea): Ecological and methodological
aspects. Adviser: Carlos Frankl Sperber. Co-advisers: Jos´e Henrique Schoereder
and Og Francisco Fonseca de Souza.
1
Introdu¸c˜
ao Geral
As atividades humanas est˜ao promovendo ampla degrada¸c˜ao ambiental, em escala e velocidade sem precedentes (Brooks et al., 2002). Por esse motivo, os ci-entistas est˜ao concentrando esfor¸cos na investiga¸c˜ao e determina¸c˜ao de fatores que afetam a diversidade de esp´ecies, de modo a identificar os meios para assegurar a conserva¸c˜ao da diversidade restante. N˜ao tem faltado financiamentos para pesquisas que testem hip´oteses mecanicistas e que avaliam correla¸c˜oes entre a diversidade de esp´ecies e vari´aveis ambientais, em diversas escalas. Tem havido um grande esfor¸co de pesquisa dedicado ao estudo da biodiversidade, especialmente no Estado de S˜ao Paulo (Joly et al., 2010, Programa Biota FAPESP). Esse esfor¸co, recentemente, foi ampliado para todo o pa´ıs, atrav´es do Programa SISBIOTA (Escobar, 2010). O Programa SISBIOTA, em particular, evidencia a necessidade de avaliar correla¸c˜oes entre a diversidade de esp´ecies e vari´aveis ambientais, em diferentes escalas espaciais e temporais.
A sucess˜ao ecol´ogica ou regenera¸c˜ao florestal ocorre em ´areas que passaram por algum tipo de perturba¸c˜ao, seja em ambientes anteriormente desprovidos de vida (sucess˜ao prim´aria), ou ambientes anteriormente ocupados (sucess˜ao secund´aria), que sofreram algum tipo de dist´urbio natural ou antr´opico (Begon et al., 2006). O cessa-mento desses dist´urbios permitem que as plantas se estabele¸cam de forma gradual, promovendo tamb´em a recoloniza¸c˜ao da fauna, prevenindo que esp´ecies suscept´ıveis sejam extintas (Wright & Muller-Landau, 2006). Habitats em regenera¸c˜ao podem ser considerados ref´ugios para popula¸c˜oes amea¸cadas ou atuar como stepping-stone, facilitando o fluxo gˆenico entre habitats desconectados (Myers et al., 2000). Entre-tanto, a manuten¸c˜ao de esp´ecies em florestas em regenera¸c˜ao depende diretamente da produtividade prim´aria desta. Sem recursos e condi¸c˜oes adequadas, muitas es-p´ecies n˜ao conseguem sobreviver. ´E por esse motivo que altera¸c˜oes na abundˆancia, diversidade e na estrutura da comunidade s˜ao associadas a mudan¸cas que ocorrem durante o processo de regenera¸c˜ao florestal. Espera-se, portanto, que a medida em que o tempo de regenera¸c˜ao aumenta, aumente a capacidade de suporte do ambiente, e este apresente maior densidade e diversidade.
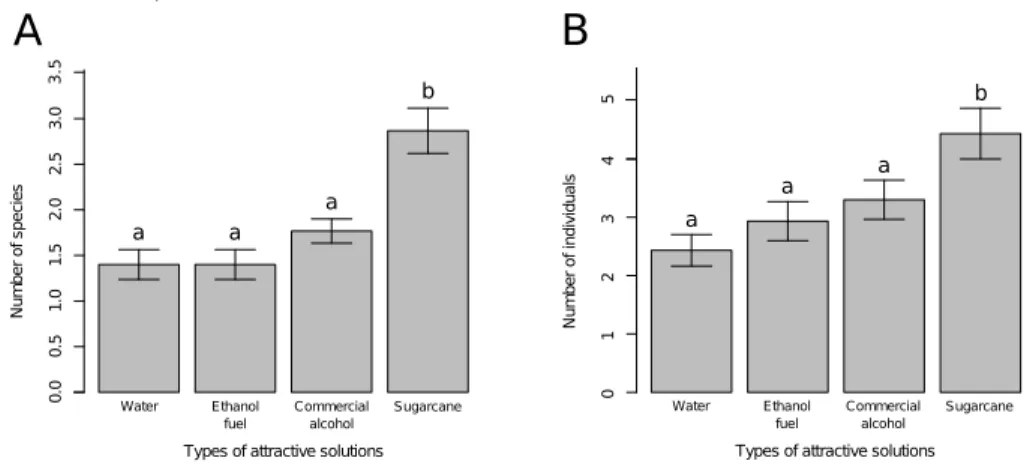
A disponibilidade de recurso ´e outro importante mecanismo que pode moldar a distribui¸c˜ao dos organismos no ecossistema (Tiegs et al., 2008; Lessard et al., 2011). A resposta da diversidade `a disponibilidade de recursos pode ser represen-tada por uma curva em forma de sino (Godfray & Lawton, 2001). Em ambientes com baixa disponibilidade de recursos deve ocorrer baixa diversidade, que pode ser ex-plicada pela intensa competi¸c˜ao intra- ou interespec´ıfica (Ricklefs & Schluter, 1993). Diminui¸c˜ao na diversidade tamb´em pode ser observada quando h´a grande quanti-dade de recursos devido, principalmente, a competi¸c˜ao intra- e interespec´ıfica (Rick-lefs & Schluter, 1993; Schmid, 2002) e/ou pela alta press˜ao exercidas por predadores (Ara´ujo et al., 2007). Em faixas intermedi´arias de disponibilidade de recursos o ambiente pode suportar grande diversidade de organismos, devido ao aumento no n´umero de indiv´ıduos e com isso no n´umero de esp´ecies (Preston, 1962), ou por per-mitir maior coexistˆencia entre as esp´ecies (Godfray & Lawton, 2001). Esse padr˜ao de curva em forma de sino, entretanto, ainda ´e controverso, especialmente porque a res-posta dos organismos `a disponibilidade de recursos ´e muito heterogˆenea (Mittelbach et al., 2001; Payne et al., 2005).
No segundo cap´ıtulo avaliou-se, atrav´es de experimento manipulativo, como a disponibilidade de recursos afeta a riqueza de esp´ecies de grilos. Testou-se a hip´otese de que o aumento na quantidade de recurso promoveria aumento na na riqueza de esp´ecies devido ao afrouxamento das rela¸c˜oes competitivas, alteraria a composi¸c˜ao de esp´ecies devido ao aparecimento de esp´ecies raras, e reduziria a igualdade da comunidade, tamb´em chamada de equidade (Magurran, 2004). Esse cap´ıtulo est´a sendo preparado para ser submetido ao peri´odicoOrganisms Diversity and Evolution. As metodologias de coletas utilizadas para estudar/entender os mecanismos determinantes da diversidade podem afetar o modo com que se estima a diversi-dade de um determinado ambiente. Isso porque, em geral, os cientistas n˜ao fazem um censo e sim uma estimativa da diversidade que pode estar distante ou pr´oxima da verdade. Essa distˆancia em rela¸c˜ao ao mundo real est´a diretamente ligada aos m´etodos de amostragem e an´alise utilizados. Metodologias de coletas inadequadas ou insuficientes, podem, portanto, impedir que se detecte padr˜oes sobre a riqueza de esp´ecies, ou que se utilize os dados coletados para outros estudos.
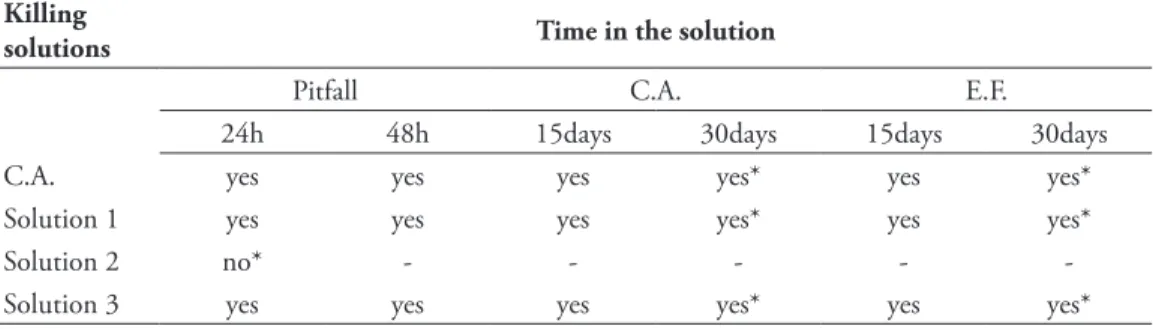
aqu-osa, com um pouco de detergente para quebrar a tens˜ao superficial da ´agua. Essa solu¸c˜ao, entretanto, al´em de degradar rapidamente os organismos coletados e seu DNA, possibilitava que muitos indiv´ıduos escapassem da armadilha, prejudicando a amostragem. Em 2003, Sperber et al. propuseram a substitui¸c˜ao dessa solu¸c˜ao aqu-osa por um solu¸c˜ao alco´olica, composta de 80% de ´alcool comercial, 10% de formol e 10% de glicerina. Essa t´ecnica se mostrou mais eficaz que a anterior, pois al´em de capturar maior n´umero de indiv´ıduos e esp´ecies, tamb´em conservava os indiv´ıduos intactos por mais tempo. Al´em disso, essa solu¸c˜ao n˜ao atrai, sendo eficaz para estu-dos ecol´ogicos cujo objetivo ´e amostrar a fauna do local. Entretanto, com a utiliza¸c˜ao dos organismos coletados para outros estudos, de outras ´areas da ciˆencia, como por exemplo biologia molecular, essa solu¸c˜ao mostrou-se ineficaz porque degrada o DNA rapidamente. Al´em disso, muitos grilos comuns na serrapilheira, como Eneoptera e
Gryllus, que voam muito bem, ainda eram pouco amostrados com a utiliza¸c˜ao dessa solu¸c˜ao. Pensando nessas duas ineficiˆencias dessa solu¸c˜ao, foi proposto a utiliza¸c˜ao de uma nova solu¸c˜ao mort´ıfera para a amostragem de grilos de serrapilheira.
No terceiro cap´ıtulo dessa tese, foi proposto a utiliza¸c˜ao do ´alcool combust´ıvel, sem dilui¸c˜ao, como solu¸c˜ao matadora para amostragem de grilos. Foi testado a eficiˆencia do ´alcool combust´ıvel como solu¸c˜ao matadora, comparando com a solu¸c˜ao proposta por Sperber et al. (2003), e uma solu¸c˜ao alternativa, composta de ´alcool comercial e glicerina, sem a adi¸c˜ao de formol. Foi testado tamb´em a capacidade dessas trˆes solu¸c˜oes de preservar adequadamente o DNA dos indiv´ıduos capturados e por quanto tempo. Esse cap´ıtulo foi publicado, em 2012, no peri´odico internacional
Zookeys.
Referˆ
encias
Ara´ujo, A. P. A., Galbiati, C., & DeSouza, O. (2007). Neotropical termite species (Isoptera) richness declining as resource amount rises: Food or enemy-free space constraints? Sociobiology, 49(2), 1–14.
Begon, M., Townsend, C. R., & Harper, J. L. (2006). Ecology: From individuals to ecosystems (4 ed.). Oxford: Blackwell Publishing Ltd.
Brooks, T. M., Mittermeier, R. A., Mittermeier, C. G., Fonseca, G. A. B., Rylands, A. B., Konstant, W. R., Flick, P., Pilgrim, J., Oldfield, S., Magin, G., & Hilton-Taylor, C. (2002). Habitat loss and extinction in the hotspots of biodiversity.
Conservation Biology, 16(4), 909–923.
Clements, F. E. (1936). Nature and structure of the climax. The Journal of Ecology,
24(1), 252–284.
Coleman, B. D. (1981). On random placement and species-area relations. Mathe-matical Biosciences, 54, 191–215.
Dahl, F. (1896). Vergleichende Untersuchungen ¨uber die Leben- sweise wirbelloser Aasfresser. Sitzber. K¨onigl. Preuß. Akad. Wiss., 1, 11–24.
Escobar, H. (2010). Programa paulista de estudo da biodiversidade ganha vers˜ao federal.
Godfray, H. C. J. & Lawton, J. H. (2001). Scale and species number. Trends in Ecology and Evolution, 16(7), 400–404.
Huber, F., Moore, T. E., & Loher, W. (1989). Cricket behavior and neurobiology. New York: Cornell University Press.
Joly, C. A., Rodrigues, R. R., Metzger, J. P., Haddad, C. F. B., Verdade, L. M., Oliveira, M. C., & Bolzani, V. S. (2010). Biodiversity conservation research, train-ing, and policy in S˜ao Paulo. Science, 328(5984), 1358–1359.
Lessard, J.-P., Sackett, T. E., Reynolds, W. N., Fowler, D. a., & Sanders, N. J. (2011). Determinants of the detrital arthropod community structure: the effects of temperature and resources along an environmental gradient. Oikos, 120(3), 333– 343.
Magurran, A. E. (2004). Measuring biological diversity. Oxford - UK: Black-Well Publishing.
Mittelbach, G. G., Steiner, C. F., Scheiner, S. M., Gross, K. L., Reynolds, H. L., Waide, R. B., Willig, M. R., Dodson, S. I., & Gough, L. (2001). What is the observed relationship between species richnessand productivity? Ecology, 82(9), 2381–2396.
Myers, N., Mittermeier, R. A., Mittermeier, C. G., Fonseca, G. A. B., Kent, J., & Da-Fonseca, G. A. B. (2000). Biodiversity hotspots for conservation priorities.
Nature,403, 853–858.
Otte, D. & Alexander, R. D. (1983). The Australian crickets (Orthoptera: Grylli-dae). Philadelphia: Academy of Natural Sciences Philadelphia.
Payne, L. X., Schindler, D. E., Parrish, J. K., & Temple, S. A. (2005). Quantifying spatial pattern with evenness indices. Ecological Applications, 15(2), 507–520. Preston, F. W. (1962). The canonical distribution od commenness and rarity: Part I. Ecology, 43(2), 185–215.
Ricklefs, R. E. & Schluter, D. (1993). Species diversity in ecological communities. In R.E. Ricklefs & D. Schluter (Eds.), Species diversity in ecological communities
chapter Species di, (pp. 350–363). Chicago - USA: University of Chicago Press, Chicago - USA.
Schmid, B. (2002). The species richness-productivity controversy. 2Trends in Ecol-ogy and Evolution,17(3), 113–114.
Southwood, T. R. E. & Henderson, P. A. (2000). Ecological Methods (3 ed.). Wiley-Blackwell.
Sperber, C. F., Vieira, G. H., & Mendes, M. H. (2003). Aprimoramento da amostragem de grilos de serapilheira (Orthoptera: Gryllidae) por armadilha.
Neotropical Entomology,32(4), 733–735.
Szinwelski, N., Rosa, C. S., Schoereder, J. H., Mews, C. M., & Sperber, C. F. (2012). Effects of forest regeneration on crickets: Evaluating environmental drivers in a 300-year chronosequence. International Journal of Zoology, 2012, 1–13.
Tiegs, S. D., Peter, F. D., Robinson, C. T., Uehlinger, U., & Gessner, M. O. (2008). Leaf decomposition and invertebrate colonization responses to manipulated litter quantity in streams. Journal of the North American Benthological Society, 27(2), 321–331.
Tilman, D. (1982). Resource competition and community structure. Princeton: Princeton University Press.
Wright, S. J. & Muller-Landau, H. C. (2006). The future of tropical forest species.
2
Cap´ıtulo um
2.1
Effects of forest regeneration on crickets: Evaluating
en-vironmental drivers in a 300-years’ chronosequence
How to cite this article
Neucir Szinwelski, Cassiano S. Rosa, Jos´e H. Schoereder, Carina M. Mews, and Carlos F. Sperber. (2012). Effects of Forest Regeneration on Crickets: Evaluating
Environmental Drivers in a 300-Year Chronosequence. International Journal
Hindawi Publishing Corporation International Journal of Zoology Volume 2012, Article ID 793419,13pages doi:10.1155/2012/793419
Research Article
Effects of Forest Regeneration on Crickets: Evaluating
Environmental Drivers in a 300-Year Chronosequence
Neucir Szinwelski,1, 2Cassiano S. Rosa,3, 4Jos´e H. Schoereder,5 Carina M. Mews,2and Carlos F. Sperber1, 2, 3
1Postgraduate Programme in Entomology, Department of Entomology, Federal University of Vic¸osa, 36570000 Vic¸osa, MG, Brazil 2Laboratory of Orthoptera, Department of General Biology, Federal University of Vic¸osa, 36570000 Vic¸osa, MG, Brazil 3Postgraduate Programme in Ecology, Department of General Biology, Federal University of Vic¸osa, 36570000 Vic¸osa, MG, Brazil 4Faculty of Engineering, State University of Minas Gerais-UEMG, 35930314 Jo˜ao Monlevade, MG, Brazil
5Laboratory of Community Ecology, Department of General Biology, Federal University of Vic¸osa, 36570000 Vic¸osa, MG, Brazil
Correspondence should be addressed to Neucir Szinwelski,[email protected]
Received 1 March 2012; Revised 9 July 2012; Accepted 10 July 2012
Academic Editor: Thomas Iliffe
Copyright © 2012 Neucir Szinwelski et al. This is an open access article distributed under the Creative Commons Attribution License, which permits unrestricted use, distribution, and reproduction in any medium, provided the original work is properly cited.
We evaluated the relation of cricket species richness and composition with forest regeneration time, evaluating canopy and litter depth as environmental drivers. Effects of forest patch area, nearest distance to the 300-year patch, cricket abundance, sampling sufficiency, and nestedness were also evaluated. We collected 1174 individuals (five families, 19 species). Species richness increased asymptotically with regeneration time and linearly with canopy cover and litter depth. Canopy cover increased linearly, while litter depth increased asymptotically. Richness was not affected by patch area and nearest distance to the 300-year patch. Richness increased with cricket abundance, and this explanation could not be distinguished from regeneration time, evidencing collinearity of these two explanatory variables. Rarefaction curve slopes increased with regeneration time. Species composition differed among patches, with no nested pattern. We suggest that regeneration and consequent increases in canopy and litter promote recovery of cricket biodiversity, abundance, and changes in species composition. We conclude that the recovery of cricket diversity involves an increase along the spatial scale of complementarity, together with a change in species composition.
1. Introduction
Forest disturbances may range from simple alterations, such as light gap formation resulting from a toppled tree, to mas-sive damage associated with large storms, hurricanes, fires, and human activities [1]. In tropical ecosystems, human activities—such as logging, mineral extraction, agriculture, and urbanization [2,3]—are largely responsible for forest loss. These activities have caused losses in biodiversity [4] by reducing large areas of old-growth forest to small isolated forest patches. Forest patches are more affected by natural hazards than pristine, large forest areas [5] and are thus more susceptible to further reductions in diversity.
The abandonment of habitat patches, with the subse-quent cessation of human activity, allows for forest regenera-tion and potential biodiversity recolonizaregenera-tion [1,6]. Forest
landscapes are therefore often comprised of patches with different regeneration times [7–9].
Forest regeneration can reduce or eliminate threats to biodiversity [10] by provisioning suitable habitats for endangered species to prevent them from becoming extinct. Forest patches can function as habitat refuges, preserving threatened populations [11], and edge habitats can maintain both old-growth and secondary forest species [12]. Further-more, forest patches may act as “stepping-stone” habitats that facilitate gene flow among otherwise disconnected forest patches [4]. However, the suitability of secondary forests for maintaining populations depends on the availability of adequate resources and conditions within the habitats of target species [13].
2 International Journal of Zoology
environmental changes that occur during the regeneration process [14]. Several contradictory hypotheses have been proposed [14] to explain various patterns of diversity and species composition in succession gradients: (i) diversity should increase over succession time as the structural com-plexity of the ecosystem increases [15], or due to facilitation [16]; (ii) all species are present at the beginning of succession and several species may be eliminated by competition [17], resulting in decreased species richness during the succession process; (iii) because of intermediate disturbance effects, species diversity increases from early succession stages to a maximum in mid-succession and decreases during late succession [16,18–20]; (iv) there is no general pattern of diversity during forest succession [21]; (v) given a uniform environment, with a fixed area, an increase in individuals leads to an increase in species [22].
In the case of litter crickets, the first hypothesis is possibly the most appropriate. Crickets respond to litter disturbance and trampling [23] and changes in environmen-tal conditions, particularly humidity [24]. Given that early regeneration stages represent high-disturbance conditions— low humidity and low structural heterogeneity [25]—low cricket species richness is expected during such periods; therefore, higher richness is likely to be observed as the forest regenerates.
Our aim was to test if cricket species richness and composition responded to regeneration time and to evaluate potential local environmental drivers of species richness, that is, canopy and litter depth. We evaluated eventual landscape configuration effects, namely, forest patch area and nearest distance to the 300-year patch, and the eventual effects of cricket abundance on cricket species richness. Furthermore, we evaluated sampling sufficiency and evaluated if species composition differences could be explained by nestedness.
2. Methods
2.1. Study Region. The study was conducted in the Foz do Iguac¸u municipality (25◦32′S, 54◦35′E, 195 m above sea
level), Paran´a State, in October 2008. Vegetation is composed of tropical semideciduous forest and ombrophilous mixed forest, within the Atlantic Rainforest biome [26]. The climate in this region can be categorized as humid subtropical mesothermal, with a mean annual temperature of 18–20◦C
and a mean annual rainfall of 1600 mm. The dry and rainy seasons range from April to June and October to January, respectively. Humidity is permanently high, seldom recorded below 80% even during the driest period [27].
At the time of this sampling, the canopy layer was already homogeneously closed, with most leaves completely developed. Therefore, the canopy layer was close to its maxi-mum productivity, which is attained during the rainy season (N. Szinwelski, personal observations). During occasional observations in the dry season (May and June 2012), we did not observe strong canopy deciduousness.
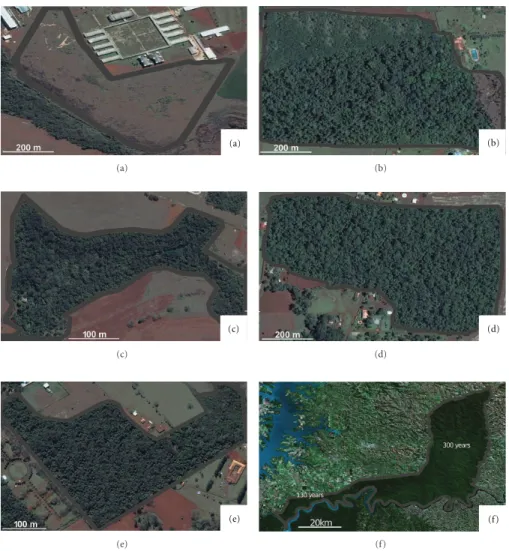
2.2. Forest Disturbance History. We sampled a chronose-quence of seven patches (Figure 1), ranging from zero to
300 years of regeneration (Table 1), from partial to total forest clearing. The patch with zero years of regeneration (Figure 1(a)) was totally cleared. The six-year patch was partially deforested (upper left corner, Figure 1(b)) and had suffered complete burning. The 15-year patch was almost entirely deforested, except for a narrow forest strip along the river which transects the patch longitudinally (Figure 1(c)). The 35- and 70-year patches suffered almost complete deforestation (Figures 1(d)-1(e)). The 130-year patch suffered partial deforestation. There is no recorded history of logging or human disturbance in the 300-year forest patch.
The patches of 0 to 70 years (Figures1(a)to1(e)) are presently private property; their ages were obtained from information provided by present owners and the descendants of former owners. The 130-year forest patch (Figure 1(f)), located in the Iguac¸u River Basin on the western side of Iguac¸u National Park [29,30], was dated with information from the Paraguayan War that occurred between 1864 and 1870 [31]. During the war, the current site of the 130-year forest patch was deforested to build a road and to house troops, as reported by oral histories of local inhabitants. Presently, the 130-year patch is part of the Iguac¸u National Park.
Although we assumed an age of 300 years for the oldest forest area (Figure 1(f), 300 years), this is probably an underestimation. The administration of the Iguac¸u National Park considers the area, located in the Floriano River Basin, in the eastern region of Iguac¸u National Park [29,30], to be untouched wilderness (Marina Xavier and Apol ˆonio Rodrigues, researchers at the Brazilian Institute for the Environment (Instituto Brasileiro do Meio Ambiente (IBAMA), personal observations). The Floriano River Basin is considered the only completely protected river basin in Southern and Southeastern Brazil [32] and was declared a world natural heritage site by UNESCO in 1986 [30].
Although presently the 130- and 300-year study areas belong to the same forest patch in Iguac¸u National Park (Figure 1(f)), until 2002 these areas were separated by the Colono Road [30].
2.3. Testing the Assumption. To evaluate the effects of forest regeneration, we estimated regeneration using a continuous, rather than categorical (e.g., initial, intermediate, and late succession) approach. To achieve this, we used only the seven forest patches in the studied region for which precise knowledge of regeneration time was available. An increase in the number of sampled patches would only be possible if we included patches with inexact regeneration time data, which would jeopardize our approach.
International Journal of Zoology 3
(a)
(a)
(b)
(b)
(c)
(c)
(d)
(d)
(e)
(e)
(f)
(f)
Figure1: Study areas, with the following years of regeneration: (a) zero; (b) six; (c) fifteen, (d) thirty-five; (e) seventy; (f) 130 and 300 years (Iguac¸u National Park). Source: [28]. For additional information, seeTable 1.
Table1: Characteristics of the sampled forest patches. Geographical coordinates correspond to the central point in each patch.
Regeneration
time (years) Geographical coordinate Area (ha)
Distance to 300-year patch
0 25◦28′05′′–54◦34′12′′ 21.29 25
6 25◦34′19′′–54◦30′41′′ 44.25 10
15 25◦27′51′′–54◦34′40′′ 6.35 25
35 35◦35′02′′–54◦30′06′′ 36.09 8
70 25◦33′03′′–54◦33′16′′ 6.66 15
130 25◦37′54′′–54◦27′38′′ 35000 45
4 International Journal of Zoology
sorted and stored in 80% ethanol. Voucher specimens were deposited in the Laboratory of Orthoptera, part of theMuseu Regional de Entomologia da Universidade Federal de Vic¸osa
(UFVB).
2.4. Potential Local Environmental Drivers. To evaluate potential environmental drivers of the cricket community, we measured litter and canopy structure. Litter depth was measured with a ruler at each trap. Mean litter depth was based on 50 samples per unit area.
To evaluate canopy cover, we took photographs at the intersection of each set of traps along the transect in each area, using a digital camera (CANON EOS 350-D 350-Digital Rebel) with a fish-eye lens (Canon EF 15 mm f/2.8), positioned 1 m above ground level. The percentage of canopy cover was calculated using the program Gap Light Analyzer (GLA) [34]. For evaluation purposes photographs were converted into black and white, so that the amount of white pixels could be calculated (as a direct estimate of light penetration and an inverse estimate of cover) using GLA software. Canopy cover was calculated as the mean of the 10 samples from each area.
2.5. Landscape Configuration Effects. To evaluate if landscape configuration affected cricket species richness, we measured forest patch area and nearest distance to the 300-year patch using satellite images [28] and land title deed data provided by the land owners. We considered the distance to the 300-year patch as an estimate of species dispersal distance, because in addition to being the most preserved forest patch, it is also the largest continuous forest area in the region (135,000 ha + 50,000 ha of the 130-year patch, to which it is currently connected).
2.6. Data Analysis
2.6.1. Testing the Assumption. To test the assumption that cricket species richness increased with forest regeneration time, we adjusted generalized linear models (GLMs) with Poisson’s errors, with accumulated species number per patch as response variable and regeneration time as an explanatory variable (n=7,Figure 1). We used Chi-square
(χ2) test for Poisson’s distributions and the F test when
over- or under-dispersion was corrected, as recommended by Crawley [35] and Zuur et al. [36]. To evaluate the significance of the explanatory variable, we used stepwise backward model simplification, using thePvalue to exclude nonsignificant variables. Adjusted models were subjected to residual analyses, to evaluate the adequacy of the model. We detected evidence of nonlinearity that was not adequately modeled by including a quadratic term in a polynomial regression. We therefore adjusted nonlinear regression (nls
procedure inR) with asymptotic models and evaluated the adequacy of the adjusted models by visual inspection of the predicted and observed values. Comparison of Akaike’s information criterion (AIC) of the models was not available because the linear model presented overdispersion; therefore it did not provide this index.
2.6.2. Testing the Potential Local Environmental Drivers. To evaluate the potential local environmental drivers of cricket response to regeneration time, we tested the hypothesis that the variation in cricket species richness with regeneration time was driven by canopy cover and litter depth. We adjusted separate GLMs with cricket species richness and potential local environmental drivers as response variables. To avoid pseudoreplication, we considered the forest patches as our sampling unit (n=7;Figure 1), using the mean values
for litter depth and canopy cover per forest patch. For models with species richness as the response variable, we used Poisson’s errors, and corrected for under- or overdispersion when necessary. For models with litter depth as the response variable, we used normal errors, since depth is a continuous variable. For models with canopy cover percentage as the response variable, we used binomial errors corrected for continuous data, since canopy cover is a proportion.
To evaluate the significance of the explanatory variable, we used stepwise backward model simplification, using the P value to exclude nonsignificant variables. Adjusted models were subjected to residual analyses, to evaluate model adequacy. If an environmental variable was an effective driver of the response of richness to regeneration time, we expected that richness would be affected by this variable and that the variable would correlate to regeneration time.
We detected evidence for nonlinearity in the relationship of litter depth with regeneration time. This could not be adequately modeled by including a quadratic term in a polynomial regression, so we adjusted nonlinear regression (nlsprocedure inR) with asymptotic models and evaluated the adequacy of the adjusted models by visual inspection of the predicted and observed values. We used AIC values to choose the most adequate model.
2.6.3. Testing Landscape Configuration Effects. To evaluate if landscape configuration explained the response of cricket species richness to forest regeneration time, we adjusted GLMs with species richness as the response variable, regen-eration time as the explanatory variable, and patch area and nearest distance to the 300-year patch as covariables, adjusted logistic multiple regression with Poisson’s errors, and adjusted for under- or overdispersion as necessary. The complete model to evaluate the effects of landscape configuration included all interaction terms. To evaluate the significance of the explanatory variable, we used stepwise backward model simplification, using thePvalue to exclude nonsignificant variables. Adjusted models were subjected to residual analyses to evaluate model adequacy.
International Journal of Zoology 5
relationships included all interaction terms. To evaluate the significance of the explanatory variable, we used stepwise backward model simplification, using thePvalue to exclude nonsignificant variables. Adjusted models were subjected to residual analyses to evaluate model adequacy.
Cricket abundance was estimated by the total number of individuals captured in the 50 traps of each studied patch. Eventual significance of abundance effects on species richness was interpreted as passive sampling [37], where patches with more individuals presented larger species richness.
All univariate analyses were done within theR environ-ment [38].
2.6.5. Testing for Sampling Sufficiency. To evaluate sampling sufficiency for estimating the species richness of each patch, we used individual-based rarefaction analysis [39], compar-ing species richness accumulation curves among patches by visual assessment of overlapping 95% confidence intervals. Rarefaction analysis was done in EstimateS 7.5 [40].
2.6.6. Testing for Effects of Regeneration Time on Cricket Species Composition. To evaluate if species composition dif-fered among forest patches, we considered each group of five pitfall traps as our sampling unit (n=70), to evaluate if the variation within patches was larger than the variation among patches. We assumed that species composition differed among patches when sampling units of a particular patch were more similar to each other than to those from different forest patches. To analyze the similarity among samples, we used nonmetric multidimensional scaling (NMDS), running 10,000 permutations and using the Bray-Curtis distance to explore differences in community structure across the patches.
We used the stress value to assess the robustness of the NMDS solution, as stress values above 0.2 indicate plots that may be unreliable [41]. Analysis of similarity (ANOSIM) was used to test if there were significant differences in multivariate community structure among forest patches. The null hypothesis was that there would be no differences among forest patches. ANOSIM is a nonparametric permutation test for similarity matrices analogous to analysis of variance (ANOVA) [41]. We used similarity percentage analysis (SIMPER) to evaluate which species are more relevant to group forming. All multivariate analyses were undertaken using PAST software [42].
2.6.7. Nestedness Analyses. To evaluate if species composition differences could be explained by nestedness, that is, if cricket species in forest patches with lower species richness were a subset of the species present in higher-richness sites [43,
44], we measured the degree of nestedness of the cricket assemblages from the seven forest patches using the “vegan” library [45] of theRenvironment [38]. We calculated the NODF (nestedness metric based on overlap and decreasing fill) statistics [46], running 10,000 simulations using the “r1” method, which uses both row and column constraints as recommended by Ulrich et al. [44]. The NODF statistics vary
0 50 100 150 200 250 300
4 6 8 10 12
Regeneration time (years)
C
rick
et species r
ic
hness
Figure2: Response of cricket species richness to regeneration time. Species richness increased asymptotically up to 130 years of regeneration. Nonlinear regression with Gaussian errors: y =
11.293−8.081(−0.003∗x);F
2,4=16.16;P=0.012.
from 0 to 100, with 100 representing maximum nestedness [47].
3. Results
3.1. Cricket Fauna. We collected 1174 individuals belonging to five families and 19 species. The richest and most abun-dant family was Phalangopsidae (12 species: 983 individu-als), followed by Trigoniidae (two species: 107 individuindividu-als), Eneopteridae (two species: nine individuals), Gryllidae (two species: 70 individuals), and Mogoplistidae, which had only one species and five individuals (Table 2). Crickets of the Gryllidae family occurred only in areas with zero years of regeneration (open habitat) and were absent from the remaining areas, while five species of Phalangopsidae were exclusive to older forests (Table 2).
3.2. Testing the Assumption. Using linear regression, we detected that cricket species richness increased with forest regeneration time (overdispersion;F1,5=22.37;P=0.005), but there was strong evidence of nonlinear relation. The rela-tionship between species richness and regeneration time was adequately modeled by the following asymptotic equation:
y=11.293−8.081(−0.003∗x). (1)
Therefore, cricket species richness increased asymptoti-cally with regeneration time until stabilizing at 130 years of regeneration (nonlinear regression;Figure 2).
3.3. Local Environmental Drivers. Cricket species richness increased with percentage of canopy cover (χ2
=3.97;P =
0.046; Figure 3) and litter depth (χ2
= 8.15;P = 0.004;
Figure 4).
6 International Journal of Zoology
Table2: Cricket taxa, number of individuals per forest patch, and taxa contribution to species composition groups forming in SIMPER analysis (taxon alone (A), percent value (%), and taxon order (B)). Taxa were ordered according to contribution (B). Taxa not assigned to described species or genus received number codes. All unidentified crickets belong to taxa that had not been previously collected and are therefore new to science.
Taxons Forest patches years Taxa contribution
0 6 15 35 70 130 300 Total A % B
Ectecoussp.1 — 85 33 34 157 147 194 650 32.82 44.78 1
Phoremiasp.1 — — — 85 5 5 10 105 8.43 56.28 2
Gryllus assimilis 49 — — — — — — 49 6.86 65.64 3
Lernecasp.1 6 45 30 — 23 — — 104 6.36 74.32 4
Larandasp.1 — 10 16 27 10 12 4 79 4.82 80.9 5
Vanzoliniellasp.1 — 9 24 23 8 — — 64 4.19 86.61 6
Aracambysp.1 — — — 3 15 8 10 36 2.36 89.83 7
Aracambysp.2 — — — — — 14 17 31 2.33 93.02 8
Miogryllussp.1 5 16 — — — — — 21 1.89 95.6 9
Adelosgryllus rubricephalus — — 2 2 1 1 1 7 0.62 96.45 10
Eneoptera surinamensis — — 5 — — — — 5 0.61 97.29 11
Mogoplistidae Genus 3 sp.1 — — — 1 1 2 1 5 0.47 97.93 12
Phalangopsidae Genus 1 sp.1 — — — — — 3 1 4 0.39 98.46 13
Tafaliscasp.1 — — — 2 1 — 1 4 0.34 98.94 14
Phalangopsidae Genus 2 sp.2 — — — — — 1 2 3 0.24 99.27 15
Eidmanacris tridentata — — — — — 1 1 2 0.17 99.5 16
Endecoussp.1 — — — — — 1 1 2 0.16 99.73 17
Zucchiellasp.1 — — — — 2 — — 2 0.13 99.91 18
Eidmanacris bidentata — — — 1 — — — 1 0.06 100 19
Individuals 60 165 110 178 223 195 243 1174 — — —
Species 3 5 6 9 10 11 12 19 — — —
84 86 88 90 92 94
5 6 7 8 9 10 11 12
Canopy cover (%)
C
rick
et species r
ic
hness
Figure3: Response of cricket species richness to canopy cover. Species richness increased linearly with canopy cover. Linear regression with Poisson’s errors:y=e(−5.285+0.083∗x);χ2
=3.97;P=
0.046.
adequately modeled (F2,4=8.78;P=0.034;Figure 6) by the following equation:
y=e(0.894+0.328∗x). (2)
3.4. Landscape Configuration Effects. Neither patch area nor nearest distance to the 300-year patch had any effect on
1 2 3 4 5
4 6 8 10 12
Litter depth (cm)
C
rick
et species r
ic
hness
Figure 4: Response of cricket species richness to litter depth. Species richness increased linearly with liter depth. Linear regres-sion with Poisson’s errors:y=e(0.894+0.328∗x);χ2
=8.15;P=0.004.
cricket species richness (χ2
=3.24;P=0.07 andχ2
=0.25;
P=0.61, resp.).
3.5. Effects of Cricket Abundance on Cricket Species Richness.
International Journal of Zoology 7 84 86 88 90 92 94
0 50 100 150 200 250 300
Regeneration time (years)
Canop
y c
o
ve
r (%)
Figure5: Response of canopy cover to regeneration time. Canopy cover increased linearly with regeneration time. Linear regression with binomial errors:y=100∗e(1.778+0.003∗x)/1+e(1.778+0.003∗x);F
1,4=
54.24;P=0.018.
0 50 100 150 200 250 300
1 2 3 4 5
Regeneration time (years)
Litt
er depth (cm)
Figure6: Response of litter depth to regeneration time. Litter depth increased asymptotically up to 130 years of regeneration. Nonlinear regression with Gaussian errors:y=e(0.894+0.328∗x);F
2,4=8.78;P=
0.034.
versusYabundance;F1,5=6.92P=0.068;Yabundance + timeversusYtimeF1,4=0.11;P=0.75). When compared to the null model, however, both explanatory variables significantly affected cricket species richness (Yabundance
versus Y1;F1,5 =5.52;P = 0.045 andY timeversusY1;
F1,5=22.37;P=0.005). Therefore, cricket species richness per patch could be explained both by regeneration time and cricket abundance.
3.6. Sampling Sufficiency. Although we detected no statistical difference in rarefaction curves among forest patches, the slopes of the rarefaction curves increased with regeneration time (Figure 7). The bias of the estimated species richness increased, in correlation with the regeneration time. In the most recent forest patches (zero to 15 years of regeneration), species richness was fully sampled, while the rarefaction curves in all remaining, older, patches showed that we did not reach the actual species richness. Therefore, the rarefaction curves reinforce the pattern of increasing species richness with regeneration time.
N umber of species 0 5 10 15
0 50 100 150 200 250
0 6 15 35 70 130 300
Number of individuals
Figure7: Individual-based species rarefaction curves for crickets communities within different forest patches. All 95% confidence intervals (CI) overlapped, showing that there was no significant difference between forests patches. We removed the dotted lines that represent CI, so as to allow visualization of trends.
0 6 15 35 70 130 300
−3 −2 −1 0 1 2
Coordinate 1 C o or dinat e 2 1.5 1 0.5 0 −0.5 −1 −1.5
Figure8: Plot of nonmetric multidimensional scaling (NMDS) ordination, showing difference between areas: stress 0.1401;P <
0.001. Colors correspond to regeneration time, varying from 0 to 300 years.
3.7. Effects of Regeneration Time on Cricket Species Compo-sition. Species composition was different among all forest patches (Stress 0.1401;P <0.001;Figure 8), with ANOSIM indicating complete separation among patches (R=0.75; P (same) < 0.0001; Bonferroni P values for each patch combination<0.03;Table 3).
The SIMPER (Table 2: taxa contribution) showed that
8 International Journal of Zoology
Table3: Analysis of similarity (ANOSIM) results, showing, Bonferroni-correctedPvalues for the null hypotheses that forest patch species composition is the same for each patch combination. Permutation number=10,000; mean rank within=419.6; mean rank between=1326;
R=0.7509; overallP(same)<0.0001; distance measure: Bray-Curtis.
Forest patch Forest patch (regeneration time)
(regeneration time) 0 6 15 35 70 130 300
0 — 0 0 0 0 0 0
6 0 — 0.0007 0.0001 0 0 0
15 0 0.0007 — 0 0 0 0
35 0 0.0001 0 — 0.0001 0 0
70 0 0 0 0.0001 — 0.0004 0.0039
130 0 0 0 0 0.0004 — 0.0244
300 0 0 0 0 0.0039 0.0244 —
Figure9: Presence (gray) or absence (white) of the 19 species (columns) in each of the seven forest patches (rows). For nested pattern, all species should appear above the curve. The result shows that species composition was not nested.
3.8. Nestedness Analyses. Species composition showed no nested pattern (NODF=51.72;P=0.84;Figure 9).
4. Discussion
4.1. Cricket Fauna. The exclusiveness of the Gryllidae family to open habitat coincides with previous observations [48] that this family is typical of open areas, in contrast to Phalan-gopsidae and Trigoniidae, which are characteristic of forest habitat. Open areas facilitate flight and allow sound to spread easily [49], leading to a predominance of winged species with well-developed posterior wings, which are responsible for flight [50]. Among the Gryllidae, most species had well-developed hindwings and stridulatory apparatus for acoustic communication [51]. This may explain why Gryllidae were restricted to the open area.
Sound propagation is limited in forest habitats, which may represent a selective pressure against acoustic communi-cation [49,52]. In forested areas, apterous species and those without posterior wings predominate, particularly in the case of litter crickets (C.F. Sperber, personal observations). Such species are unable to fly [53]. The loss of forewings implies the loss of stridulatory capacity. As a probable alternative form of communication, many litter cricket species have secretory external glands used in pre- and postcopulatory
behavior. All of the Phalangopsidae that we collected lacked posterior wings, with the exception ofLernecasp.1 (Gryl-loidea: Phalangopsidae).
Lernecasp.1 presents developed posterior wings, similar to those ofEneoptera surinamensis(Grylloidea: Eneopteri-dae). Both species are good fliers and may be especially well adapted to dispersion. Although we collectedE. surinamensis
in only one area, this species is common in disturbed forest habitats [54].
Forest Phalangopsidae generally have slender, poorly chitinized bodies, which makes them more prone to desic-cation and therefore dependent on humid conditions. This may explain their high abundance in regenerated forests. In contrast to the slender body of forest Phalangopsidae, the body ofLernecais more robust and chitinized, making this taxon less dependent on humid conditions. Similarly,E. surinamensisalso has a robust, strongly chitinized body and is not dependent on high humidity. This species probably absorbs water for metabolism from its diet, and its phenology is synchronized to seasonal water availability, remaining as nymphs (which are vulnerable to desiccation) during the rainy season and developing into adults in the dry season [55]. Similar adaptations may occur inLerneca sp.1. The above characteristics explain why these two species are commonly collected in less regenerated forests.
The Phalangopsidae generaEidmanacris,Endecous,and
Aracambyare usually associated with less disturbed forests, being dependent on high humidity in the soil, shelter in armadillo holes, tree holes, or gaps formed by fallen logs [56].PhoremiaandZucchiella(Trigoniidae) are recorded as associated with less disturbed forests [57] and use litter for displacement and sheltering [23].
The predominance of the Phalangopsidae species Ecte-coussp.1, in relation to the Trigonidiidae speciesPhoremia
International Journal of Zoology 9
studied differed: while the size of the patches in this study varied from seven to 150 thousand hectares, forest patches wherePhoremiapredominates were all less than 350 ha [23]. Smaller areas are more susceptible to abiotic disturbances, such as edge effects [11, 59], and anthropogenic distur-bances, such as selective logging [60]. If this is the case, then the predominance of Ectecousin Atlantic Rainforest litter could be regarded as an indicator of the degree of forest preservation.
4.2. Species Richness Response to Regeneration. The asymp-totic response of cricket species richness to regeneration time (Figure 2) suggests that species accumulation occurs in two distinct phases. Species richness increases up to
ca. 130 years of regeneration, when a local limit may be reached. However, we must take the asymptotic stabilization of species richness with regeneration time with caution, since the bias of the estimated species richness also increased with regeneration time, as depicted by the increasing slope of the rarefaction curves with regeneration time (Figure 7). At the spatial scale sampled here, however, our results show a trend of local species richness stabilizing with regeneration time, contrasting with a continuous change in species composition (Figure 8).
The asymptotic response of cricket species richness to forest regeneration could be interpreted as “how much is enough?” [61]; that is, a regeneration period of 130 years would be enough to restore original species richness. However, the continuity of the directional change in species composition may be regarded as evidence that this interpre-tation is incorrect. Although species richness did not change from 130 to 300 years of regeneration, species composition continued to change.
The asymptotic accumulation of cricket species differs from the patterns proposed in the literature. The observed response may be a subtle divergence from the constant increase expected by Clements [15]. On the other hand, the asymptotic response could correspond to the initial portion of the humpback pattern expected by intermediate disturbance [18]. Larger time spans would highlight the decreasing portion of the humpback pattern. Rosenzweig [62] already suggested that such partial gradient responses to explain contradictory patterns of increase and decrease of richness with succession.
Our chronosequence is, however, old enough to test whether further changes occurred over a longer time period. Our highest regeneration time was of at least 300 years. Any disturbance in this area would have been restricted to forest use by Amerindians, prior to European colonization of Brazil. Estimates of human population size at the time of first European contact range from 1 to 5 million, but the indige-nous population has now declined to about 185,000 [63]. Moreover, according to the present knowledge, forest use and disturbance by Amerindians would have been spatially and temporary restricted [64]. Amerindians generally built in natural clearings, with selective logging and no pruning of roots [65]. We therefore believe that disturbances caused by Amerindians were spatially and temporarily restricted, and
that the eventual effects of such disturbances upon forest litter communities would not persist until today.
4.3. Local Environmental Drivers. The mechanisms involved in the increasing levels of species richness include canopy cover and litter accumulation. However, the coincidence of the asymptotic litter response curve to regeneration (Figure 6) suggests that this environmental variable is fun-damental to determining cricket species richness. The limit to species accumulation suggests that there is some kind of saturation point, mediated through competitive or other biotic interactions [10]. Litter depth could possibly correlate to shelter availability. Shelter within litter could provide both enemy protection [66] and favorable humidity conditions [24]. Species saturation could, therefore, be determined by bottom-up as well as top-down control mechanisms [67,68]. If this is the case, litter cricket communities of old tropical forests might be saturated, even though competition for food is not apparent: crickets are omnivores, thus probably generalists; therefore food resources are probably not lim-iting. Shelter from natural enemies or suitable oviposition sites with more favorable environmental conditions may be limiting factors for litter crickets. Thus it is possible that crickets compete for these resources, creating a limit to species richness.
4.4. Environmental Drivers: Canopy Cover. The increase of canopy cover with regeneration time (Figure 5) leads to lower temperature variability and lower evaporation of soil water [66]. High temperature variation—typical of early succession stages [69]—can exceed insect thermoregulatory capacities, affecting development and survival [70]. Fur-thermore, variations in temperature can induce diapause in insects [71], resulting in a decreased metabolic rate [72] and compromised immune response [73]—which ultimately affects locomotion and reproduction [74, 75]. Increased canopy cover may therefore represent an increase in cricket habitat suitability [76], driving the observed increase in species richness (Figure 3).
Humidity affects reproduction in insects [77]. Since the reproductive rate of crickets may be reduced during low humidity conditions [24], it can be expected that a higher reproductive rate would be achieved in environments with greater canopy cover. Humidity can also affect insect locomotion, since it influences soil adhesiveness [74]. Litter crickets move by means of walking and jumping, and locomotion efficiency can also impact mating success and predation avoidance. High humidity may increase fungus development [78], which may reduce food palatability and facilitate the growth of toxin-producing entomopatogenic fungi [79] that can be lethal to insects (but see Elliot et al. [73]). Excessively high humidity may therefore be harmful to litter crickets.
10 International Journal of Zoology
and a deeper leaf-litter layer could also provide a refuge for crickets to maintain humidity during the dry season; thus buffering population declines during such periods [83]. Litter is also important for the provision of nesting sites, especially for species that oviposit directly into the soil or litter components [84].
4.5. Environmental Drivers: Litter Depth. Litter depth res-ponded asymptotically to regeneration time, stabilizing at 130 years (Figure 6), which converges with the observed response of species richness (Figure 2). We suggest that this parameter is the strongest environmental driver of cricket species richness. The stabilization of litter depth with increasing canopy cover may result from an increase in decomposition rate in old-growth forest [85]. High production of leaf litter thus corresponds with a high rate of decomposition.
4.6. Effects of Cricket Abundance on Cricket Species Richness.
Our statistical results were inconclusive between choos-ing regeneration time or cricket abundance to explain species richness per patch. This doubt characterizes collinear explanatory variables [35, 36]. Collinearity occurs when explanatory variables covary in the field, with both vari-ables contributing to the observed pattern. Therefore, both cricket species richness and abundance increased with forest regeneration time. One effect cannot be discussed separately from the other. We interpret these correlations as evidence of increasing habitat quality for crickets during forest regeneration.
4.7. Sampling Sufficiency. For the older (35 years or more) forest patches, the rarefaction curves suggest that the cricket species richness was undersampled, since there was no distinguished stabilization in the species accumulation curves (Figure 7). Although intensive sampling in the most preserved patch (300 years), done for taxonomy purposes (Francisco A. G. de Mello and Pedro G. Dias, personal communication), resulted in 25 cricket species (compared to 19 found here); thirteen of these cricket species live in tree trunks, shrubs, and canopy (Pedro G. Dias, personal communication) and are rarely caught in pitfall traps. All species found in the litter during that taxonomic study were also sampled here. Therefore, if there are undetected litter cricket species in the older forest patches, they must be very rare.
The increase in the slopes of the rarefaction curves with regeneration time (Figure 7) indicates an increase in the bias of the estimated species richness with forest regeneration, evidencing an increase in the spatial scale at which species richness is detected. In the most recent forest patches (zero to 15 years of regeneration), species richness was fully sampled, while the rarefaction curves in all remaining, older, patches showed that we did not reach the actual species richness. Therefore, the rarefaction curves reinforce the pattern of species richness increasing with regeneration time.
Our results suggest an apparent saturation of cricket species richness at the sampled spatial scale as well as an
increasing complementarity (sensuColwell and Coddington [86]) of cricket species composition within older forest patches. This may result from an increase in regional species richness, unveiling long-term evolutionary processes. Older forest patches may harbor a larger species pool, which could be traced back to the evolutionary history of the original forest habitat.
4.8. Effects of Regeneration Time on Cricket Species Com-position. Although regeneration led to changes in species composition that were coincident with an increase in species richness, composition changes could not be assigned to nestedness; that is, species composition in lower-richness patches was not a subset of species composition in the higher-richness patches (Figure 9). This, along with the differences in composition detected in the NMDS, suggests a directional change in species composition. This coincides with classic definitions of ecological succession [87]. Our results indicate that there may be a directional replacement of species, driven by ecological succession.
4.9. Concluding Remarks. Our results highlight the impor-tance of considering species composition when evaluating biodiversity changes after a disturbance. While the increase in species richness stopped after ca. 130 years of forest regeneration, species composition continued changing. The regeneration that we observed may be restricted to regions where there is a sufficiently large and well-preserved pool of late-succession species that constitute a source of colonizers for regenerating areas. Environmental drivers of biodiversity regeneration probably involve changes in both resource availability and favorable conditions. We believe that the same processes may drive biodiversity regeneration of other organisms, which share a strong dependence on local habitat. A general implication for conservation is that the evaluation of biodiversity recovery necessitates the evaluation of both diversity and species composition responses. Studies that consider only species richness may generate misleading conclusions.
Acknowledgments
The authors thank Izana Brol, La´ercio Szinwelski, Sebasti˜ao Oliveira, and Marina Xavier for assistance in the field; Nilsa S. Cardias and Iracema L. S. Brol for help in cricket screening; Sabrina P. Almeida and two anonymous referees for valuable suggestions on the paper; Maria L. Fernandes for help in editing figure. Field facilities were provided by CCZ-Foz do Iguac¸u and Iguac¸u National Park and finan-cial support by CNPq, CAPES, FAPEMIG, and SISBIOTA (CNPq/FAPEMIG—5653360/2010-0).
References
International Journal of Zoology 11
[2] M. C. Ruiz-Jaen and T. M. Aide, “Restoration success: How is it being measured?”Restoration Ecology, vol. 13, no. 3, pp. 569–577, 2005.
[3] L. Meneses-Calvillo, V. M. Ram´ırez, V. Parra-Tabla, and J. Navarro, “Bee diversity in a fragmented landscape of the Mexican neotropic,”Journal of Insect Conservation, vol. 14, no. 4, pp. 323–334, 2010.
[4] N. Myers, R. A. Mittermeler, C. G. Mittermeler, G. A. B. Fonseca, and J. Kent, “Biodiversity hotspots for conservation priorities,”Nature, vol. 403, no. 6772, pp. 853–858, 2000. [5] B. S. van Gemerden, G. N. Shu, and H. Olff, “Recovery of
conservation values in Central African rain forest after logging and shifting cultivation,”Biodiversity and Conservation, vol. 12, no. 8, pp. 1553–1570, 2003.
[6] B. G. Ferguson, J. Vandermeer, H. Morales, and D. M. Griffith, “Post-agricultural succession in El Pet´en, Guatemala,” Conservation Biology, vol. 17, no. 3, pp. 818–828, 2003. [7] E. R. Hooper, P. Legendre, and R. Condit, “Factors affecting
community composition of forest regeneration in deforested, abandoned land in Panama,”Ecology, vol. 85, no. 12, pp. 3313– 3326, 2004.
[8] R. R. Dunn, “Recovery of faunal communities during tropical forest regeneration,”Conservation Biology, vol. 18, no. 2, pp. 302–309, 2004.
[9] D. Veddeler, C. H. Schulze, I. Steffan-Dewenter, D. Buchori, and T. Tscharntke, “The contribution of tropical secondary forest fragments to the conservation of fruit-feeding butter-flies: effects of isolation and age,”Biodiversity and Conserva-tion, vol. 14, no. 14, pp. 3577–3592, 2005.
[10] S. J. Wright and H. C. Muller-Landau, “The future of tropical forest species,”Biotropica, vol. 38, no. 3, pp. 287–301, 2006. [11] I. M. Turner and R. T. Corlett, “The conservation value of
small, isolated fragments of lowland tropical rain forest,” Trends in Ecology and Evolution, vol. 11, no. 8, pp. 330–333, 1996.
[12] R. L. Chazdon, C. A. Peres, D. Dent et al., “The potential for species conservation in tropical secondary forests,” Conserva-tion Biology, vol. 23, no. 6, pp. 1406–1417, 2009.
[13] M. R. Guariguata and R. Ostertag, “Neotropical secondary forest succession: changes in structural and functional char-acteristics,”Forest Ecology and Management, vol. 148, no. 1–3, pp. 185–206, 2001.
[14] W. Zhu, S. Cheng, X. Cai, F. He, and J. Wang, “Changes in plant species diversity along a chronosequence of vegetation restoration in the humid evergreen broad-leaved forest in the Rainy Zone of West China,”Ecological Research, vol. 24, no. 2, pp. 315–325, 2009.
[15] F. E. Clements, “Nature and structure of the climax,” The Journal of Ecology, vol. 24, no. 1, pp. 252–284, 1936. [16] R. Michalet, R. W. Brooker, L. A. Cavieres et al., “Do biotic
interactions shape both sides of the humped-back model of species richness in plant communities?”Ecology Letters, vol. 9, no. 7, pp. 767–773, 2006.
[17] F. E. Egler, “Vegetation science concepts I. Initial floristic composition, a factor in old-field vegetation development with 2 figs,”Vegetatio Acta Geobotanica, vol. 4, no. 6, pp. 412–417, 1954.
[18] A. N. Auclair and F. G. Goff, “Diversity relations of upland forests in the western Great Lakes area,” The American Naturalist, vol. 105, no. 946, pp. 499–528, 1971.
[19] J. P. Grime, “Competitive exclusion in herbaceous vegetation,” Nature, vol. 242, no. 5396, pp. 344–347, 1973.
[20] M. Huston, “A general hypothesis for species diversity,” American Naturalist, vol. 113, no. 1, pp. 81–101, 1979.
[21] J. S. Denslow, “Patterns of plant species diversity during succession under different disturbance regimes,”Oecologia, vol. 46, no. 1, pp. 18–21, 1980.
[22] S. M. Scheiner and M. R. Willig, “Developing unified theories in ecology as exemplified with diversity gradients,” The American Naturalist, vol. 166, no. 4, pp. 458–469, 2005. [23] C. F. Sperber, L. G. S. Soares, and M. R. Pereira, “Litter
disturbance and trap spatial positioning affects number of captured individuals and genera of crickets (Orthoptera: Grylloidea),”Journal of Orthoptera Research, vol. 16, no. 1, pp. 77–83, 2007.
[24] K. E. McCluney and R. C. Date, “The effects of hydration on growth of the house cricket, Acheta domesticus,”Journal of Insect Science, vol. 8, no. 32, pp. 1–9, 2008.
[25] W. F. Laurance, T. E. Lovejoy, H. L. Vasconcelos et al., “Ecosystem decay of Amazonian forest fragments: a 22-year investigation,”Conservation Biology, vol. 16, no. 3, pp. 605– 618, 2002.
[26] C. T. Rizzini, Tratado de fitogeografia do Brasil: aspectos ecol´ogicos, sociol´ogicos e flor´ısticos, ˆAmbito Cultural, Rio de Janeiro, Brazil, 2nd edition, 1997.
[27] A. E. Guimar˜aes, C. M. Lopes, R. P. Mello, and J. Alencar, “Ecologia de mosquitos (Diptera, Culicidae) em ´areas do Parque Nacional do Iguac¸u, Brasil. 1 Distribuic¸˜ao por h´abita,” Caderno de Sa´ude P´ublica, vol. 19, no. 4, pp. 1107–1116, 2003. [28] Google Earth. Foz do Iguac¸u, Brazil, 2008.
[29] R. Salamuni, E. Salamuni, L. A. Rocha, and A. L. Rocha, “Parque Nacional do Iguac¸u, PR—ataratas de fama mundial,” S´ıtios geol ´ogicos e paleontol ´ogicos do Brasil, pp. 313–321, 2002.
[30] R. A. Ortiz, “Conservation versus development at the Iguac¸u National Park, Brazil,”Ambientalia, vol. 1, pp. 141–160, 2010. [31] J. R. Mu˜noz, “The guerra grande: the war of the Triple Alliance, 1865–1870,”Strategy & Tactics, vol. 270, pp. 6–18, 2011.
[32] IBAMA,Plano de Manejo do Parque Nacional do Iguac¸u, MMA, Bras´ılia-DF, 1999.
[33] C. F. Sperber, G. H. Vieira, and M. H. Mendes, “Aprimora-mento da amostragem de grilos de serapilheira (Orthoptera: Gryllidae) por armadilha,”Neotropical Entomology, vol. 32, no. 4, pp. 733–735, 2003.
[34] G. W. Frazer, C. D. Canham, and K. P. Lertzman, Gap Light Analyzer Analyzer (GLA): Imaging Software to Extract Canopy Structure and Gap Light Transmission Indices From Truecolour Fisheye phoTographs, User Manual and Program Documentation, Simon Fraser University, British Colombia, Canda, Institute of Ecossystem Studies, New York, NY, USA, 1999.
[35] M. J. Crawley,The R Book, John Wiley & Sons, West Sussex, UK, 2007.
[36] A. F. Zuur, E. N. Ieno, N. J. Walker, A. A. Saveliev, and G. M. Smith,Mixed Effects Models and Extensions in Ecology With R, Springer, New York, NY, USA, 2009.
[37] B. D. Coleman, “On random placement and species-area relations,”Mathematical Biosciences, vol. 54, no. 3-4, pp. 191– 215, 1981.
[38] R Development Core Team,R: A Language and Environment for Statisticalstatistical Computing, R Foundation for Statistical Computing,, Vienna, Austria, 2010.


![Table 1. Taxa sampled in a field experiment designed to compare the captured species spectrum of three different killing solutions [8]](https://thumb-eu.123doks.com/thumbv2/123dok_br/15366019.62548/65.918.291.643.565.797/sampled-experiment-designed-compare-captured-spectrum-different-solutions.webp)