Submitted10 June 2016
Accepted 8 December 2016
Published19 January 2017
Corresponding author
Megan J. Wilson,
Academic editor
Heather Etchevers
Additional Information and Declarations can be found on page 15
DOI10.7717/peerj.2909
Copyright
2017 Cheung et al.
Distributed under
Creative Commons CC-BY 4.0
OPEN ACCESS
Selection and evaluation of reference
genes for analysis of mouse
(Mus
musculus
) sex-dimorphic brain
development
Tanya T. Cheung, Mitchell K. Weston and Megan J. Wilson
Department of Anatomy, University of Otago, Dunedin, New Zealand
ABSTRACT
The development of the brain is sex-dimorphic, and as a result so are many neurological disorders. One approach for studying sex-dimorphic brain development is to measure gene expression in biological samples using RT-qPCR. However, the accuracy and consistency of this technique relies on the reference gene(s) selected. We analyzed the expression of ten reference genes in male and female samples over three stages of brain development, using popular algorithms NormFinder, GeNorm and Bestkeeper. The top ranked reference genes at each time point were further used to quantify gene expression of three sex-dimorphic genes (Wnt10b, Xist and CYP7B1). When comparing gene expression between the sexes expression at specific time points the best reference gene combinations are:Sdha/Pgk1at E11.5,RpL38/SdhaE12.5, and Actb/RpL37 at E15.5. When studying expression across time, the ideal reference gene(s) differs with sex. For XY samples a combination ofActb/Sdha. In contrast, when studying gene expression across developmental stage with XX samples,Sdha/Gapdhwere the top reference genes. Our results identify the best combination of two reference genes when studying male and female brain development, and emphasize the importance of selecting the correct reference genes for comparisons between developmental stages.
SubjectsDevelopmental Biology, Genomics, Molecular Biology, Neuroscience
Keywords Reference gene, Sex-dimorphic, Brain, Development, Mice, RT-qpcr
INTRODUCTION
male) (Abel, Drake & Golds, 2010;Saha et al., 2005) and Autism spectrum disorder (1 female:4 male) (Mottron et al., 2015). In order to understand how such differences arise at the level of gene expression, we set out to determine the best set of reference genes to study mouse sex-dimorphic brain development during key developmental stages.
The house mouse (Mus musculus) is an excellent choice for embryonic studies of mammalian development owing to its comparatively short gestation period and accelerated life span. In particular, mice have been widely used to study sex-dimorphic brain development (Maekawa et al., 2014;Ngun et al., 2011). To acquire more insight into the molecular drives of sex-dimorphic brain development, it is necessary to study the expression of genes in the developing brain. High-throughput sequencing technologies such as RNA sequencing (RNA-seq) provide a powerful technique to study changes in gene expression (Hrdlickova, Toloue & Tian, 2017). However, data gathered from these high-throughput technologies needs to be validated to ensure accurate interpretation through repeated biological replicates.
The most commonly used method for validating the expression of a gene identified by sequencing is Reverse Transcription quantitative Polymerase Chain Reaction (RT-qPCR). RT-qPCR allows for the detection and quantification of specific cDNA fragments generated from RNA samples. However, to obtain levels of expression comparable between samples, the target gene must be normalized to the expression of at least two internal controls (termed reference genes) that are stably expressed throughout all samples. Normalization is needed to compensate for different amounts of cDNA present in the sample along with differing PCR efficiencies of primer sets. Therefore, the selection of the reference gene is important as inappropriate reference genes can bias the data and thus lead to misinterpretation of results.
Ideally, the reference gene should be present at a consistent level across all compared samples, regardless of treatment or disease state of the sample. Furthermore, the chosen reference gene should be constitutively expressed across all cell types and tissues. However despite large-scale high-throughput technologies, no such gene has been found. Therefore the most common and validated approach is to find a reference gene that is the least variable in the specific context of the study.
The most regularly used reference genes areActbandGapdh(Boda et al., 2009). However, a number of studies have shown that these genes are expressed differentially in the brain. Gapdhhas been shown to have sex dimorphic protein levels in adulthood (Perrot-Sinal, Davis & McCarthy, 2001) and to be up regulated in neuronal apoptosis (Chen et al., 1999; Sawa et al., 1997).ActbandGapdhexpression has also been shown to vary across tissue types, among cell types and also during stages of cell proliferation and development of the brain (Sotelo-Silveira et al., 2008;Veazey & Golding, 2011).
METHODS
All animal work was performed under the University of Otago Animal Ethics Committee number: ET13/14. Inbred C57BL/6 mice were purchased from the Hercus Taieri Resource Unit (University of Otago, Dunedin, NZ).
Sample collection
Whole embryonic brain tissue (overlying epidermis and cranial facial tissues were removed) and tail tips were collected from timed stages (E11.5 to 18.5) pregnant mothers. RNA was extracted from brain tissue using Purelink RNA mini kit (Ambion, USA) according to manufacturer’s instructions. DNA was isolated from tail tips using 0.2 mg/mL (final concentration) Proteinase K (New England Biolabs, Ipswich, MA, USA) and then added to DirectPCR Lysis reagent 102-T (Viagen Biotechnologies, Los Angeles, CA, USA). Tail tips were incubated overnight at 55◦C and followed by heat inactivation of the proteinase
K at 85◦C for 45 min. Samples were centrifuged at 14,000 g for 1 min to pellet cell debris
and 2µL of each sample was used for sexing PCR. The RNA for each time point and sex was a pooled sample, with a minimum of three separate biological samples collected for each condition (from separate litters). Total RNA was quantified with a Nanodrop (ThermoFisher, Waltham, MA, USA) and purity assessed using the 260/230 and 260/280 ratios. A ratio of∼2 was taken as acceptable for pure RNA.
Sexing of embryos by PCR
To sex the embryos, theSrygene was amplified using primers listed inTable S1. Following PCR, products were run on a 2% agarose gel, a band appears at approximately 380 bp, indicating the presence of the Y-chromosome for male embryos.
DNase treatment and reverse transcription
To remove genomic DNA present in the sample, 1µg RNA was added to 1µL DNase and incubated at 37 ◦C for 40 min. A phenol/chloroform extraction was carried out followed by
ethanol precipitation to purify sample. Reverse transcriptase was performed using iScript (Bio-Rad, Hercules, CA, USA) according to manufacturer’s instructions.
RT-qPCR
Oligonucleotide primers (Table S1) were designed and ordered from Integrated DNA Technologies (IDT, Newark, NJ, USA). Each reaction contained 10µL SYBR Select Master Mix (ThermoFisher), 1.25µL 20 pmol forward and reverse primers, 6.75µL water and
2µL cDNA. All reactions also included a no reverse transcription control and each reaction
was carried out in triplicate. RT-qPCR was carried out in the Stratagene Mx3000p (Agilent Technologies, San Diego, CA, USA) under the following conditions: denaturing at 50◦C for
2 min, annealing 96◦C for 2 min, followed by 40 cycles of amplification (96◦C 15 s, 60◦C 15 s and 72◦C 1 min). A final cycle for melt curve analysis was included for every qPCR
Data analysis
Data from RT-qPCR was then analyzed using three algorithms to calculate the most stable or best suited reference gene; NormFinder (Andersen, Jensen & Orntoft, 2004), GeNorm with SLqPCR R-based package (Hellemans et al., 2007) Bestkeeper (Pfaffl et al., 2004) and RefFinder (deltaCt method, (Silver et al., 2006; Xie et al., 2012) software). All data was analyzed according to the program instructions.
The geometric mean was calculated for each reference gene by assigning a number (1–10) for top ranked genes for each algorithm. The following equation was used to calculate the geometric mean for each data set: 3√NormFinder*GeNorm*BestKeeper*deltaCt. The reference genes were then ranked again based on their lowest geometric mean.
Analysis of sex specific gene expression was calculated using the following equation: 1Ct=2−(Ctgene-Ctreference) with the average Ct value for the top two ranked reference
genes. Statistical testing used was either the unpaired Student’s t-test when comparing two time-points or a 2-way ANOVA when comparing multiple time-points across time (Tukey’s multiple comparison test).
RESULTS
Selection of candidate reference genes and mRNA transcript levels
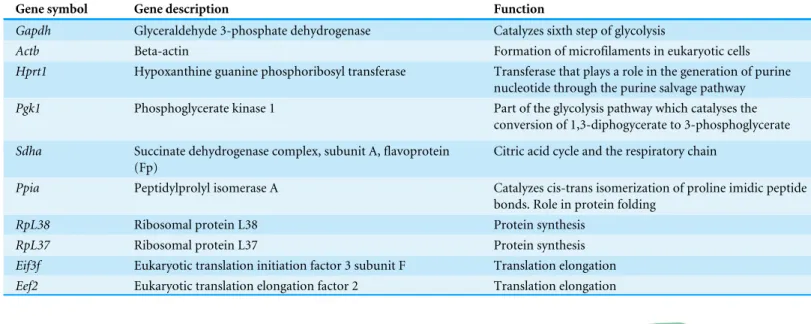
To ensure accurate analysis of gene expression, ten candidate reference genes (Table 1) were investigated to determine how stable each gene is for sex and time-point of development. The candidate reference genes selected included those genes commonly used in RT-qPCR experiments (such asGapdhandActb) and genes were stably expressed in multiple mouse adult tissues, but had not been tested for suitability as reference genes with mouse embryo tissues (Kouadjo et al., 2007). RT-qPCR was carried out for brain tissue samples across three time points: E11.5, E12.5 and E15.5 using both male and female samples. These time points were chosen for analysis as the sex determination in mouse occurs between E11.0 and E12.0. During this 24 h period, considerable changes also occur with respect to neuronal development, in particular, the formation of the primary brain vesicles (Stiles & Jernigan, 2010). By E12.5, cellular proliferation is increased resulting in the expansion of neuronal precursors and formation of cortical layers (Finlay & Darlington, 1995). Neuronal differentiation, axonal branching and synaptogenesis is taking place around day 15.5 (summarized inFig. 1) (Sur & Rubenstein, 2005) The raw Ct values for each reference gene across time and each sex are plotted inFig. 2.
Determination of best-suited reference genes for male and female developing brain
Table 1 Function, symbol and name of selected reference genes.
Gene symbol Gene description Function
Gapdh Glyceraldehyde 3-phosphate dehydrogenase Catalyzes sixth step of glycolysis
Actb Beta-actin Formation of microfilaments in eukaryotic cells
Hprt1 Hypoxanthine guanine phosphoribosyl transferase Transferase that plays a role in the generation of purine nucleotide through the purine salvage pathway
Pgk1 Phosphoglycerate kinase 1 Part of the glycolysis pathway which catalyses the
conversion of 1,3-diphogycerate to 3-phosphoglycerate Sdha Succinate dehydrogenase complex, subunit A, flavoprotein
(Fp)
Citric acid cycle and the respiratory chain
Ppia Peptidylprolyl isomerase A Catalyzes cis-trans isomerization of proline imidic peptide bonds. Role in protein folding
RpL38 Ribosomal protein L38 Protein synthesis
RpL37 Ribosomal protein L37 Protein synthesis
Eif3f Eukaryotic translation initiation factor 3 subunit F Translation elongation Eef2 Eukaryotic translation elongation factor 2 Translation elongation
Figure 1 Brain developmental stages used in this study.In mice gonadal sex determination occurs at
∼E11.5. At E11.5 the neural tube has formed the primary brain vesicles: Prosencephalon, Mesencephalon and Rhombencephalon. Between stages of E12.5 and E15.5, there is increased expansion of neuronal pre-cursors and cell migration forming cortical layers. Simultaneously, neurons differentiate to allow for ax-onal branching and synapse formation.
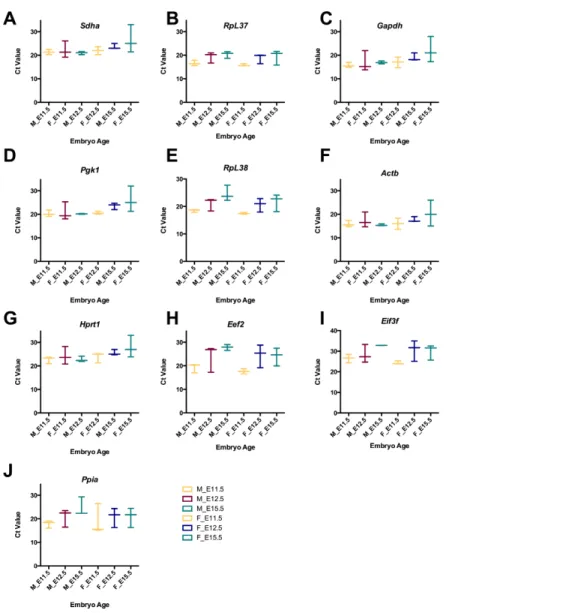
Figure 2 Raw Ct values for selected reference genes from RT-qPCR using cDNA from male and female brain tissue.(A) Raw Ct values for each reference gene are shown for female and male samples by devel-opmental stage. Data is plotted as floating bar plot, with min and maximum values indicated and a line at the mean for each stage (E11.5, E12.5 and E15.5).
Ct value is 17.9 (±2.22 SD) andEef2has a mean Ct of 22.53, while this Ct value was not the highest, the SD had the highest amount of variability of±4.54 SD.
Figure 3 Comparison of gene stability values for NormFinder and BestKeeper.(A) NormFinder sta-bility values for male and female reference genes across all developmental stages. (B) The stasta-bility value of combined sexes calculated by NormFinder across all each developmental time point of development. (C) The best suited reference genes for male and female samples as calculated by BestKeeper shown as sdt error (±CP). (D) BestKeeper values shown as std error (±CP) across time in samples of both sexes. The lowest stability value for each sex is shown (Female, red; Male, blue; Both sexes, black).
BestKeeper software determines the ideal reference genes out of a number of candidates based on the standard error (±CP) of Ct values and combines them into an index using repeated pair-wise correlation analysis (Pfaffl et al., 2004). Across all developmental stages, the BestKeeper identifiedPgk1(SE:±1.064) andSdha(SE:±1.004) as the best reference gene in the male sample, whileGapdh(SE:±1.639) andSdha(SE:±1.441) to be ideal for female samples (Fig. 3C). However at specific developmental stages, the ideal reference gene differs. At E11.5RpL38(SE:±0.68) is ranked the top reference gene, whilePgk1(SE:
±0.522) andHprt1(SE:±1.762) are the most stable reference genes for E12.5 and E15.5 respectively (Fig. 3D,Table S5).
The SLqPCR R-based package uses the GeNorm algorithm (Hellemans et al., 2007) which determines the most stable reference gene from a set of samples by calculating the geometric mean of each reference gene in a stepwise calculation. A low M value indicates stable expression of the gene: for homogenous samples a value below 0.5 indicates an unstable reference gene in the samples analyzed, whereas for heterogeneous tissues the mean M value below 1 is acceptable (Hellemans et al., 2007). The best stability value for the female samples across all time points wasSdhaandGapdhwith a stability M value of 0.591 while the top three most stable reference genes in the male samples werePgk1,andActB with a mean M stability value of 0.281 (Fig. 4A,Table S6).
At specific developmental time points,SdhaandPgk1(M of 0.2470) were calculated as the most stable reference genes for analysis of male and female samples at E11.5. Following sex determination in both male and female samples,ActbandGapdh(M of 0.346) gene are the most stable (Fig. 4B). During increased neuronal proliferation at E15.5,Actband Pgk1(M of 0.719) gave the lowest M values, indicating these are reliable reference genes according to GeNorm analysis given at this stage the developing brain is heterogeneous (Table S6).
A forth method, termed the comparative deltaCt method (Silver et al., 2006) was also used to compare reference genes. This uses a method similar to that of GeNorm, determining the variation of gene expression between paired putative reference genes (the deltaCt) within each sample. Variable deltaCt values for each pair between multiple samples, resulting in a high standard deviation when the average deltaCt is calculated, means either gene or both are not stably expressed. Pairs at E11.5 werePgk1andSdha (1.98/1.87),ActbandPgk1(1.98/1.82). At E15.5 there was much more variation between reference genes, best pair wereActbandSdha(4.7) (Fig. 4D;Table S7) When considering brain development overtime, for the male samplesPgk1andSdha(2.1) were the best pair, whereas for female samples,Hprt1andSdha(2.7) had the lowest stand deviation of deltaCt values (Fig. 4C).
Geometric mean of each reference gene
Figure 4 Comparison of stability values for GeNorm and deltaCt methods.(A) Stability (M) value cal-culated by GeNorm across time in both male and female samples. (B) GeNorm mean stability (M) val-ues in male and female samples across all developmental stages. (C) Average standard deviation using the deltaCt method for male, female and combined samples. (D) Average standard deviation using the deltaCt method for each time point tested. The lowest stability value for each sex is shown (Female, red; Male, blue; Both sexes, black).
(GeoMean: 1.18 and 2.94 respectively). Across all stages of embryonic development in males, the recommended reference genes are ActbandSdha(GeoMean: 2.73 and 1.96) while in the female brain, the most stable set of reference genes areSdha andGapdh (GeoMean 1.2 and 2.34).
Table 2 Geometric Mean of ranking values.
Male Female All stages, male and female
1 Sdha 1.96 Sdha 1.20 Sdha 1.18
2 Actb 2.73 Gapdh 2.34 RpL37 2.94
3 Pgk1 2.91 Hprt1 2.45 Actb 3.03
4 Gapdh 3.78 RpL37 4.58 Pgk1 3.10
5 RpL37 4.16 Actb 4.60 Hprt1 3.83
6 Hprt1 4.64 Pgk1 5.23 RpL38 6
7 Actb 4.82 RpL38 5.63 Gapdh 6.34
8 Ppia 7.95 Ppia 8.23 Ppia 7.23
9 Eef2 8.27 Eef2 8.73 Eef2 8.30
10 Eif3f 10 Eif3f 10 Eif3f 10
Table 3 Geometric Mean of ranking values by developmental stage.
E11.5 E12.5 E15.5
1 Sdha 1.56 RpL38 1.68 RpL37 1.86
2 Pgk1 1.86 Sdha 1.73 Actb 1.86
3 Actb 2.91 Pgk1 3.31 Sdha 3.31
4 Gapdh 3.72 Actb 3.35 Pgk1 3.72
5 RpL38 4.3 RpL37 3.89 Hprt1 3.86
6 RpL37 5.48 Gapdh 4.09 Eef2 4.78
7 Hprt1 5.89 Hprt1 5.95 RpL38 6.70
8 Eef2 8.23 Ppia 7.44 Gapdh 7.02
9 Ppia 9.14 Eef2 7.77 Ppia 8.20
10 Eif3f 9.24 Eif3f 10 Eif3f 10
and 1.73 are recommended. Finally,RpL37andActb(GeoMean 1.86 and 1.86) are the best suited for analysis of E15.5 brain tissue.
In comparison to a careful sex or stage approach above, we also pooled all the data together (both sexes and all stages). Overall, this approached produced stability values that were high (indicating a great variation between samples) for GeNorm and BestKeeper packages (Tables S5andS6). The geometric mean of ranked references genes for a pooled sample approached suggested thatSdhaandRpL37 (Tables 2and3), despiteRpL37often being ranked a poor choice if we were just consider the stabilities values for E11.5 and E12.5 individually (Table S8andS3).
Confirmation of sex-specific gene expression
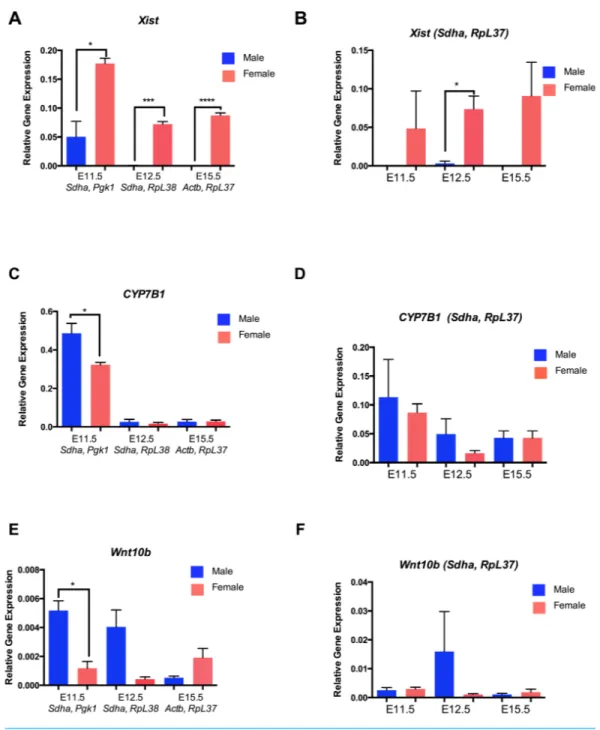
the female embryo with a fold change of 18.5 compared to male samples. However, these differences in gene expression were not studied over further time points, when neurogenesis has commenced. To extend the findings fromDewing et al. (2003), regarding sex-dimorphic expression of these genes, the top two ranked reference genes at each time point from this study are used to compare against a selection of three genes in male and female samples across embryonic brain development.
To normalize the expression of our three genes of interest,SdhaandPgk1oligonucleotide primers were used at E11.5,RpL38andSdhawere used for analysis for E12.5. For analysis of E15.5, the reference genesActbandRpL37were used. Sex-dimorphic expression ofXistwas detected at all three time points with increased expression in female brain compared to the males (Fig. 5A).CYP7B1andWnt10balso showed significant sex-dimorphic expression at E11.5 (P<0.05), with higher expression observed in the male brain at this stage (Figs. 5C and 5E; 3.5-fold and 5-fold respectively). Additionally, following sex determination, Wnt10b andCYP7B1expression was not significantly different between the sexes using these stage-specific reference genes (Figs.5Cand5E). In contrast, when pooling all data from sex and age together the top two ranked genes wereRpL37 andSdha. When using these two genes to normalize expression data there is a large variation in the expression of the three genes, especially at E12.5, between biological replicates (Figs. 5B,5Dand5F). No significant differences were observed in gene expression between male and female samples, when usingPgk1andSdhaas reference genes with the exception ofXistexpression at E12.5 (Figs. 5B,5Dand4F).
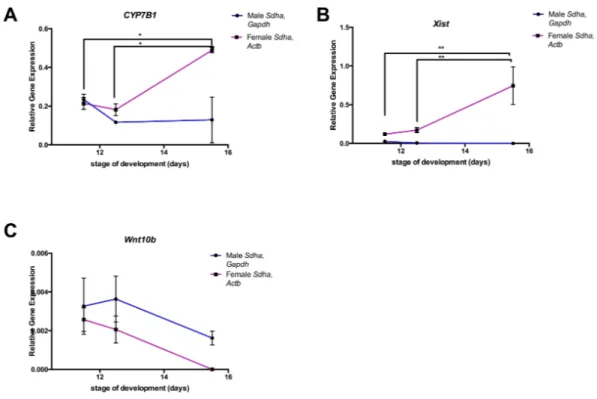
When studying gene expression changes over time, two slightly different sets of reference genes were ranked highest, depending upon the genotype of the sample (Table 2). We normalized gene expression at each time point for female samples (withSdhaandGapdh) and for male samples (withPgk1andSdha) to study how expression of these genes changes with respect to developmental age (Fig. 6). In comparison, whenRpL37(one of the poorer stable genes for female and male time points) andSdhawhere used as reference genes for normalization of the all data points (top two genes when reference gene data was pooledTable 2), this introduced so much variation between samples, any analysis would be inconclusive (Fig. S1).
CYP7B1mRNA expression declines between E11.5 and E12.5 in both sexes but its expression significantly increases again in the female only by E15.5 (Fig. 6A,P<0.05). Xist transcript expression in the female brain also increased between E11.5 and E15.5 (following sex-determination window (Fig. 1)) (Fig. 6B;P<0.001). Gene expression of theWnt10bgene in the developing brain was low at all time-points and did not change significantly overtime in the female staged embryo samples (Fig. 6C). However, the higher expression observed in the male embryonic samples decreased also between E11.5 and E12.5, to similar expression levels found in XX samples (Fig. 6C).
DISCUSSION
Figure 6 Expression ofCYP7B1,XistandWnt10bacross three stages of brain development.(A) CYP7B1mRNA expression in male (blue) and female (pink) brain tissue across developmental stages E11.5, E12.5 and E15.5 normalised to the top ranked reference genes for each sex over time. (B)Xist mRNA expression in male (blue) and female (pink) brain tissue across developmental time stages normalized to the top ranked reference genes for each sex at E11.5, E12.5 and E15.5. (C)Wnt10bmRNA expression of male (blue) and female (pink) brain tissue at developmental time stages E11.5, E12.5 and E15.5. Data is show as mean and standard error of the mean.∗=P < 0.05∗∗=P <0.001 Two-way ANOVA (Tukey’s multiple comparison test).
As shown here, the reference genes used at particular developmental stages introduce much more variation into the data analysis and is problematic for drawing conclusions from RT-qPCR data. Therefore, it is essential to determine use the best reference gene pair for RT-qPCR analyses. For the comparison of sex-dimorphic gene expression at specific time points,SdhaandPgk1are recommended at E11.5. At E12.5,ActbandSdhaare most appropriate followed byGapdhandPgk1are E15.5.
(Chaumeil et al., 2006;Heard, Clerc & Avner, 1997). This indicates that X-linked genes should be avoided when analyzing gene expression in XX tissues samples at early stages of brain development, particularly as our data forXist (Fig. 6) indicates changes to the expression of X-linked genes during brain development.
CYP7B1 converts the dihydrotesosterone (DHT) metabolite 5α-androstane-3β, 17β -diol (3β--diol) to an inactive form and has been suggested to have a developmental role maintaining normal levels of estrogens and androgens in the mammalian brain (Rose et al., 1997).CYP7B1mRNA expression has been previously detected in the hippocampus, testis and ovary (Wu et al., 1999). KnockoutCYP7B1mice have an enlarged brain (late fetal stages were examined) due to reduced apoptosis but overall brain weight normalizes after puberty for both sexes (Sugiyama et al., 2009). In female miceCYP7B1knockout results in early onset puberty and ovarian failure (Omoto et al., 2005). A recent study found that male mutant have a reproductive behavioral defect, possibility due to altered olfactory cue sensing (Oyola et al., 2015). We found that expression ofCYP7B1is sex-dimorphic at E11.5, prior to any steroid hormone production by the developing gonads. By E15.5 the testis is producing significant levels of testosterone and DHT, expression levels ofCYP7B1 remained low in the male but had increased in the female at E15.5 (Fig. 4C). Consistent with these results, previously it was found that the humanCYP7B1promoter is suppressed by DHT in human cell lines (Tang et al., 2006). In contrast,CYP7B1expression increased with overexpression of estrogen receptors. While in females there is no prenatal estradiol production, 3β Adiol, the target of CYP7B1 activity, is produced by the immature ovary (Sugiyama et al., 2010). 3β Adiol binds to estrogen receptorβ (ERβ), expression of this receptor begins at E12.5, peaks at E18.5 and is active in the absence of estrogen, possibility due to the presence of an alternative ligand such as 3β Adiol (Sugiyama et al., 2010). Together, this indicates that changes to the embryonic brain gene expression ofCYP7B1 maybe regulated by androgen receptors and levels of steroid hormone metabolites during mouse development. This may produce the changes we observed inCYP7B1expression across time in the female and males developing brain RNA samples (Figs. 4Cand5A).
The Wnt ligand,Wnt10b, was expressed at higher levels in male samples compared to female E10.5 head samples in a previous microarray study (Dewing et al., 2003). While Wnt10b knockout mice appear phenotypically normal, they exhibit a number of aging-related phenotype such as bone loss (Stevens et al., 2010). Little has been studied regarding the role ofWnt10bin early brain patterning, however research with the zebrafish model indicated thatWnt10bfunctions redundantly withWnt1in specification of the midbrain-hindbrain boundary (Lekven et al., 2003). Therefore it may play an early role in patterning of the midbrain-hindbrain boundary in mice, but any functional consequence for higher expression within the male developing brain at E10.5 (Dewing et al., 2003) and E11.5 (Fig. 4E) requires further investigation.
levels ofXist expression in the males between E11.5-15.5 (Fig. 4A). Regulation ofXistgene expression is complex, it is repressed by promoter bound CCCTC-binding factor (CTCF) and negatively regulated by an anti-sense RNA,Tsix. A second ncRNA transcript, Jpx, expressed from both X chromosomes, binds to CTCF and removes it from the Xist promoter region promoting expression ofXist(Sun et al., 2013).Xistgene expression (nor that ofJpxandTsix) has not been examined in any detail overtime nor in later developing tissues. The function of Xist RNA in XCI is likely to be dosage sensitive (toXist RNA levels) and tightly regulated. Mis-regulation (up- or down) will allow either more genes to escape X-inactivation or result in a reduction of expression of X-linked genes that are critical for brain development. Overexpression ofXisthas been linked to female psychiatric conditions in humans (Ji et al., 2015).
This study has shown that the optimal reference gene(s) varies with the sex and stage of development. Therefore, when looking at gene expression either between sexes or across time for a particular sex, careful consideration should be given to which reference gene(s) are the most stable between the given samples and ideally use a combination of at least two to provide the most robust results for data analysis.
ACKNOWLEDGEMENTS
We would like to thank Simon Blanchoud for the very helpful comments on the manuscript drafts and Lisa Zondag for proofreading of the manuscript.
ADDITIONAL INFORMATION AND DECLARATIONS
Funding
The authors received funding from the Otago Medical Research Foundation. The funders had no role in study design, data collection and analysis, decision to publish, or preparation of the manuscript.
Grant Disclosures
The following grant information was disclosed by the authors: Otago Medical Research Foundation.
Competing Interests
The authors declare there are no competing interests.
Author Contributions
• Tanya T. Cheung conceived and designed the experiments, performed the experiments, analyzed the data, contributed reagents/materials/analysis tools, wrote the paper, prepared figures and/or tables, reviewed drafts of the paper.
• Mitchell K. Weston performed the experiments, contributed reagents/materials/analysis tools, reviewed drafts of the paper.
Animal Ethics
The following information was supplied relating to ethical approvals (i.e., approving body and any reference numbers):
University of Otago Animal Ethics Committee ET13/14.
Data Availability
The following information was supplied regarding data availability: Data are supplied asTables S1–S8.
Supplemental Information
Supplemental information for this article can be found online athttp://dx.doi.org/10.7717/ peerj.2909#supplemental-information.
REFERENCES
Abel KM, Drake R, Goldstein JM. 2010.Sex differences in schizophrenia.International Review of Psychiatry 22(5):417–428DOI 10.3109/09540261.2010.515205.
Andersen CL, Jensen JL, Orntoft TF. 2004.Normalization of real-time quantitative reverse transcription-PCR data: a model-based variance estimation approach to identify genes suited for normalization, applied to bladder and colon cancer data sets.Cancer Research64:5245–5250DOI 10.1158/0008-5472.CAN-04-0496. Arnold AP. 2004.Sex chromosomes and brain gender.Nature Reviews Neuroscience
5:701–708DOI 10.1038/nrn1494.
Boda E, Pini A, Hoxha E, Parolisi R, Tempia F. 2009.Selection of reference genes for quantitative real-time RT-PCR studies in mouse brain.Journal of Molecular Neuroscience37:238–253DOI 10.1007/s12031-008-9128-9.
Chaumeil J, Le Baccon P, Wutz A, Heard E. 2006.A novel role for Xist RNA in the formation of a repressive nuclear compartment into which genes are recruited when silenced.Genes and Development 20:2223–2237DOI 10.1101/gad.380906.
Chen RW, Saunders PA, Wei H, Li Z, Seth P, Chuang DM. 1999.Involvement of glyceraldehyde-3-phosphate dehydrogenase (GAPDH) and p53 in neuronal apoptosis: evidence that GAPDH is upregulated by p53.Journal of Neuroscience 19:9654–9662.
Dewing P, Shi T, Horvath S, Vilain E. 2003.Sexually dimorphic gene expression in mouse brain precedes gonadal differentiation.Molecular Brain Research118:82–90 DOI 10.1016/S0169-328X(03)00339-5.
Finlay BL, Darlington RB. 1995.Linked regularities in the development and evolution of mammalian brains.Science268(5217):1578–1584DOI 10.1126/science.7777856. Fombonne E. 2009.Epidemiology of pervasive developmental disorders.Pediatric
Research65:591–598 DOI 10.1203/PDR.0b013e31819e7203.
Galupa R, Heard E. 2015.X-chromosome inactivation: new insights into cis and trans regulation.Current Opinion in Genetics & Development 31:57–66
Giedd JN, Castellanos FX, Rajapakse JC, Vaituzis AC, Rapoport JL. 1997.Sexual dimorphism of the developing human brain.Progress in Neuro-Psychopharmacology and Biological Psychiatry21(8):1185–1201DOI 10.1016/S0278-5846(97)00158-9. Goldstein JM, Seidman LJ, Horton NJ, Makris N, Kennedy DN, Caviness Jr VS,
Faraone SV, Tsuang MT. 2001.Normal sexual dimorphism of the adult human brain assessed by in vivo magnetic resonance imaging.Cerebral Cortex11:490–497 DOI 10.1093/cercor/11.6.490.
Gur RC, Turetsky BI, Matsui M, Yan M, Bilker W, Hughett P, Gur RE. 1999.Sex differences in brain gray and white matter in healthy young adults: correlations with cognitive performance.Journal of Neuroscience 19:4065–4072.
Heard E, Clerc P, Avner P. 1997.X-chromosome inactivation in mammals.Annual Review of Genetics31:571–610DOI 10.1146/annurev.genet.31.1.571.
Hellemans J, Mortier G, De Paepe A, Speleman F, Vandesompele J. 2007.qBase relative quantification framework and software for management and automated analysis of real-time quantitative PCR data.Genome Biology8: Article R19
DOI 10.1186/gb-2007-8-2-r19.
Hrdlickova R, Toloue M, Tian B. 2017.RNA-Seq methods for transcriptome analysis. Wiley Interdisciplinary Reviews: RNA8(1)DOI 10.1002/wrna.1364.
Ji B, Higa KK, Kelsoe JR, Zhou X. 2015.Over-expression of XIST, the master gene for X chromosome inactivation, in females with major affective disorders.EBioMedicine 2:907–916DOI 10.1016/j.ebiom.2015.06.012.
Kouadjo KE, Nishida Y, Cadrin-Girard JF, Yoshioka M, St-Amand J. 2007. House-keeping and tissue-specific genes in mouse tissues.BMC Genomics8:127
DOI 10.1186/1471-2164-8-127.
Lekven AC, Buckles GR, Kostakis N, Moon RT. 2003.Wnt1 and wnt10b function redundantly at the zebrafish midbrain-hindbrain boundary.Developmental Biology 254:172–187DOI 10.1016/S0012-1606(02)00044-1.
Lenroot RK, Gogtay N, Greenstein DK, Wells EM, Wallace GL, Clasen LS, Blumenthal JD, Lerch J, Zijdenbos AP, Evans AC, Thompson PM, Giedd JN. 2007.Sexual dimorphism of brain developmental trajectories during childhood and adolescence. NeuroImage36:1065–1073DOI 10.1016/j.neuroimage.2007.03.053.
Maekawa F, Tsukahara S, Kawashima T, Nohara K, Ohki-Hamazaki H. 2014.The mechanisms underlying sexual differentiation of behavior and physiology in mammals and birds: relative contributions of sex steroids and sex chromosomes. Frontiers in Neuroscience8: Article 242DOI 10.3389/fnins.2014.00242.
Mottron L, Duret P, Mueller S, Moore RD, Forgeot d’Arc B, Jacquemont S, Xiong L. 2015.Sex differences in brain plasticity: a new hypothesis for sex ratio bias in autism. Molecular Autism6: Article 33DOI 10.1186/s13229-015-0024-1.
Ngun TC, Ghahramani N, Sanchez FJ, Bocklandt S, Vilain E. 2011.The genetics of sex differences in brain and behavior.Frontiers in Neuroendocrinology32:227–246 DOI 10.1016/j.yfrne.2010.10.001.
Sciences of the United States of America102:2814–2819 DOI 10.1073/pnas.0500198102.
Oyola MG, Zuloaga DG, Carbone D, Malysz AM, Acevedo-Rodriguez A, Handa RJ, Mani SK. 2015.CYP7B1 enzyme deletion impairs reproductive behaviors in male mice.Endocrinology 156:2150–2161DOI 10.1210/en.2014-1786.
Perrot-Sinal TS, Davis AM, McCarthy MM. 2001.Developmental sex differences in glutamic acid decarboxylase (GAD(65)) and the housekeeping gene, GAPDH.Brain Research922:201–208 DOI 10.1016/S0006-8993(01)03167-5.
Pfaffl MW, Tichopad A, Prgomet C, Neuvians TP. 2004.Determination of stable housekeeping genes, differentially regulated target genes and sample integrity: BestKeeper–Excel-based tool using pair-wise correlations.Biotechnology Letters 26:509–515DOI 10.1023/B:BILE.0000019559.84305.47.
Rose KA, Stapleton G, Dott K, Kieny MP, Best R, Schwarz M, Russell DW, Bjorkhem I, Seckl J, Lathe R. 1997.Cyp7b, a novel brain cytochrome P450, catalyzes the synthesis of neurosteroids 7alpha-hydroxy dehydroepiandrosterone and 7alpha-hydroxy pregnenolone.Proceedings of the National Academy of Sciences of the United States of America94:4925–4930DOI 10.1073/pnas.94.10.4925.
Saha S, Chant D, Welham J, McGrath J. 2005.A systematic review of the prevalence of schizophrenia.PLOS Medicine 2:e141DOI 10.1371/journal.pmed.0020141. Sawa A, Khan AA, Hester LD, Snyder SH. 1997.Glyceraldehyde-3-phosphate
dehy-drogenase: nuclear translocation participates in neuronal and nonneuronal cell death.Proceedings of the National Academy of Sciences of the United States of America 94:11669–11674DOI 10.1073/pnas.94.21.11669.
Silver N, Best S, Jiang J, Thein SL. 2006.Selection of housekeeping genes for gene expression studies in human reticulocytes using real-time PCR.BMC Molecular Biology7:33DOI 10.1186/1471-2199-7-33.
Sotelo-Silveira J, Crispino M, Puppo A, Sotelo JR, Koenig E. 2008.Myelinated axons contain beta-actin mRNA and ZBP-1 in periaxoplasmic ribosomal plaques and depend on cyclic AMP and F-actin integrity forin vitrotranslation.Journal of Neurochemistry 104:545–557DOI 10.1111/j.1471-4159.2007.04999.x.
Stevens JR, Miranda-Carboni GA, Singer MA, Brugger SM, Lyons KM, Lane TF. 2010. Wnt10b deficiency results in age-dependent loss of bone mass and progressive reduction of mesenchymal progenitor cells.Journal of Bone and Mineral Research 25:2138–2147DOI 10.1002/jbmr.118.
Stiles J, Jernigan TL. 2010.The basics of brain development.Neuropsychology Review 20:327–348DOI 10.1007/s11065-010-9148-4.
Sugiyama N, Andersson S, Lathe R, Fan X, Alonso-Magdalena P, Schwend T, Nalvarte I, Warner M, Gustafsson JA. 2009.Spatiotemporal dynamics of the expression of estrogen receptors in the postnatal mouse brain.Molecular Psychiatry14:223–232, 117DOI 10.1038/mp.2008.118.
Sun S, Del Rosario BC, Szanto A, Ogawa Y, Jeon Y, Lee JT. 2013.Jpx RNA activates Xist by evicting CTCF.Cell153:1537–1551DOI 10.1016/j.cell.2013.05.028.
Sur M, Rubenstein JL. 2005.Patterning and plasticity of the cerebral cortex.Science 310(5749):805–810DOI 10.1126/science.1112070.
Tang W, Eggertsen G, Chiang JY, Norlin M. 2006.Estrogen-mediated regulation of CYP7B1: a possible role for controlling DHEA levels in human tissues.Journal of Steroid Biochemistry and Molecular Biology100:42–51
DOI 10.1016/j.jsbmb.2006.02.005.
Veazey KJ, Golding MC. 2011.Selection of stable reference genes for quantitative rt-PCR comparisons of mouse embryonic and extra-embryonic stem cells.PLOS ONE 6:e27592DOI 10.1371/journal.pone.0027592.
Wu Z, Martin KO, Javitt NB, Chiang JY. 1999.Structure and functions of human oxysterol 7alpha-hydroxylase cDNAs and gene CYP7B1.Journal of Lipid Research 40:2195–2203.