Submitted1 June 2016 Accepted 11 August 2016 Published13 December 2016
Corresponding author Zhonglin Tang, [email protected], [email protected] Academic editor Cong-Jun Li
Additional Information and Declarations can be found on page 13
DOI10.7717/peerj.2428
Copyright 2016 Niu et al.
Distributed under
Creative Commons CC-BY 4.0
OPEN ACCESS
Identifying suitable reference genes for
gene expression analysis in developing
skeletal muscle in pigs
Guanglin Niu1,2,*, Yalan Yang1,2,*, YuanYuan Zhang1, Chaoju Hua1,
Zishuai Wang1, Zhonglin Tang1,2and Kui Li1,2
1The Key Laboratory for Domestic Animal Genetic Resources and Breeding of Ministry of Agriculture of China, Institute of Animal Science, Chinese Academy of Agricultural Sciences, Beijing, China 2Agricultural Genome Institute at Shenzhen, Chinese Academy of Agricultural Sciences, Shenzhen, China *These authors contributed equally to this work.
ABSTRACT
The selection of suitable reference genes is crucial to accurately evaluate and normalize the relative expression level of target genes for gene function analysis. However, commonly used reference genes have variable expression levels in developing skeletal muscle. There are few reports that systematically evaluate the expression stability of reference genes across prenatal and postnatal developing skeletal muscle in mammals. Here, we used quantitative PCR to examine the expression levels of 15 candidate
reference genes (ACTB,GAPDH, RNF7,RHOA,RPS18, RPL32,PPIA, H3F3,API5,
B2M, AP1S1, DRAP1, TBP, WSB, and VAPB) in porcine skeletal muscle at 26 different developmental stages (15 prenatal and 11 postnatal periods). We evaluated gene expression stability using the computer algorithms geNorm, NormFinder, and
BestKeeper. Our results indicated thatGAPDH andACTBhad the greatest variability
among the candidate genes across prenatal and postnatal stages of skeletal muscle
development.RPS18,API5, andVAPBhad stable expression levels in prenatal stages,
whereasAPI5,RPS18,RPL32, andH3F3had stable expression levels in postnatal stages.
API5 andH3F3expression levels had the greatest stability in all tested prenatal and
postnatal stages, and were the most appropriate reference genes for gene expression normalization in developing skeletal muscle. Our data provide valuable information for gene expression analysis during different stages of skeletal muscle development in mammals. This information can provide a valuable guide for the analysis of human diseases.
SubjectsAgricultural Science, Genetics, Genomics, Molecular Biology, Veterinary Medicine Keywords Expression analysis, Reference gene, Skeletal muscle, Development
INTRODUCTION
PCR analysis can be used to explore differences in gene expression at different developmental periods or under different conditions. The selection of appropriate reference genes for qPCR analysis can improve the accuracy and reproducibility of the study by normalizing the expression of target genes with respect to the expression of a selected
standard gene (Huggett et al., 2005). However, the qPCR method can be affected by
reaction parameters such as template quality, operating errors, and amplification efficiency (Bustin, 2002;Gabert et al., 2003;Ginzinger, 2002;Vandesompele et al., 2002;Wolffs et al., 2004;Yeung et al., 2004) Thus, qPCR data should be normalized with respect to one or more constitutively expressed reference or housekeeping genes, which corrects for experimental variability in some parameters.
Reference genes have to be validated and consistently expressed under various
circumstances. Widely used reference genes for expression analyses includeGAPDH,ACTB,
andHPRT (Blaha et al., 2015;Boosani, Dhar & Agrawal, 2015;Wang et al., 2016;Zhang et al., 2016b;Zhao et al., 2015). These genes are reported to have consistent expression levels
under various conditions such as different organs and different developmental stages (Tang
et al., 2007). However, expression of these selected reference genes has not proven to be as stable as originally presumed, and their expression can be highly variable under different conditions (Jain et al., 2006;Wan et al., 2010;Wang et al., 2015). Therefore, qPCR has
been used to identify appropriate reference genes in humans (Andersen, Jensen & Orntoft,
2004;Warrington et al., 2000), animals (McCulloch et al., 2012;Martinez-Giner et al., 2013;
Robledo et al., 2014;Tatsumi et al., 2008), and plants (Hu et al., 2009;Huis, Hawkins & Neutelings, 2010;Jain et al., 2006;Zemp, Minder & Widmer, 2014). In addition, the use of more than one reference gene might be necessary to accurately normalize gene expression levels and avoid relative errors (Jian et al., 2008;Ohl et al., 2005).
Skeletal muscle development is an important subject of biological research, and it plays
an important role in meat production and various diseases (Li et al., 2016a;Nixon et al.,
2016;Obata et al., 2016;Zabielski et al., 2016;Costa Junior et al., 2016;Fonvig et al., 2015;
Putti et al., 2015;Thivel et al., 2016). Studies of muscle development often explore gene expression under different conditions (Krist et al., 2015;Wang, Xiao & Wang, 2016;Zhang et al., 2016a;Zhang et al., 2015). The expressions of most genes display variable expression levels in prenatal and postnatal periods, and reference genes that are frequently used for other experiments are not suitable for studies of skeletal muscle development. Several
studies have been conducted to select reference genes in pigs (Li et al., 2016b;Monaco et
al., 2010;Park et al., 2015;Zhang et al., 2012;McCulloch et al., 2012). However, few studies have focused on reference genes in developing skeletal muscle from prenatal to postnatal periods (Wang et al., 2015). To identify and select better reference genes, it is necessary to evaluate the expression of more candidate genes during skeletal muscle development in both prenatal and postnatal periods. We hope to provide valuable information for gene expression analysis during different stages of skeletal muscle development in mammals, which may provide a valuable guide for the analysis of human diseases and a better understanding of muscle development.
reference genes for further analysis, includingACTB,API5,B2M,GAPDH,RNF7,H3F3,
PPIA,AP1S1,DRAP1,RHOA,RPS18,RPL32,TBP,WSB, andVAPB(Martino et al., 2011;
Uddin et al., 2011;Wang et al., 2015;Zhou, Liu & Zhuang, 2014). We collected samples of
longissimus dorsi(LD) muscles at 26 developmental stages (including 15 prenatal and 11 postnatal periods) in Landrace pigs (a typical lean-type western breed). The expression stability of these reference genes in the porcine muscle samples was evaluated using qPCR
analysis and the expression analysis programs NormFinder (Andersen, Jensen & Orntoft,
2004), BestKeeper (Pfaffl et al., 2004), and geNorm (Vandesompele et al., 2002).
MATERIALS AND METHODS
Sample collection, RNA extraction and next generation sequencing
All animals were sacrificed at a commercial slaughterhouse according to protocols approved by the Institutional Animal Care and Use Committee at the Institute of Animal Science,
Chinese Academy of Agricultural Sciences (Approval number: PJ2011-012-03).Longissimus
dorsi(LD) muscle samples were collected from Landrace fetuses on the following days post-coitum (dpc): 33, 40, 45, 50, 55, 60, 65, 70, 75, 80, 85, 90, 95, 100, and 105 dpc. LD muscle samples were collected from piglets on the following days after birth (dab): 0, 10, 20, 30, 40, 60, 80, 100, 140, 160, and 180 dab. Three biological replicates were collected at each time point, and totally 78 samples were collected. All samples were
immediately frozen in liquid nitrogen and stored at –80◦C until further processing. Total
RNA was extracted using TRIzol Reagent (Invitrogen, Carlsbad, CA, USA) according to the manufacturer’s instructions. RNA quantity and quality was determined by the Evolution 60 UV-Visible Spectrophotometer (Thermo Scientific). RNA preparations with an A260/A280
ratio of 1.8–2.1 and an A260/A230 ratio > 2.0 were selected for this assay. RNA integrity
was determined by analyzing the 28S/18S ribosomal RNA ratio on 1.5% agar gels. Only RNA preparations that resolved with three clear bands on these gels were used for the transcriptome sequencing and qPCR analysis.
Selection of candidate reference genes
For the purpose of identifying potential reference genes during skeletal muscle development,
candidate reference genes were selected according to previous studies (Martino et al.,
2011;Uddin et al., 2011;Wang et al., 2015;Zhou, Liu & Zhuang, 2014). The top 15 stably reference genes in the transcriptome data of skeletal muscle at different developmental stages based on the coefficient of variation (CV) were chosen for further gene-stability evaluation by qPCR method. Lower CV values represent genes with more stable expression in our transcriptome data.
cDNA synthesis
The cDNA synthesis was performed using the RevertAid First Strand cDNA Synthesis Kit (Thermo Scientific) according to the manufacturer’s instructions for reverse transcription
(RT) PCR. A mixture of 2 µg of total RNA and 1µL of random primer was incubated
at 65 ◦C for 5 min to dissociate the RNA secondary structure. Next, the following
Table 1 Primers for the 15 candidate reference genes of RT-qPCR data analysis.
Gene symbol Gene name Amplicon length(bp) References
API5 Apoptosis inhibitor 5 82 Tramontana et al. (2008)
AP1S1 AP-1 complex subunit sigma-1A 100 Tramontana et al. (2008)
B2M Beta-2-microglobulin 188 Wang et al. (2015)
DRAP1 Down-regulator of transcription 1-associated protein1 157 Wang et al. (2015)
GAPDH Glyceraldehyde 3-phosphate dehydrogenase 130 Park et al. (2015)
H3F3A H3 histone, family 3A 181 Wang et al. (2015)
PPIA Peptidyl-prolylisomerase A (cyclophilin A) 171 Uddin et al. (2011)
RHOA Ras homolog A 167 Wang et al. (2015)
RNF7 Ring finger protein 7 141 Wang et al. (2015)
RPL32 Ribosomal protein L32 145 Wang et al. (2015)
RPS18 Ribosomal protein S18 74 Park et al. (2015)
TBP TATA box binding protein 124 Martino et al. (2011)
WSB WD repeat and SOCS box-containing 157 Wang et al. (2015)
VAPB VAMP-associated protein B 100 Tramontana et al. (2008)
ACTB Beta-actin 120 Tramontana et al. (2008)
4µL of 5×RT buffer, 2µL of 10 nM dNTP, 1 µL of RevertAid Reverse Transcriptase
(200 U/µl) inhibitor, and 1 µL RiboLockRNase Inhibitor (20 U/µl). The reverse
transcription reaction was performed at 25 ◦
C for 5 min, followed by 42◦
C for 1 h
and 5 min at 70◦C. The cDNA was then diluted 7-fold, and stored at−20◦C until use.
qPCR with SYBR green
Each qPCR reaction was performed in a final reaction volume of 20µL containing 10µL
of SYBR Green Select Master Mix, 7µL of sterile water, 0.5µl of gene-specific primers, and
2µL of template cDNA. The PCR amplifications were performed on a 7500 Real-Time PCR
System (Applied Biosystems, Foster City, CA, USA) under the following cycling conditions: 95◦C for 5 min, followed by 40 cycles at 95◦C for 15 s and 60◦C for 45 s. Three independent
individuals at each time point were used for temporal and spatial analyses. Each qPCR reaction was performed in triplicate for technical repeats. The mean quantification cycle (Cq) value was used for further analysis. The primer sequences were according to or based
on those of previous reports as follows (Table 1):B2M,RHOA,RPL32,DRAP1 RNF7,
WSB, andH3F3(Wang et al., 2015);ACTB,AP1S1,API5, andVAPB(Tramontana et al.,
2008);GAPDH andRPS18(Park et al., 2015); andTBP andPPIA(Martino et al., 2011;
Uddin et al., 2011).
Analysis of gene expression stability
Gene expression data were transformed to relative quantities using geNorm and
NormFinder. GeNorm provided a measure of gene expression stability (M) (Vandesompele
et al., 2002;McCulloch et al., 2012)
Mj=
n
X
k=1
where:
Mj=gene stability measure,
Vjk=pairwise variation of genej relative to genek,
n=total number of number of examined genes.
Lower M values represent genes with more stable expression across specimens being compared and generated a ranking of the putative reference gene expression levels from the most stable (lowest M-values) to the least stable (highest M-values). GeNorm also generated a pairwise stability measure, which can be used to evaluate the suitable number of reference genes for normalization.
NormFinder provided a stability measure (SV), identified the most stable gene, and calculated the best combination of two reference genes. This program focuses on finding the two genes with the least intra- and inter-group expression variation or the most stable reference gene in intra-group expression variation. Genes with lower stability values show a stably expressed pattern, while the higher stability values share the least stably expressed pattern.
The BestKeeper program was used to compute the geometric mean of each candidate gene’s Cq value, to determine the most stably expressed genes based on correlation
coefficient (r) analysis for all pairs of candidate reference genes (≤10 genes), and to
calculate the percentage coefficient of variation (CV) and standard deviation (SD) using each candidate gene’s crossing point (CP) value (the quantification cycle value; Cq). In the BestKeeper program, genes with higher r values and lower CV and SD values are more stable reference genes.
RESULTS
Expression analysis of candidate reference genes in developing skeletal muscle
We performed qPCR assays to measure the expression levels of 15 candidate reference
genes (ACTB,API5,B2M,GAPDH,RNF7, H3F3,PPIA, AP1S1,PPIA,RHOA, RPS18,
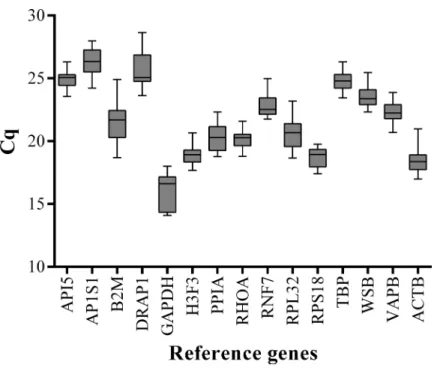
RPL32,TBP,WSB, andVAPB) in the LD muscle samples at 15 embryonic stages (33, 40, 45, 50, 55, 60, 65, 70, 75, 80, 85, 90, 95, 100, and 105 dpc) and 11 postnatal stages (0, 10, 20, 30, 40, 60, 80, 100, 140, 160, and 180 dab) of Landrace pigs. To minimize experimental error, triplicate amplifications were performed for individual experiments. The Cq values were computed to quantify the candidate reference gene expression levels. A higher Cq value means lower gene expression levels. Analysis of gene expression stability was based
on the Cq values generated by qPCR (Fig. 1). Among all the tested genes,GAPDH had
the lowest mean Cq value (15.94) andAP1S1had the highest mean Cq value (26.36). All
Figure 1 Box-and-whisker plot displaying the range of Cq values for each reference gene.The median is marked by the middle line in the box.
GeNorm analysis of candidate reference gene expression stability
We calculated the gene expression stability values (M value) for the 15 candidate reference genes using the geNorm program. Genes with lower M values have more consistent
expression levels. The M values of the candidate genes are presented inFig. 1. When all
developmental stages were analyzed as one data set. The results revealed that API5and
H3F3had the lowest M values, whereasGAPDH had the highest M value. This indicated
thatAPI5andH3F3were the most stably expressed gene pair of the 15 candidate reference
genes, whereasGAPDH had the most variable expression (Fig. 2) in developing skeletal
muscle across prenatal and postnatal periods. In the prenatal muscle samples,API5and
RPS18expression was the most stable, whereasGAPDH andDRAP1expression was the
most variable (Fig. 3). When only postnatal muscle samples were analyzed,API5andRPS18
expression was the most stable, whereasB2M expression was the most variable (Fig. 4).
The geNorm analysis demonstrated thatGAPDH was the most variably expressed gene in
all developmental periods, suggesting thatGAPDH was not a suitable reference gene for
gene expression analysis in developing skeletal muscle. By contrast, the stability ofAPI5,
RPS18, andH3F3expression suggested that they were suitable reference genes to use as internal controls. When gene expression was analyzed in developing skeletal muscle across
all tested prenatal and postnatal periods,API5expression was the most suitable to use as a
reference gene for normalization analysis in expression profiling studies.
Figure 2 Average expression stability (M) of 15 candidate reference genes and the best combination of two genes were calculated for 26 developmental periods.Lower M values indicate more stable expres-sion.
Figure 3 Average expression stability (M) of 15 candidate reference genes and the best combination of two genes were calculated for the prenatal periods.Lower M values indicate more stable expression.
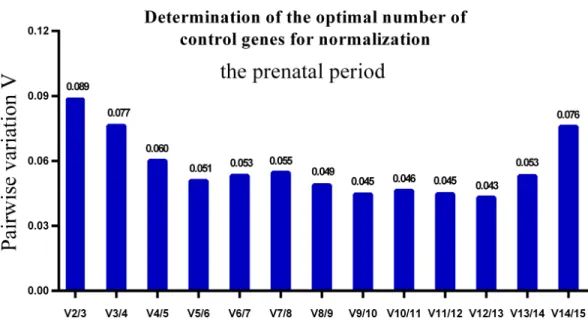
GeNorm was used to calculate the average pairwise variation (V) value between two sequential normalization factors; it has a cut-off value of 0.15 for the pairwise variation
according to the previous study (Wang et al., 2015), below which the inclusion of an
additional reference gene is not required for reliable normalization of qPCR analyses. When
all developmental stages were analyzed together, the Vn/Vn+1value ranged from 0.059 to
Figure 4 Average expression stability (M) of 15 candidate reference genes and the best combination of two genes were calculated for the postnatal period.Lower M values indicate more stable expression.
Figure 5 Determination of the optimal number of reference genes for normalization in the whole tested period.GeNorm was used to calculate the normalization factor (NF) from at least two genes; the variable V defines the pair-wise variation between two sequential NF values.
Figure 6 Determination of the optimal number of reference genes for normalization in prenatal peri-ods.GeNorm was used to calculate the normalization factor (NF) from at least two genes; the variable V defines the pair-wise variation between two sequential NF values.
Figure 7 Determination of the optimal number of reference genes for normalization in postnatal pe-riods.GeNorm was used to calculate the normalization factor (NF) from at least two genes; the variable V defines the pair-wise variation between two sequential NF values.
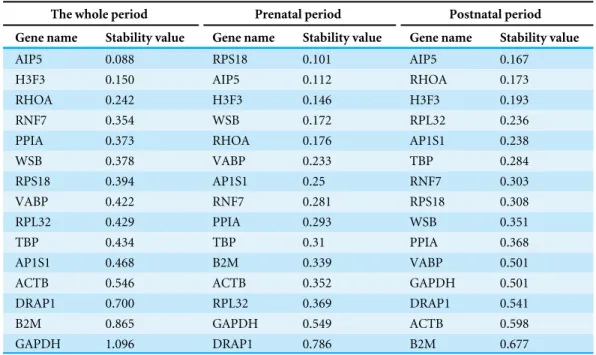
NormFinder analysis of candidate reference gene expression stability
Next, we used NormFinder to rank the most stable and the least stable genes by calculating the gene expression stability value and standard error. NormFinder analyses showed that
API5 was the most stable reference gene with the lowest stability value (SV=0.088) in
Table 2 Calculations of gene stability valueby NormFinder program.
Gene stability value calculations by NormFinder.
The whole period Prenatal period Postnatal period
Gene name Stability value Gene name Stability value Gene name Stability value
AIP5 0.088 RPS18 0.101 AIP5 0.167
H3F3 0.150 AIP5 0.112 RHOA 0.173
RHOA 0.242 H3F3 0.146 H3F3 0.193
RNF7 0.354 WSB 0.172 RPL32 0.236
PPIA 0.373 RHOA 0.176 AP1S1 0.238
WSB 0.378 VABP 0.233 TBP 0.284
RPS18 0.394 AP1S1 0.25 RNF7 0.303
VABP 0.422 RNF7 0.281 RPS18 0.308
RPL32 0.429 PPIA 0.293 WSB 0.351
TBP 0.434 TBP 0.31 PPIA 0.368
AP1S1 0.468 B2M 0.339 VABP 0.501
ACTB 0.546 ACTB 0.352 GAPDH 0.501
DRAP1 0.700 RPL32 0.369 DRAP1 0.541
B2M 0.865 GAPDH 0.549 ACTB 0.598
GAPDH 1.096 DRAP1 0.786 B2M 0.677
postnatal periods, whereasRPS18was the most stable reference gene in prenatal periods
(Table 2).
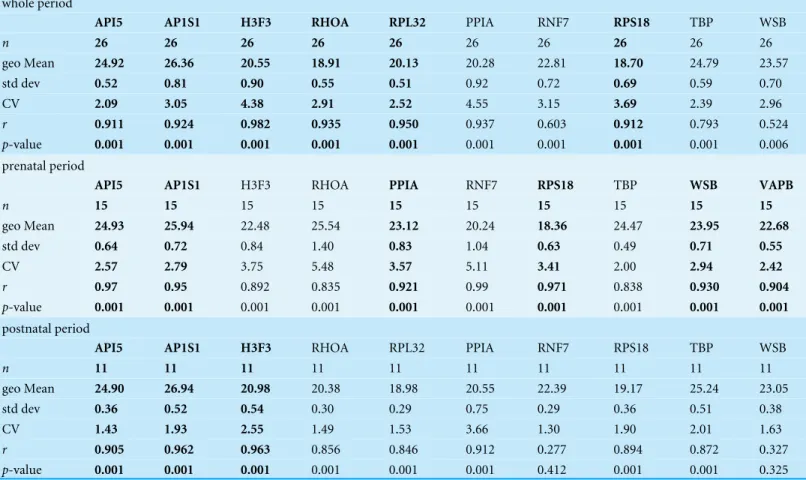
BestKeeper analysis of candidate reference gene expression stability
Then, BestKeeper program was used to evaluate the reference gene expression stability. We used BestKeeper to identify the optimal reference genes on the basis of the correlation
coefficient (r), CV, and SD values (Table 3). The program can calculater values for up to
10 genes. Therefore, we selected the top 10 candidate genes based on the previous results.
In the BestKeeper program, genes with higher r values (≥0.900) and lower CV and SD
values are considered as stable and suitable reference genes. In all tested developmental
periods,API5expression had the lowest CV value (2.09) and almost the lowest SD value
(it was slightly larger than that of RPL32expression). Therefore, we propose thatAPI5
is the most suitable reference gene for expression analysis of developing skeletal muscle
during the tested prenatal and postnatal stages.API5also was selected as the most stable
gene during the postnatal period, whereasVAPBwas the most stable gene for the analysis
of developing skeletal muscle during the embryonic period.
DISCUSSION
Studies of muscle development are important to improve meat production, to understand human diseases like diabetes (Li et al., 2016a;Nixon et al., 2016;Obata et al., 2016;Zabielski et al., 2016) and obesity (Costa Junior et al., 2016;Fonvig et al., 2015;Putti et al., 2015;
Table 3 Expression stability analysis of the reference genes by BestKeeper.
whole period
API5 AP1S1 H3F3 RHOA RPL32 PPIA RNF7 RPS18 TBP WSB
n 26 26 26 26 26 26 26 26 26 26
geo Mean 24.92 26.36 20.55 18.91 20.13 20.28 22.81 18.70 24.79 23.57
std dev 0.52 0.81 0.90 0.55 0.51 0.92 0.72 0.69 0.59 0.70
CV 2.09 3.05 4.38 2.91 2.52 4.55 3.15 3.69 2.39 2.96
r 0.911 0.924 0.982 0.935 0.950 0.937 0.603 0.912 0.793 0.524
p-value 0.001 0.001 0.001 0.001 0.001 0.001 0.001 0.001 0.001 0.006
prenatal period
API5 AP1S1 H3F3 RHOA PPIA RNF7 RPS18 TBP WSB VAPB
n 15 15 15 15 15 15 15 15 15 15
geo Mean 24.93 25.94 22.48 25.54 23.12 20.24 18.36 24.47 23.95 22.68
std dev 0.64 0.72 0.84 1.40 0.83 1.04 0.63 0.49 0.71 0.55
CV 2.57 2.79 3.75 5.48 3.57 5.11 3.41 2.00 2.94 2.42
r 0.97 0.95 0.892 0.835 0.921 0.99 0.971 0.838 0.930 0.904
p-value 0.001 0.001 0.001 0.001 0.001 0.001 0.001 0.001 0.001 0.001
postnatal period
API5 AP1S1 H3F3 RHOA RPL32 PPIA RNF7 RPS18 TBP WSB
n 11 11 11 11 11 11 11 11 11 11
geo Mean 24.90 26.94 20.98 20.38 18.98 20.55 22.39 19.17 25.24 23.05
std dev 0.36 0.52 0.54 0.30 0.29 0.75 0.29 0.36 0.51 0.38
CV 1.43 1.93 2.55 1.49 1.53 3.66 1.30 1.90 2.01 1.63
r 0.905 0.962 0.963 0.856 0.846 0.912 0.277 0.894 0.872 0.327
p-value 0.001 0.001 0.001 0.001 0.001 0.001 0.412 0.001 0.001 0.325
performing gene expression analysis (Krist et al., 2015;Wang, Xiao & Wang, 2016;Zhang et al., 2016a;Zhang et al., 2015). However, it is crucial to select accurate reference genes to normalize target gene expression levels during skeletal muscle development in mammals. A number of different genes have been commonly used for normalizing gene expression in
skeletal muscle, includingACTBandGAPDH. It was assumed that the expression of these
genes was perfectly stable. However, many experiments have shown that these reference
genes have variable expression levels in developing skeletal muscle (Wang et al., 2015;
Selvey et al., 2001).
Many researchers have studied the suitable reference genes in pig skeletal muscle. For
example,Feng et al. (2010)found thatPPIAandHPRTwere the most stable reference genes
for gene expression studies in LD muscles of postnatal Yorkshire pigs.Wang et al. (2015)
reported thatDRAP1andRNF7 were the most appropriate combination of reference
We selected 15 candidate reference genes and performed qPCR analysis of their mRNA expression. The results analyzed by three different algorithms (NormFinder, BestKeeper,
and geNorm) showed that apoptosis inhibitor 5 (API5) was the best candidate reference
gene for normalizing target gene expression in developing skeletal muscle across the
tested prenatal and postnatal periods. API5 is highly conserved across species from
microorganisms to plants and animals (Li et al., 2011;Mayank et al., 2015;Noh et al., 2014).
AP15has an important role in negative regulation of apoptotic processes in fibroblasts
(Kim et al., 2000;Noh et al., 2014). This gene encodes an inhibitory protein that prevents
apoptosis after growth factor deprivation. TheAPI5protein suppresses apoptosis induced
by the transcription factor E2F1, and interacts with and negatively regulates Acinus, a
nuclear factor involved in apoptotic DNA fragmentation. TheAPI5gene is involved in
many human diseases including diabetes and cancers (Cho et al., 2014;Noh et al., 2014;
Peng et al., 2015;Ramdas et al., 2011). However,API5has not been reported to be involved
in skeletal muscle development. We hypothesize thatAPI5may play an important role in
skeletal muscle development as a housekeeping gene, based on the observed constitutive expression across prenatal and postnatal developing skeletal muscle in pigs.
Park et al. (2015)examined the expression stability of different genes in various tissues,
and found thatPPIA,TBP,RPL4, andRPS18were the suitable reference genes in Landrace
pigs (Park et al., 2015). Our results are consistent with these conclusions. The combination
of DRAP1and WSB2 is appropriate for the whole tested developmental period in
Tongcheng pigs (an obese-type Chinese native breed) (Wang et al., 2015), whereas our
study showed thatDRAP1andRNF7 were unsuitable as reference genes in prenatal and
postnatal developmental periods in Landrace pigs. These differences may be caused by the developmental stages tested, or that we tested more developmental stages in our study.
H3F3was reported as a suitable reference gene in the prenatal period in Tongcheng pigs,
which was consistent with the results of our study.
We previously reported thatRPL32,RPS18, andH3F3were the most stable reference
genes in 33, 65, and 90 dpc skeletal muscle in Landrace pigs (Zhang et al., 2012). The
current results also identify these genes as suitable reference genes for normalizing target gene expression in developing skeletal muscle during the prenatal periods. We selected candidate reference genes during skeletal muscle development based on transcriptome data and previous studies, which might provide a new clue for evaluating the stability of candidate reference genes. Combined with multiple methods, our evaluated results would be more precious and accurate. However, our present work only evaluated these candidate references on the Landrace pigs. Further studies are needed to further evaluate the stability of these genes during skeletal muscle development at other pig breeds and mammals.
CONCLUSION
Our study evaluated the expression stability of 15 candidate reference genes in LD skeletal muscle across 26 prenatal and postnatal developmental periods in Landrace pigs. We
found that the commonly used reference genes (GAPDH andACTB) were not suitable as
discovered reference gene, was the most suitable reference gene for all tested periods and
muscle samples.RPL32,RPS18,VAPB, andH3F3also were suitable as reference genes in
developing skeletal muscle. Our data provide a guide for choosing appropriate reference genes for studies on skeletal muscle development and diseases in humans and other mammals.
ADDITIONAL INFORMATION AND DECLARATIONS
Funding
This work was supported by the National Key Project (2016ZX08009003-006-003), the National Natural Science Foundation of China (31372295 and 31330074), and the Agricultural Science and Technology Innovation Program (ASTIP-IAS16). The funders had no role in study design, data collection and analysis, decision to publish, or preparation of the manuscript.
Grant Disclosures
The following grant information was disclosed by the authors: National Key Project: 2016ZX08009003-006-003.
National Natural Science Foundation of China: 31372295, 31330074. Agricultural Science and Technology Innovation Program: ASTIP-IAS16.
Competing Interests
The authors declare there are no competing interests.
Author Contributions
• Guanglin Niu conceived and designed the experiments, performed the experiments,
analyzed the data, contributed reagents/materials/analysis tools, wrote the paper, prepared figures and/or tables, reviewed drafts of the paper.
• Yalan Yang analyzed the data, contributed reagents/materials/analysis tools, wrote the
paper, reviewed drafts of the paper.
• YuanYuan Zhang performed the experiments, contributed reagents/materials/analysis
tools, reviewed drafts of the paper.
• Chaoju Hua, Zishuai Wang and Kui Li reviewed drafts of the paper.
• Zhonglin Tang conceived and designed the experiments, wrote the paper, reviewed
drafts of the paper.
Animal Ethics
The following information was supplied relating to ethical approvals (i.e., approving body and any reference numbers):
Animal euthanasia was performed according to protocols approved by Institutional Animal Care and Use Committee at the Institute of Animal Science, Chinese Academy of Agricultural Sciences Approval number: PJ2011-012-03.
Data Availability
The following information was supplied regarding data availability:
Supplemental Information
Supplemental information for this article can be found online athttp://dx.doi.org/10.7717/
peerj.2428#supplemental-information.
REFERENCES
Andersen CL, Jensen JL, Orntoft TF. 2004.Normalization of real-time quantitative
reverse transcription-PCR data: a model-based variance estimation approach to identify genes suited for normalization, applied to bladder and colon cancer data
sets.Cancer Research64:5245–5250DOI 10.1158/0008-5472.CAN-04-0496.
Blaha M, Nemcova L, Kepkova KV, Vodicka P, Prochazka R. 2015.Gene expression
analysis of pig cumulus-oocyte complexes stimulatedin vitrowith follicle stimulating
hormone or epidermal growth factor-like peptides.Reproductive Biology and
Endocrinology13:113–129DOI 10.1186/s12958-015-0112-2.
Boosani CS, Dhar K, Agrawal DK. 2015.Down-regulation of hsa-miR-1264 contributes
to DNMT1-mediated silencing of SOCS3.Molecular Biology Reports42:1365–1376
DOI 10.1007/s11033-015-3882-x.
Bustin SA. 2002.Quantification of mRNA using real-time reverse transcription PCR
(RT-PCR): trends and problems.Journal of Molecular Endocrinology29:23–39
DOI 10.1677/jme.0.0290023.
Cho H, Chung JY, Song KH, Noh KH, Kim BW, Chung EJ, Ylaya K, Kim JH, Kim TW,
Hewitt SM, Kim JH. 2014.Apoptosis inhibitor-5 overexpression is associated with
tumor progression and poor prognosis in patients with cervical cancer.BMC Cancer
14:545 DOI 10.1186/1471-2407-14-545.
Costa Junior D, Peixoto-Souza FS, Araujo PN, Barbalho-Moulin MC, Alves VC, Gomes
EL, Costa D. 2016.Influence of body composition on lung function and respiratory
muscle strength in children with obesity.Journal of Clinical Medicine Research
8:105–110DOI 10.14740/jocmr2382w.
Feng XT, Xiong YZ, Qian H, Lei MG, Xu DQ, Ren ZQ. 2010.Selection of reference
genes for gene expression studies in porcine skeletal muscle using SYBR green qPCR.
Journal of Biotechnology150:288–293.
Fonvig CE, Chabanova E, Ohrt JD, Nielsen LA, Pedersen O, Hansen T, Thomsen HS,
Holm JC. 2015.Multidisciplinary care of obese children and adolescents for one
year reduces ectopic fat content in liver and skeletal muscle.BMC Pediatrics15:196
DOI 10.1186/s12887-015-0513-6.
Gabert J, Beillard E, Van der Velden VHJ, Bi W, Grimwade D, Pallisgaard N, Barbany G, Cazzaniga G, Cayuela JM, Cave H, Pane F, Aerts JLE, De Micheli D, Thirion X, Pradel V, Gonzalez M, Viehmann S, Malec M, Saglio G, Van Dongen JJM.
2003.Standardization and quality control studies of ‘real-time’ quantitative reverse
transcriptase polymerase chain reaction of fusion gene transcripts for residual disease
detection in leukemia—a Europe Against Cancer program.Leukemia17:2318–2357
Ginzinger DG. 2002.Gene quantification using real-time quantitative PCR: an
emerging technology hits the mainstream.Experimental Hematology 30:503–512
DOI 10.1016/S0301-472X(02)00806-8.
Hu RB, Fan CM, Li HY, Zhang QZ, Fu YF. 2009.Evaluation of putative reference genes
for gene expression normalization in soybean by quantitative real-time RT-PCR.
BMC Molecular Biology 10:93DOI 10.1186/1471-2199-10-93.
Huggett J, Dheda K, Bustin S, Zumla A. 2005.Real-time RT-PCR normalisation;
strategies and considerations.Genes and Immunity6:279–284
DOI 10.1038/sj.gene.6364190.
Huis R, Hawkins S, Neutelings G. 2010.Selection of reference genes for quantitative
gene expression normalization in flax (Linum usitatissimum L.).BMC Plant Biology
10:71DOI 10.1186/1471-2229-10-71.
Jain M, Nijhawan A, Tyagi AK, Khurana JP. 2006.Validation of housekeeping genes
as internal control for studying gene expression in rice by quantitative
real-time PCR.Biochemical and Biophysical Research Communications345:646–651
DOI 10.1016/j.bbrc.2006.04.140.
Jian B, Liu B, Bi YR, Hou WS, Wu CX, Han TF. 2008.Validation of internal control for
gene expression study in soybean by quantitative real-time PCR.BMC Molecular
Biology9:59DOI 10.1186/1471-2199-9-59.
Kim JW, Cho HS, Kim JH, Hur SY, Kim TE, Lee JM, Kim IK, Namkoong SE. 2000. AAC-11 overexpression induces invasion and protects cervical cancer cells from
apoptosis.Laboratory Investigation80:587–594 DOI 10.1038/labinvest.3780063.
Krist B, Florczyk U, Pietraszek-Gremplewicz K, Józkowicz A, Dulak J. 2015.The role of
miR-378a in metabolism, angiogenesis, and muscle biology.International Journal of
Endocrinology2015:Article 281756DOI 10.1155/2015/281756.
Li J, Chen T, Li K, Yan HT, Li XW, Yang Y, Zhang YL, Su BY, Li FX. 2016a.Neurolytic
celiac plexus block enhances skeletal muscle insulin signaling and attenuates insulin
resistance in GK rats.Experimental and Therapeutic Medicine11:2033–2041.
Li X, Huang K, Chen F, Li W, Sun S, Shi XE, Yang G. 2016b.Verification of suitable and
reliable reference genes for quantitative real-time PCR during adipogenic
differentia-tion in porcine intramuscular stromal-vascular cells.Animal10(06):947–952.
Li XW, Gao XQ, Wei Y, Deng L, Ouyang YD, Chen GX, Li XH, Zhang QF, Wu CY.
2011.Rice APOPTOSIS INHIBITOR5 coupled with two DEAD-box adenosine
5’-triphosphate-dependent RNA helicases regulates tapetum degeneration.The Plant
Cell23:1416–1434DOI 10.1105/tpc.110.082636.
Mackay IM. 2004.Real-time PCR in the microbiology laboratory.Clinical Microbiology
and Infection10:190–212DOI 10.1111/j.1198-743X.2004.00722.x.
Martinez-Giner M, Noguera JL, Balcells I, Fernandez-Rodriguez A, Pena RN. 2013. Selection of internal control genes for real-time quantitative PCR in ovary and uterus
of sows across pregnancy.PLoS ONE8:e66023
Martino A, Cabiati M, Campan M, Prescimone T, Minocci D, Caselli C, Rossi AM,
Giannessi D, Del Ry S. 2011.Selection of reference genes for normalization of
real-time PCR data in minipig heart failure model and evaluation of TNF-alpha mRNA
expression.Journal of Biotechnology153:92–99DOI 10.1016/j.jbiotec.2011.04.002.
Mayank AK, Sharma S, Nailwal H, Lal SK. 2015.Nucleoprotein of influenza A virus
negatively impacts antiapoptotic protein API5 to enhance E2F1-dependent apoptosis
and virus replication.Cell Death & Disease6:E2018 DOI 10.1038/cddis.2015.360.
McCulloch RS, Ashwell MS, O’Nan AT, Mente PL. 2012.Identification of stable
normalization genes for quantitative real-time PCR in porcine articular cartilage.
Journal of Animal Science and Biotechnology3:36DOI 10.1186/2049-1891-3-36.
Monaco E, Bionaz M, De Lima AS, Hurley WL, Loor JJ, Wheeler MB. 2010.Selection
and reliability of internal reference genes for quantitative PCR verification of transcriptomics during the differentiation process of porcine adult mesenchymal stem cells.Stem Cell Research & Therapy1:7DOI 10.1186/scrt7.
Nixon M, Stewart-Fitzgibbon R, Fu J, Akhmedov D, Rajendran K, Mendoza-Rodriguez MG, Rivera-Molina YA, Gibson M, Berglund ED, Justice NJ, Berdeaux R. 2016. Skeletal muscle salt inducible kinase 1 promotes insulin resistance in obesity.
Molecular Metabolism5:34–46DOI 10.1016/j.molmet.2015.10.004.
Noh KH, Kim SH, Kim JH, Song KH, Lee YH, Kang TH, Han HD, Sood AK, Ng J,
Kim K, Sonn CH, Kumar V, Yee C, Lee KM, Kim TW. 2014.API5 confers tumoral
immune escape through FGF2-dependent cell survival pathway.Cancer Research
74:3556–3566DOI 10.1158/0008-5472.CAN-13-3225.
Obata A, Kubota N, Kubota T, Iwamoto M, Sato H, Sakurai Y, Takamoto I, Kat-suyama H, Suzuki Y, Fukazawa M, Ikeda S, Iwayama K, Tokuyama K, Ueki K,
Kadowaki T. 2016.Tofogliflozin improves insulin resistance in skeletal muscle and
accelerates lipolysis in adipose tissue in male mice.Endocrinology157:1029–1042
DOI 10.1210/en.2015-1588.
Ohl F, Jung M, Xu CL, Stephan C, Rabien A, Burkhardt M, Nitsche A, Kristiansen
G, Loening SA, Radonic A, Jung K. 2005.Gene expression studies in prostate
cancer tissue: which reference gene should be selected for normalization?Journal of
Molecular Medicine83:1014–1024DOI 10.1007/s00109-005-0703-z.
Park SJ, Kwon SG, Hwang JH, Park da H, Kim TW, Kim CW. 2015.Selection of
appropriate reference genes for RT-qPCR analysis in Berkshire, Duroc, Landrace,
and Yorkshire pigs.Gene 558:152–158DOI 10.1016/j.gene.2014.12.052.
Peng DF, Wang J, Zhang R, Jiang F, Tang SS, Chen M, Yan J, Sun X, Wang SY,
Wang T, Yan DD, Bao YQ, Hu C, Jia WP. 2015.Common variants in or
near ZNRF1, COLEC12, SCYL1BP1 and API5 are associated with diabetic
retinopathy in Chinese patients with type 2 diabetes.Diabetologia58:1231–1238
DOI 10.1007/s00125-015-3569-9.
Pfaffl MW, Tichopad A, Prgomet C, Neuvians TP. 2004.Determination of stable
BestKeeper—Excel-based tool using pair-wise correlations.Biotechnology Letters
26:509–515DOI 10.1023/B:BILE.0000019559.84305.47.
Putti R, Migliaccio V, Sica R, Lionetti L. 2015.Skeletal muscle mitochondrial
bioenerget-ics and morphology in high fat diet induced obesity and insulin resistance: focus on dietary fat source.Frontiers in Physiology6:426.
Ramdas P, Rajihuzzaman M, Veerasenan SD, Selvaduray KR, Nesaretnam K,
Radhakr-ishnan AK. 2011.Tocotrienol-treated MCF-7 human breast cancer cells show
down-regulation of API5 and up-down-regulation of MIG6 genes.Cancer Genomics & Proteomics
8:19–31.
Robledo D, Hernandez-Urcera J, Cal RM, Pardo BG, Sanchez L, Martinez P, Vinas
A. 2014.Analysis of qPCR reference gene stability determination methods and a
practical approach for efficiency calculation on a turbot (Scophthalmus maximus)
gonad dataset.BMC Genomics15:648DOI 10.1186/1471-2164-15-648.
Selvey S, Thompson EW, Matthaei K, Lea RA, Irving MG, Griffiths LR. 2001.β
-Actin—an unsuitable internal control for RT-PCR.Molecular and Cellular Probes
15:307–311DOI 10.1006/mcpr.2001.0376.
Tang Z, Li Y, Wan P, Li X, Zhao S, Liu B, Fan B, Zhu M, Yu M, Li K. 2007.LongSAGE
analysis of skeletal muscle at three prenatal stages in Tongcheng and Landrace pigs.
Genome Biology8(6):R115.
Tatsumi K, Ohashi K, Taminishi S, Okano T, Yoshioka A, Shima M. 2008.Reference
gene selection for real-time RT-PCR in regenerating mouse livers.Biochemical and
Biophysical Research Communications374:106–110DOI 10.1016/j.bbrc.2008.06.103.
Thivel D, Ring-Dimitriou S, Weghuber D, Frelut ML, O’Malley G. 2016.Muscle
strength and fitness in pediatric obesity: a systematic review from the European
childhood obesity group.Obesity Facts9:52–63DOI 10.1159/000443687.
Tramontana S, Bionaz M, Sharma A, Graugnard DE, Cutler EA, Ajmone-Marsan
P, Hurley WL, Loor JJ. 2008.Internal controls for quantitative polymerase chain
reaction of swine mammary glands during pregnancy and lactation.Journal of Dairy
Science91:3057–3066DOI 10.3168/jds.2008-1164.
Uddin MJ, Cinar MU, Tesfaye D, Looft C, Tholen E, Schellander K. 2011.Age-related
changes in relative expression stability of commonly used housekeeping genes in
selected porcine tissues.BMC Research Notes4:441DOI 10.1186/1756-0500-4-441.
Valasek MA, Repa JJ. 2005.The power of real-time PCR.Advances in Physiology
Education29:151–159 DOI 10.1152/advan.00019.2005.
Vandesompele J, De Preter K, Pattyn F, Poppe B, Van Roy N, De Paepe A, Speleman F.
2002.Accurate normalization of real-time quantitative RT-PCR data by geometric
averaging of multiple internal control genes.Genome Biology3:1–12.
Wan HJ, Zhao ZG, Qian CT, Sui YH, Malik AA, Chen JF. 2010.Selection of
ap-propriate reference genes for gene expression studies by quantitative real-time
polymerase chain reaction in cucumber.Analytical Biochemistry399:257–261
Wang WW, Liu Y, Wang HF, Ding XD, Liu JF, Yu Y, Zhang Q. 2016.A genomic variant
in IRF9 is associated with serum cytokine levels in pig.Immunogenetics68:67–76
DOI 10.1007/s00251-015-0879-5.
Wang Y, Xiao X, Wang LJ. 2016.Molecular characterization and expression patterns of
emerin (EMD) gene in skeletal muscle between Meishan and Large White pigs.Gene
579:41–46DOI 10.1016/j.gene.2015.12.059.
Wang YY, Zhao YQ, Li J, Liu HJ, Ernst CW, Liu XR, Liu GR, Xi Y, Lei MG. 2015. Evaluation of housekeeping genes for normalizing real-time quantitative PCR
assays in pig skeletal muscle at multiple developmental stages.Gene565:235–241
DOI 10.1016/j.gene.2015.04.016.
Warrington JA, Nair A, Mahadevappa M, Tsyganskaya M. 2000.Comparison of human
adult and fetal expression and identification of 535 housekeeping/maintenance
genes.Physiological Genomics2:143–147.
Wolffs P, Grage H, Hagberg O, Radstrom P. 2004.Impact of DNA polymerases and
their buffer systems on quantitative real-time PCR.Journal of Clinical Microbiology
42:408–411DOI 10.1128/JCM.42.1.408-411.2004.
Yeung AT, Holloway BP, Adams PS, Shipley GL. 2004.Evaluation of dual-labeled
fluorescent DNA probe purity versus performance in real-time PCR.Biotechniques
36:266–275.
Zabielski P, Lanza IR, Gopala S, Holtz Heppelmann CJ, Bergen 3rd HR, Dasari S,
Nair KS. 2016.Altered skeletal muscle mitochondrial proteome as the basis of
disruption of mitochondrial function in diabetic mice.Diabetes65:561–573
DOI 10.2337/db15-0823.
Zemp N, Minder A, Widmer A. 2014.Identification of internal reference genes for gene
expression normalization between the two sexes in dioecious white campion.PLoS
ONE9:e92893DOI 10.1371/journal.pone.0092893.
Zhang YD, Chen BN, Ming L, Qin HS, Zheng L, Yue Z, Cheng ZX, Wang YN, Zhang
DW, Liu CM, Bin W, Hao QZ, Song FC, Ji B. 2015.MicroRNA-141 inhibits vascular
smooth muscle cell proliferation through targeting PAPP-A.International Journal of
Clinical and Experimental Pathology8:14401–14408.
Zhang P, Hou SY, Chen JC, Zhang JS, Lin FY, Ju RJ, Cheng X, Ma XW, Song Y, Zhang
YY, Zhu MS, Du J, Lan Y, Yang X. 2016a.Smad4 deficiency in smooth muscle
cells initiates the formation of aortic aneurysm.Circulation Research118:388–399
DOI 10.1161/CIRCRESAHA.115.308040.
Zhang YX, Li WT, Zhu MF, Li Y, Xu ZY, Zuo B. 2016b.FHL3 differentially regulates the
expression of MyHC isoforms through interactions with MyoD and pCREB.Cellular
Signalling 28:60–73DOI 10.1016/j.cellsig.2015.10.008.
Zhang J, Tang ZL, Wang N, Long LQ, Li K. 2012.Evaluating a set of reference genes
for expression normalization in multiple tissues and skeletal muscle at different development stages in pigs using quantitative real-time polymerase chain reaction.
Zhao W, Mu Y, Ma L, Wang C, Tang Z, Yang S, Zhou R, Hu X, Li MH, Li K. 2015. Systematic identification and characterization of long intergenic non-coding RNAs
in fetal porcine skeletal muscle development.Scientific Reports5:8957
DOI 10.1038/srep08957.
Zhou XH, Liu J, Zhuang Y. 2014.Selection of appropriate reference genes in eggplant
for quantitative gene expression studies under different experimental conditions.