ACPD
9, 13093–13122, 2009New-particle formation in near-coastal forests
T. Suni et al.
Title Page
Abstract Introduction
Conclusions References
Tables Figures
◭ ◮
◭ ◮
Back Close
Full Screen / Esc
Printer-friendly Version
Interactive Discussion
Atmos. Chem. Phys. Discuss., 9, 13093–13122, 2009 www.atmos-chem-phys-discuss.net/9/13093/2009/ © Author(s) 2009. This work is distributed under the Creative Commons Attribution 3.0 License.
Atmospheric Chemistry and Physics Discussions
This discussion paper is/has been under review for the journalAtmospheric Chemistry
and Physics (ACP). Please refer to the corresponding final paper inACPif available.
Cold oceans enhance terrestrial
new-particle formation in near-coastal
forests
T. Suni1, L. Sogacheva1, J. Lauros1, H. Hakola2, J. B ¨ack3, T. Kurt ´en1, H. Cleugh4,
E. van Gorsel4, P. Briggs4, S. Sevanto1, and M. Kulmala1
1
Department of Physics, University of Helsinki, P.O. Box 64, 00014 Helsinki, Finland
2
Finnish Meteorological Institute, P.O. Box 503, 00101 Helsinki, Finland
3
Department of Forest Ecology, P.O. Box 27, 00014 University of Helsinki, Finland
4
CSIRO Marine and Atmospheric Research, GPO Box 1666, Canberra ACT 2601, Australia
Received: 3 April 2009 – Accepted: 2 June 2009 – Published: 11 June 2009
Correspondence to: T. Suni ([email protected])
ACPD
9, 13093–13122, 2009New-particle formation in near-coastal forests
T. Suni et al.
Title Page
Abstract Introduction
Conclusions References
Tables Figures
◭ ◮
◭ ◮
Back Close
Full Screen / Esc
Printer-friendly Version
Interactive Discussion
Abstract
The world’s forests produce atmospheric aerosol by emitting volatile organic com-pounds (VOC) which, after being oxidized in the atmosphere, readily condense on the omnipresent nanometer-sized nuclei and grow them to climatically relevant sizes. The cooling effect of aerosols is the greatest uncertainty in current climate models and es-5
timates of radiative forcing. Therefore, identifying the environmental factors influencing the biogenic formation of aerosols is crucial. We show that, in addition to local me-teorological factors in the forest, the magnitude of evaporation from oceans hundreds of kilometers upwind can effectively suppress or enhance new-particle formation. Our findings indicate that, unlike warm waters, the cold polar oceans provide excellent clean 10
and dry background air that enhances aerosol formation above near-coastal forests in Fennoscandia and South-East Australia.
1 Introduction
The direct and indirect effects of aerosol particles on climate are the largest uncertainty in current climate models and estimates of radiative forcing. Aerosols are produced 15
by human activity but they are also formed naturally in oceans, deserts, and forests. Vegetation emits volatile organic compounds (VOC) such as monoterpenes that, once oxidised in the atmosphere, readily condense on freshly nucleated nanometer-sized particles and participate in growing them to cloud condensation nucleus (CCN) sizes (50–100 nm). During the last decade, new-particle formation (NPF), the production of 20
new aerosol particles by nucleation and subsequent nuclei growth, has proved to be a frequent phenomenon that takes place in most atmospheric environments and is able to affect particle number concentrations at regional and even global scales (Kulmala et al., 2004; Spracklen et al., 2006). Newly formed particles regularly grow to CCN sizes influencing cloud properties and thereby the Earth’s radiative balance and climate 25
ACPD
9, 13093–13122, 2009New-particle formation in near-coastal forests
T. Suni et al.
Title Page
Abstract Introduction
Conclusions References
Tables Figures
◭ ◮
◭ ◮
Back Close
Full Screen / Esc
Printer-friendly Version
Interactive Discussion
frequency and driving factors of biogenic aerosol production in different ecosystems is crucial for the future development of climate models. However, despite several attempts to identify the main environmental factors affecting biogenic new-particle formation, the evidence is still largely controversial.
Water vapor affects the biological, physical, and chemical aspects of particle forma-5
tion. High relative humidity (RH) is often linked with cloudy and rainy days with weak solar radiation and cool temperatures when new-particle formation is typically not ob-served (Nilsson et al., 2001; Buzorius et al., 2001; Suni et al., 2008). The emissions of terpenes, precursors of forest aerosols, are related to temperature and sometimes directly to solar radiation (Kesselmeier and Stadt, 1999). Also the production of OH, 10
an important atmospheric oxidant, is driven by solar radiation, so cloudy days lead to weaker terpene and OH production than sunny days. High humidity can also increase the condensational and coagulation sinks (CS and CoagS, respectively) formed by pre-existing larger particles. This pre-existing aerosol forms a large total surface that consumes condensable vapors and scavenges molecular clusters effectively. As a 15
function of humidity, pre-existing particles grow hygroscopically increasing CS and Co-agS and potentially suppress new particle formation (Hyv ¨onen et al., 2005). Indeed, RH and pre-existing aerosol particle surface have been shown to explain 88% of the new-particle formation events in a Finnish pine forest (Hyv ¨onen et al., 2005).
The small concentration of pre-existing particles (low CS and CoagS) in the air ar-20
riving from the Arctic Ocean makes Arctic and Polar air masses very conducive to ter-restrial aerosol formation once they collect condensable vapors while traveling above the boreal forest (Tunved et al., 2006). Determining the effects of other oceanic air properties such as temperature and humidity on aerosol formation has been difficult because a rural field site close to two different oceans in directions equally free from 25
ACPD
9, 13093–13122, 2009New-particle formation in near-coastal forests
T. Suni et al.
Title Page
Abstract Introduction
Conclusions References
Tables Figures
◭ ◮
◭ ◮
Back Close
Full Screen / Esc
Printer-friendly Version
Interactive Discussion
Finding a remote, forested field site close to two different oceans with contrasting char-acteristics is very difficult.
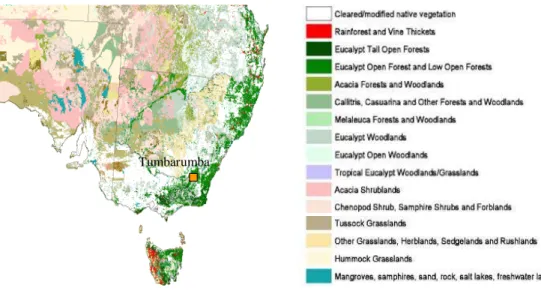
The Tumbarumba field station in South-East Australia meets those requirements and is therefore an excellent place to study the effect of air masses on aerosol formation, as indicated by the map in Fig. 1. The area is largely forested and faces the warm Pacific 5
Ocean in the east and the cold Southern Ocean in the south. The east and south coasts both have only two significant cities, Sydney and Brisbane at the Pacific coast and Melbourne and Adelaide in the south. Otherwise the coastal population is small and the inlands are sparsely inhabited. Air masses arriving from both coasts travel first over an ocean and then over a mixture of agricultural fields, grasslands, pastures, 10
and mountains covered mainly by Eucalypt forests. The Tumbarumba flux station is located in the center of the fertile forested mountains, half-way between Melbourne and Sydney. High frequencies of day- and night-time new-particle formation in the range 0.34–40 nm were observed there during July 2005–October 2006 (Suni et al., 2008). In this paper, we connect daytime formation events observed during July 2005– 15
December 2006 to air mass history using 96-h back trajectories.
2 Materials and methods
2.1 Site description
The Tumbarumba flux station is located in the Bago State forest in south eastern New South Wales: 35◦39′20.6′′S, 148◦09′07.5′′E. The forest is classified as a tall open
20
Eucalypt forest. The dominant species are E. delegatensis (Alpine Ash) and E.
dal-rympleana(Mountain Gum), and average tree height is 40 m. Elevation of the site is
1200 m; mean annual precipitation is 1000 mm. The Bago and Maragle State Forests are adjacent to the south west slopes of southern New South Wales and the 48 400 ha of native forest have been managed for wood production for over 100 years. Meteoro-25
ACPD
9, 13093–13122, 2009New-particle formation in near-coastal forests
T. Suni et al.
Title Page
Abstract Introduction
Conclusions References
Tables Figures
◭ ◮
◭ ◮
Back Close
Full Screen / Esc
Printer-friendly Version
Interactive Discussion
the forest (Leuning et al., 2005).
Figure 1 presents the major vegetation groups in Australia. Vegetation within 500– 1500 km of our aerosol measurement site in Tumbarumba falls into three main cate-gories: dense native forests mainly on cool mountains up to 1–2 km high, agricultural fields dotted with Eucalypt woodlands on warmer lowlands, and dry grassland plains. 5
2.2 Aerosol concentration and formation of new particles
The total concentration of ultrafine aerosol particles (lower detection limit∼14 nm) was
measured above the forest with a condensational particle counter (CPC), TSI model 3010, at the height of 70 m on the tower. We detected new particle formation by measuring size distributions of air ions (naturally charged clusters and aerosol par-10
ticles) with an Air Ion Spectrometer (AIS). The AIS (Airel Ltd., Estonia) measures the mobility distribution of both negative and positive air ions in the range of 2.4 to 0.0075 cm2V−1s−1. This corresponds to a diameter range of approximately 0.34
to 40 nm. Although the AIS only observes charged particles, in field conditions the charge balance of atmospheric particles ensures that the formation events observed 15
for charged particles in a particular size range occur for neutral particles as well (Hir-sikko et al., 2007). The charged fraction is approximately 10% so there are usually about 10 times more neutral particles than charged ones.
The classification and analysis of NPF events was presented in Suni et al. (2008). In this paper, we use only events classified as normal. This class includes events 20
ACPD
9, 13093–13122, 2009New-particle formation in near-coastal forests
T. Suni et al.
Title Page
Abstract Introduction
Conclusions References
Tables Figures
◭ ◮
◭ ◮
Back Close
Full Screen / Esc
Printer-friendly Version
Interactive Discussion
2.3 VOC measurements
Ambient concentrations of VOCs in the tall Eucalypt forest in Tumbarumba and in other vegetation types in surrounding areas within a radius of 1000 km were sampled on stainless steel adsorbent tubes filled with Tenax-TA and Carbopack-B to catch both monoterpenes and isoprene. In front of each tube we used a copper mesh coated 5
with MnO2 to destroy ozone and prevent further oxidising reactions inside the tube (Calogirou et al., 1996; Helmig, 1997).
In Tumbarumba, the tubes were elevated to 1–5 heights in the canopy (4–40 m) by means of a pulley system. The number of heights depended on the number of Tenax tubes available on each visit to the station, but we always used at least the 10
height of 40 m. During field trips further away, we used a customised 4WD with a portable meteorological measurement system and a 1.5-m stand and helium balloons for elevating the sample tubes and a Vaisala RH/T sensor to varying canopy heights. Flow through the tube was measured at the inlet and set to 80–100 ml min−1. The
measurement time was 30–90 min allowing 2.4 to 9 l of air to flow through the tubes. All 15
the samples were analysed at the Finnish Meteorological Institute with a GC/MS (gas chromatograph/mass spectrometer). A detailed description of the analysis is given by Hakola et al. (2006).
We made two field trips to surrounding areas, one in April and one in October 2006, in order to measure VOC emissions and to detect differences in the emitted quantities 20
and spectra in the dominant ecosystems around South-East Australia. In Tumbarumba, we took VOC samples in May–July and November 2006 and in February–March 2007, corresponding to Southern Hemisphere winter, spring, and summer, respectively.
2.4 Trajectory analysis
To analyse the source and transport pathways of air masses arriving at Tumbarumba, 25
cal-ACPD
9, 13093–13122, 2009New-particle formation in near-coastal forests
T. Suni et al.
Title Page
Abstract Introduction
Conclusions References
Tables Figures
◭ ◮
◭ ◮
Back Close
Full Screen / Esc
Printer-friendly Version
Interactive Discussion
culated 96 h backwards in time at a 70-m arrival height above ground level hourly from 08:00 to 16:00 LT to include the main part of most particle formation events. Elevation of the air parcel, mixed layer depth (Mld), as well the air parcel properties along the trajectory such as relative humidity (RH), ambient temperature (T), and rain were calculated by means of HYSPLIT trajectory model using the global FNL archive 5
(http://www.arl.noaa.gov/ss/transport/archives.html). See Sogacheva et al. (2005) for more details on the trajectory calculation process.
The area within a radius of 1500 km around Tumbarumba was divided into 12×4
sectors and characterised according to its dominant vegetation. We also calculated the distance and the azimuth angle from Tumbarumba for each trajectory at−6,−12,
10
−24,−48,−72, and−96 h from their arrival time.
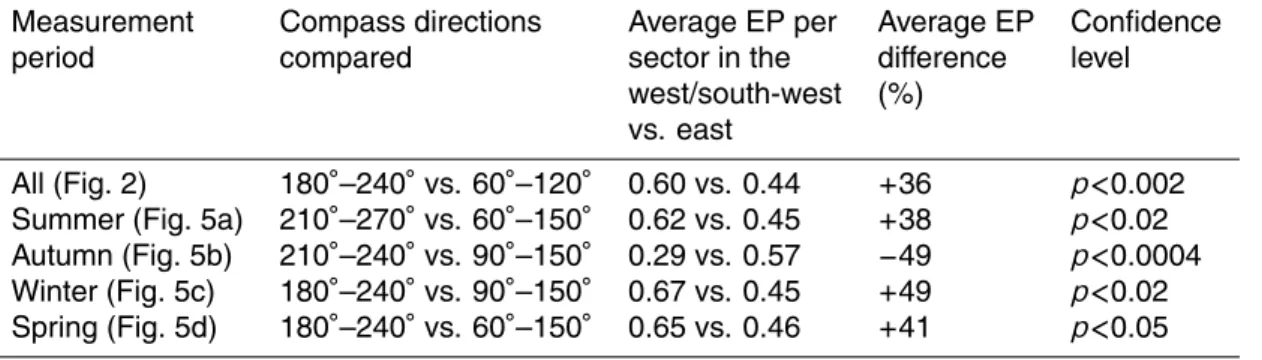
3 Results and discussion
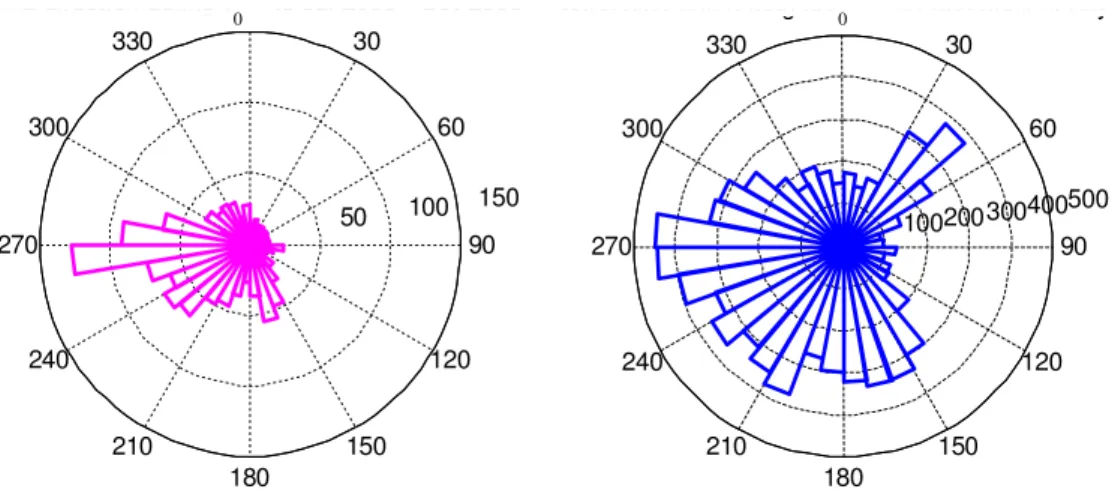
Most NPF events took place when local wind direction was from 260◦ to 280◦ (Fig. 2), the agricultural/pasture lowland direction (Fig. 1). This was close to the wind direction (200◦–220◦) that produced the highest number concentrations of newly formed particles
15
(Fig. 3). NPF did not occur when wind was coming from 30◦to 60◦although this was not an infrequent wind direction (Fig. 2). This is the direction largely composed of native grasslands and minimally modified pastures, although agricultural and native woodland areas also occur. Australia’s largest city, Sydney, along with a coal mine in Newcastle, is in this direction, albeit several hundreds of kilometers away from Tumbarumba. 20
To further investigate this phenomenon, we looked at back trajectories of the air masses up to 96 h prior to their arrival at Tumbarumba. Because air masses move mostly from west to east and tend to turn left in the Southern Hemisphere, the majority of air masses arriving at Tumbarumba originated south from Australia, usually above the Southern Ocean. From there, they either arrived at Tumbarumba crossing the 25
Aus-ACPD
9, 13093–13122, 2009New-particle formation in near-coastal forests
T. Suni et al.
Title Page
Abstract Introduction
Conclusions References
Tables Figures
◭ ◮
◭ ◮
Back Close
Full Screen / Esc
Printer-friendly Version
Interactive Discussion
tralia passed Tumbarumba from the north.
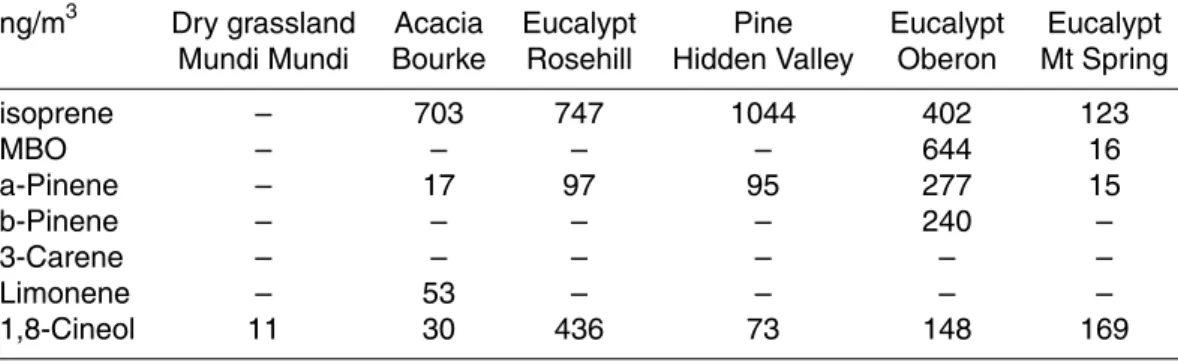
We divided the area within a radius of 1500 km surrounding Tumbarumba to 4×12
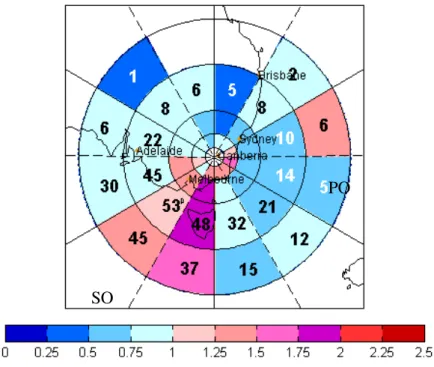
sectors and calculatedr, the ratio of event days to days with no clear event for each sector (Fig. 4). Confirming the local wind findings, this analysis showed that a day with NPF was more frequent than a day with no clear event (average r=1.53 per sector) 5
when air was coming from the Southern Ocean in the west and south-west during the whole measuring period (Fig. 4) and also looking at different seasons separately (Fig. 5 and Table 1). On the other hand, a day with no clear event was more frequent than an NPF day (averager=0.78 per sector) when the air originated in the easterly and south-easterly directions above the Pacific Ocean (Fig. 4). From these areas, the 10
air masses turn left and reach Tumbarumba from the north-east as is evident in the local wind direction measurements (Fig. 2). Converted to average event probability per sector (EP=r/(r+1)), during the whole measuring period the Southern Oceanic air masses produced on average 36% more events per sector than the Pacific ones (Fig. 4). In summer, winter, and spring, EP in the Southern Ocean direction was 38% to 15
49% higher than EP in the Pacific direction (Table 1). The only exception was autumn when daytime event frequency had a minimum and the main mechanism producing new particles was intensive nocturnal aerosol formation (Suni et al., 2008).
Vegetation in South-East Australia varies greatly with more forested areas to the east than to the west of Tumbarumba (Fig. 1). However, satellite measurements of the 20
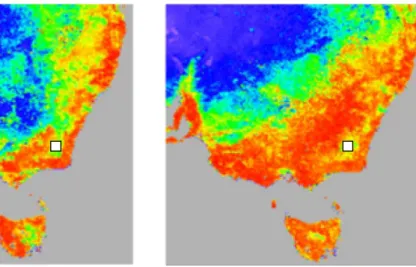
Normalized Differential Vegetation Index (NDVI) showed that within a few hundred kilo-meters from Tumbarumba no clear difference in photosynthetic activity existed between the north-east and the south-west direction (Fig. 6). The production rates of VOC, of which many are closely related to photosynthesis, are, therefore, probably comparable in both directions. With no evident difference in the amount of organic precursor vapors 25
ACPD
9, 13093–13122, 2009New-particle formation in near-coastal forests
T. Suni et al.
Title Page
Abstract Introduction
Conclusions References
Tables Figures
◭ ◮
◭ ◮
Back Close
Full Screen / Esc
Printer-friendly Version
Interactive Discussion
and indeed found that during peak NPF in spring and summer, average RH was ap-proximately 75% in the north-easterly winds and only about 55% in the south-westerly winds (Fig. 7). Furthermore, tracing the back trajectory properties we found that, on average, the Pacific Ocean produced significantly more humidity than the Southern Ocean (Fig. 8; division to seasons in Fig. 9). This was clearly because the latent 5
heat flux (LE) was almost double above the Pacific Ocean compared to that above the Southern Ocean in summer (Fig. 10) and consistently in all seasons (Fig. 11). One ex-planation for this difference in LE is the warm tropical East Australian Current sweeping the eastern coast of Australia in the Pacific Ocean (Fig. 10). The warm current provides heat and high absolute humidity at the eastern coast of Australia. When significantly 10
colder air with lower absolute humidity flows from the south and mixes with the warm, humid air at the sea surface, a strong latent heat flux forms between the surface and the air above it. The relative humidity of this air mass increases further when it rises along the coastal mountains on its way to Tumbarumba.
Field evidence points strongly towards a suppressing effect of humidity on aerosol 15
formation above forests (Nilsson et al., 2001; Buzorius et al., 2001; Suni et al., 2008; Kesselmeier and Staudt, 1999). Solar radiation and water vapor are involved in the production of OH which, in turn, is instrumental in converting SO2 into sulfuric acid (H2SO4), an important component in cluster activation and initial steps of particle growth (Hyv ¨onen et al., 2005; Kulmala et al., 2006). However, because high humidity 20
leads to cloudiness, a maximum production level should exist between low and high humidity (Hyv ¨onen et al., 2005). An increase in absolute humidity will at first enhance sulfuric acid formation, but this will decline after the appearance of clouds at high RH (Hyv ¨onen et al., 2005).
Laboratory studies have given seemingly contradictory results of the effect of wa-25
ACPD
9, 13093–13122, 2009New-particle formation in near-coastal forests
T. Suni et al.
Title Page
Abstract Introduction
Conclusions References
Tables Figures
◭ ◮
◭ ◮
Back Close
Full Screen / Esc
Printer-friendly Version
Interactive Discussion
monoterpene nucleation are likely to apply also to the more probable sesquiterpene (C15H24) nucleation because the reacting functional groups of mono- and sesquiter-penes are similar. A clear negative effect on aerosol yield was observable from the ozonolysis of exocyclic monoterpenes (β-pinene and sabinene) but a lesser, at low concentrations even positive, effect on endocyclic monoterpenes (α-pinene and ∆3
-5
carene) (Bonn et al., 2002). The authors suggested that water vapor (in addition to alcohols and acids) competed with the carbonyl – stabilized Criegee intermediate – reactions that they believed initiated the nucleation. An inhibiting effect of water vapor was also observable on sesquiterpene ozonolysis (Bonn et al., 2003). On the contrary, another study found a clear increase in aerosol volume and number concentration with 10
RH throughout the range of 2–85% for limonene,∆3-carene, andα-pinene, with con-centrations closer to ambient (Jonsson et al., 2006). According to this study, there is probably a mechanistic explanation according to which the presence of water increases the yield of low-volatility compounds in terpene oxidation but a further study showed that except at sub-zero temperatures, this physical mechanism cannot account for the 15
observations alone (Jonsson et al., 2008a,b). Instead, water also clearly affects the chemistry or rate of reactions involved (Jonsson et al., 2008a,b).
The explanation behind these opposite observations (Bonn et al., 2002, 2003; Jon-sson et al., 2006, 2008a, b) could be that different mechanisms are responsible for nucleation at different concentrations of organic reactants. Also, different types of OH 20
scavengers used to remove the effect of OH on monoterpene ozonolysis can influence the results of laboratory experiments (Jonsson et al., 2008a). Yet another potential ex-planation is that the key reactions for nucleation at low concentrations (even between two organic molecules) are catalyzed by water molecules rather than, or in addition to, involving them as reactants. The contrasting field and laboratory observations empha-25
size the complexity involved in the interactions among water vapor and the meteorology and chemistry of aerosol formation.
ACPD
9, 13093–13122, 2009New-particle formation in near-coastal forests
T. Suni et al.
Title Page
Abstract Introduction
Conclusions References
Tables Figures
◭ ◮
◭ ◮
Back Close
Full Screen / Esc
Printer-friendly Version
Interactive Discussion
as shown in Tables 2–4. The concentrations were high compared to those in the bo-real zone (Hakola et al., 2003). Pinenes are known to contribute to secondary aerosol formation (Bonn et al., 2002), and MBO is a weak secondary aerosol producer (Car-rasco et al., 2007). Both are common in the boreal zone (Hakola et al., 2003). We found especially high concentrations of limonene 400 km west from Tumbarumba (Ta-5
ble 2) that could contribute to the high aerosol concentrations coming from the west and south-west. The aerosol yield of limonene ozonolysis is many times higher than that of pinene oxidation (Jonsson et al., 2006; Vartiainen et al., 2006). Another factor favoring this wind direction is that on days with NPF, air masses arrived from a higher altitude than on days with no NPF (Fig. 12a). This could add to the relative dryness of 10
these westerly/south-westerly trajectories. Event-day trajectories in general also had lower absolute and relative humidity than non-event-day trajectories (Fig. 12b and c) along with higher boundary layers (BL) (Fig. 12d). In addition to total energy input, higher BL is the result of lower latent heat flux that leaves more energy to the sensible heat flux which creates the BL.
15
4 Conclusions
According to our analysis of 96-h back trajectories, formation of new particles was most frequent in the dry westerly and south-westerly air masses. According to NDVI measurements, photosynthesis was not significantly higher in this direction compared to the north-east direction. It is unlikely, therefore, that differences in photosynthesis-20
derived organic precursor emissions would have been significant enough to lead to the clear difference in NPF frequency between these two directions. Instead, the high evaporation rates above the Pacific Ocean resulted in humid winds from the north-east and effective suppression of new-particle formation in the forest hundreds of kilometers inland. Combining these findings with earlier results of the positive effect of Arctic 25
ACPD
9, 13093–13122, 2009New-particle formation in near-coastal forests
T. Suni et al.
Title Page
Abstract Introduction
Conclusions References
Tables Figures
◭ ◮
◭ ◮
Back Close
Full Screen / Esc
Printer-friendly Version
Interactive Discussion
emissions from vegetation, produces frequent new-particle formation in near-coastal forests in the Northern and Southern Hemispheres. Warm oceans, on the contrary, produce clean but humid air that effectively suppresses terrestrial biogenic new-particle formation even in the presence of high concentrations of precursor vapors.
Acknowledgement. This work was supported by the Academy of Finland, Maj and Tor Nessling
5
Foundation, the Centennial Foundation of Helsingin Sanomat, CSIRO, the Australian Green-house Office’s Australian Climate Change Science Program, and the New South Wales En-vironmental Trusts. We kindly acknowledge Ray Leuning for his insightful comments and S. Zegelin, D. Hughes, M. Kitchen and R. Hurley at CSIRO for their technical support.
The authors have no competing financial interests. All the authors have agreed to all the content
10
in the manuscript, including the data as presented.
References
Bonn, B. and Moortgat, K.: Sesquiterpene ozonolysis: Origin of atmospheric new particle formation from biogenic hydrocarbons, Geophys. Res. Lett., 30, 1585, doi:10.1029/2003GL017000, 2003.
15
Bonn, B., Schuster, G., and Moortgat, G. K.: Influence of water vapor on the process of new par-ticle formation during monoterpene ozonolysis, J. Phys. Chem. A, 106, 2869–2881, 2002. Buzorius, G., Rannik, ¨U., Nilsson, D., and Kulmala, M.: Vertical fluxes and micrometeorology
during aerosol particle formation events, Tellus B, 53, 394–405, 2001.
Calogirou, A., Richter Larsen, B., Brussol, C., Duane, M., and Kotzias, D.: Decomposition of
20
terpenes by ozone during sampling on Tenax., Anal. Chem., 68, 1499–1506, 1996.
Carrasco, N., Doussin, J. F., O’Connor, M., Wenger, J. C., Picquet-Varrault, B., Durand-Jolibois, R., and Carlier, P.: Simulation chamber studies of the atmospheric oxidation of 2-Methyl-3-Buten-2-ol: reaction with hydroxyl radicals and ozone under a variety of condi-tions, J. Atmos. Chem., 56, 33–55, 2007.
25
Draxler, R. R. and Hess, G. D.: Description of the HYSPLIT 4 Modeling System, NOAA Tech-nical Memorandum ERL ARL-224, 2004.
ACPD
9, 13093–13122, 2009New-particle formation in near-coastal forests
T. Suni et al.
Title Page
Abstract Introduction
Conclusions References
Tables Figures
◭ ◮
◭ ◮
Back Close
Full Screen / Esc
Printer-friendly Version
Interactive Discussion variation of mono- and sesquiterpene emission rates of Scots pine, Biogeosciences, 3, 93–
101, 2006, http://www.biogeosciences.net/3/93/2006/.
Hakola, H., Tarvainen, V., Laurila, T., Hiltunen, V., Hell ´en, H., and Keronen, P.: Seasonal vari-ation of VOC concentrvari-ations above a boreal coniferous forest, Atmos. Environ., 37, 1623– 1634, 2003.
5
Helmig, D.: Ozone removal techniques in the sampling of atmospheric volatile. Organic Trace Gases, Atmos. Environ., 31, 3635–3651, 1997.
Hirsikko, A., Bergman, T., Laakso, L., Dal Maso, M., Riipinen, I., H ˜orrak, U., and Kulmala, M.: Identification and classification of the formation of intermediate ions measured in boreal for-est, Atmos. Chem. Phys., 7, 201–210, 2007, http://www.atmos-chem-phys.net/7/201/2007/.
10
Hyv ¨onen, S., Junninen, H., Laakso, L., Dal Maso, M., Gr ¨onholm, T., Bonn, B., Keronen, P., Aalto, P., Hiltunen, V., Pohja, T., Launiainen, S., Hari, P., Mannila, H., and Kulmala, M.: A look at aerosol formation using data mining techniques, Atmos. Chem. Phys., 5, 3345–3356, 2005, http://www.atmos-chem-phys.net/5/3345/2005/.
Jonsson, ˚A. M., Hallquist, M., and Ljungstr ¨om, E.: Impact of humidity on the ozone initiated
15
oxidation of limonene,∆3-carene, andα-pinene, Environ. Sci. Technol., 40, 188–194, 2006. Jonsson, ˚A. M., Hallquist, M., and Ljungstr ¨om, E.: Influence of OH Scavenger on the Water
Effect on Secondary Organic Aerosol Formation from Ozonolysis of Limonene, ∆3-Carene, andα-Pinene, Environ. Sci. Technol., 42, 5938–5944, 2008a.
Jonsson, ˚A. M., Hallquist, M., and Ljungstr ¨om, E.: The effect of temperature and water on
20
secondary organic aerosol formation from ozonolysis of limonene,∆3-carene andα-pinene, Atmos. Chem. Phys., 8, 6541–6549, 2008b, http://www.atmos-chem-phys.net/8/6541/2008/. Kerminen, V.-M., Lihavainen, H., Komppula, M., Viisanen, Y., and Kulmala, M.: Direct
observa-tional evidence linking atmospheric aerosol formation and cloud droplet activation, Geophys. Res. Lett., 32, L14803, doi:10.1029/2005GL023130, 2005.
25
Kesselmeier, J. and Staudt, M.: Biogenic Volatile Organic Compounds (VOC): An overview on emission, physiology and ecology, J. Atmos. Chem., 33, 23–88, 1999.
Kulmala, M., Lehtinen, K. E. J., and Laaksonen, A.: Cluster activation theory as an explanation of the linear dependence between formation rate of 3 nm particles and sulphuric acid con-centration, Atmos. Chem. Phys., 6, 787–793, 2006,
30
http://www.atmos-chem-phys.net/6/787/2006/.
ACPD
9, 13093–13122, 2009New-particle formation in near-coastal forests
T. Suni et al.
Title Page
Abstract Introduction
Conclusions References
Tables Figures
◭ ◮
◭ ◮
Back Close
Full Screen / Esc
Printer-friendly Version
Interactive Discussion of observations, J. Aerosol Sci., 35, 143–176, 2004.
Kurt ´en, T., Kulmala, M., Dal Maso, M., Suni, T., Reissell, A., Vehkam ¨aki, H., Hari, P., Laakso-nen, A., ViisaLaakso-nen, Y., and Vesala, T.: Estimation of different forest-related contributions to the radiative balance using observation in southern Finland. Boreal Environ. Res., 8, 275–285, 2003.
5
Laaksonen, A., Hamed, A., Joutsensaari, J., Hiltunen, L., Cavalli, F., Junkermann, W., Asmi, A., Fuzzi, S., and Facchini, M. C.: Cloud condensation nucleus production from nucleation events at a highly polluted region, Geophys. Res. Lett., 32, L06812, doi:10.1029/2004GL022092, 2005.
Leuning, R., Cleugh, H.A., Zegelin, S., and Hughes, D.: Carbon and water cycles in two
con-10
trasting Australian ecosystems: Wet/Dry savannas and cool temperate Eucalyptus forest, Agr. For. Met., 129, 151–173, 2005.
Nilsson, E. D., Paatero, J., and Boy, M.: Effects of air masses and synoptic weather on aerosol formation in the continental boundary layer, Tellus B, 53, 462–478, 2001.
Sogacheva, L., Dal Maso, M., Kerminen, V.-M., and Kulmala, M.: Probability of nucleation
15
events and aerosol particle concentration in different air mass types arriving at Hyyti ¨al ¨a, southern Finland, based on back trajectories analysis. Boreal Environ. Res., 10, 479–491, 2005.
Spracklen, D. V., Carslaw, K. S., Kulmala, M., Kerminen, V.-M., Mann, G. W., and Sihto, S.-L.: The contribution of boundary layer nucleation events to total particle concentrations on
20
regional and global scales, Atmos. Chem. Phys., 6, 5631–5648, 2006, http://www.atmos-chem-phys.net/6/5631/2006/.
Suni, T., Kulmala, M., Hirsikko, A., Bergman, T., Laakso, L., Aalto, P. P., Leuning, R., Cleugh, H., Zegelin, S., Hughes, D., van Gorsel, E., Kitchen, M., Vana, M., H ˜orrak, U., Mirme, S., Mirme, A., Sevanto, S., Twining, J., and Tadros, C.: Formation and characteristics of ions
25
and charged aerosol particles in a native Australian Eucalypt forest, Atmos. Chem. Phys., 8, 129–139, 2008, http://www.atmos-chem-phys.net/8/129/2008/.
Tunved, P., Hansson, H.-C., Kerminen, V.-M., Str ¨om, J., Dal Maso, M., Lihavainen, H,. Viisa-nen, Y., Aalto, P. P., Komppula, M., and Kulmala, M.: High Natural Aerosol Loading over Boreal Forests, Science, 312, 261–263, doi:10.1126/science.1123052, 2006.
30
ACPD
9, 13093–13122, 2009New-particle formation in near-coastal forests
T. Suni et al.
Title Page
Abstract Introduction
Conclusions References
Tables Figures
◭ ◮
◭ ◮
Back Close
Full Screen / Esc
Printer-friendly Version
Interactive Discussion Table 1.Statistical significance of the difference between average event probabilities per sector
(EP) in the south-west and east according to the binomial test.
Measurement Compass directions Average EP per Average EP Confidence
period compared sector in the difference level
west/south-west (%) vs. east
All (Fig. 2) 180◦–240◦vs. 60◦–120◦ 0.60 vs. 0.44
+36 p<0.002 Summer (Fig. 5a) 210◦–270◦vs. 60◦–150◦ 0.62 vs. 0.45
+38 p<0.02 Autumn (Fig. 5b) 210◦–240◦vs. 90◦–150◦ 0.29 vs. 0.57
−49 p<0.0004
Winter (Fig. 5c) 180◦–240◦vs. 90◦–150◦ 0.67 vs. 0.45
+49 p<0.02 Spring (Fig. 5d) 180◦–240◦vs. 60◦–150◦ 0.65 vs. 0.46
ACPD
9, 13093–13122, 2009New-particle formation in near-coastal forests
T. Suni et al.
Title Page
Abstract Introduction
Conclusions References
Tables Figures
◭ ◮
◭ ◮
Back Close
Full Screen / Esc
Printer-friendly Version
Interactive Discussion Table 2. Average concentrations of dominant biogenic VOCs (ngm−3
) at 10 m and 40 m in Tumbarumba in winter, spring, and summer. Unless all measurements were bdl, bdl have been replaced by half the species-specific detection limit.
Species Winter Winter Spring Spring Summer Summer
(N=5) (N=18) (N=13) (N=21) (N=5) (N=6)
4 m 40 m 10 m 40 m 10 m 40 m
a-pinene 50±38 80±93 196±81 170±92 336±236 208±97
b-pinene 24±22 56±90 59±78 53±74 91±76 45±29
1,8-cineol 58±31 196±163 363±453 280±364 907±919a 697±744a
Isoprene bdl 16±21 1004±882 912±916 786±481 913±644
MBO bdl 23±44 176±189 128±132 54±95 45±79
camphene bdl bdl 7±7 22±66 bdl bdl
sabinene bdl 5±7 4±7 5±8 11±15 7±12
3-carene bdl bdl 11±13 10±10 30±52 27±40
limonene bdl bdl 51±48 48±36 61±67 44±31
a
These entries include one late evening measurement at 22:00 standard time. Values similar to daytime numbers except for eucalyptol that had 2487 and 2177 ngm−3
ACPD
9, 13093–13122, 2009New-particle formation in near-coastal forests
T. Suni et al.
Title Page
Abstract Introduction
Conclusions References
Tables Figures
◭ ◮
◭ ◮
Back Close
Full Screen / Esc
Printer-friendly Version
Interactive Discussion Table 3.Average concentrations of dominant biogenic VOCs (ngm−3
) above various vegetation within 1000 km around Tumbarumba during a field campaign in April 2006.
Grassland Eucalypt Semiurban Eucalypt Mixed Dry Mixed Mixed
Maude Brindabella mixed Eucalypt/ Tumbarumba pasture/ grassland Eucalypt/ pasture/
Road mountains pasture Eucalypt Mundi pine Tumut Eucalypt
Broken Hill Balranald Mundi Griffith
isoprene – – – – – – – –
MBO – 355 – 158 28 51 – –
a-Pinene – 4695 – – – – – –
b-Pinene 11 6294 6 33 – – 60 6
3-Carene 118 – – – – – – –
Limonene 925 – 506 – – – – –
ACPD
9, 13093–13122, 2009New-particle formation in near-coastal forests
T. Suni et al.
Title Page
Abstract Introduction
Conclusions References
Tables Figures
◭ ◮
◭ ◮
Back Close
Full Screen / Esc
Printer-friendly Version
Interactive Discussion Table 4. Average concentrations of dominant biogenic VOCs (ngm−3
) around Tumbarumba during a field campaign in October 2006.
ng/m3 Dry grassland Acacia Eucalypt Pine Eucalypt Eucalypt Mundi Mundi Bourke Rosehill Hidden Valley Oberon Mt Spring
isoprene – 703 747 1044 402 123
MBO – – – – 644 16
a-Pinene – 17 97 95 277 15
b-Pinene – – – – 240 –
3-Carene – – – – – –
Limonene – 53 – – – –
ACPD
9, 13093–13122, 2009New-particle formation in near-coastal forests
T. Suni et al.
Title Page
Abstract Introduction
Conclusions References
Tables Figures
◭ ◮
◭ ◮
Back Close
Full Screen / Esc
Printer-friendly Version
Interactive Discussion Tumbarumba
Fig. 1. Some major vegetation groups in South-East Australia. Source: National Land and Water Resources Audit 2001. Copyright: Commonwealth of Australia 2001.
ACPD
9, 13093–13122, 2009New-particle formation in near-coastal forests
T. Suni et al.
Title Page
Abstract Introduction
Conclusions References
Tables Figures
◭ ◮
◭ ◮
Back Close
Full Screen / Esc
Printer-friendly Version
Interactive Discussion
50 100 150
30
210
60
240
90 270
120 300
150 330
180 0
Wind direction during events Jul 2005 - Oct 2006
100 200 300 400 500
30
210
60
240
90 270
120 300
150 330
180 0
Wind direction during non-events and unclear days
0 0
ACPD
9, 13093–13122, 2009New-particle formation in near-coastal forests
T. Suni et al.
Title Page Abstract Introduction Conclusions References Tables Figures ◭ ◮ ◭ ◮ Back Close
Full Screen / Esc
Printer-friendly Version
Interactive Discussion
100 200 300 400 500 30 210 60 240 90 270 120 300 150 330 180 0 Ion n um b er c o nc e nt rat ion (c m -3) vs . a z.a n g le a t - 6 h
100 200 300 400 30 210 60 240 90 270 120 300 150 330 180 0 Ion num ber c onc ent ra ti on (c m -3) vs. a z.a n g le a t -1 2 h
100 200 300 400 30 210 60 240 90 270 120 300 150 330 180 0 Io n nu m be r conc en tr at ion (cm -3) vs . az .a ngle at -24 h
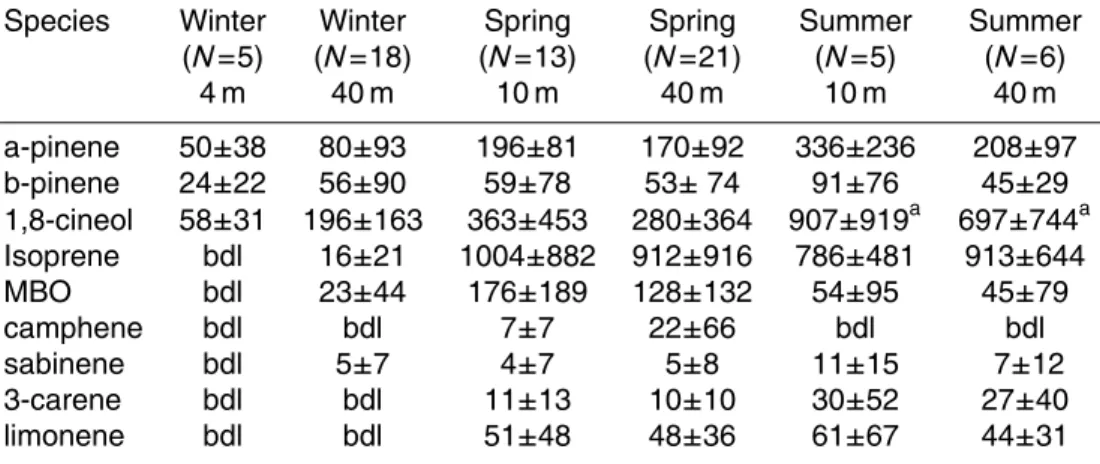
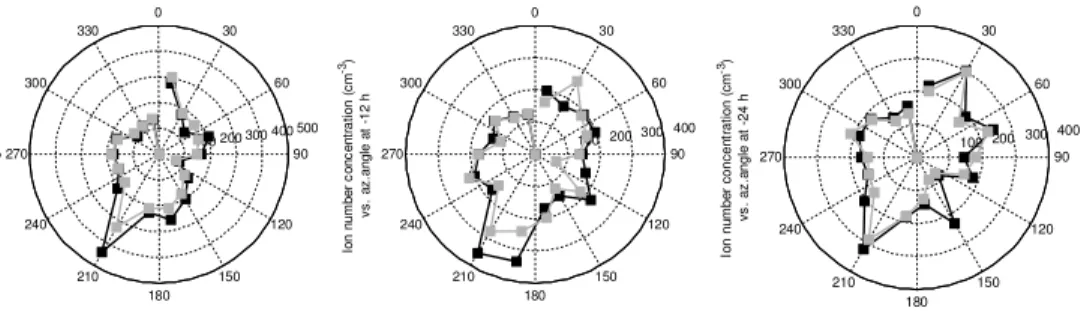
Fig. 3.Median number concentration of 2–14 nm ions as a function of trajectory direction. The number concentration is shown at (left) 6 h before arrival (middle) 12 h before arrival and (right) 24 h before arrival to Tumbarumba (11–16). Black – negative, grey – positive ions.
ACPD
9, 13093–13122, 2009New-particle formation in near-coastal forests
T. Suni et al.
Title Page
Abstract Introduction
Conclusions References
Tables Figures
◭ ◮
◭ ◮
Back Close
Full Screen / Esc
Printer-friendly Version
Interactive Discussion
SO
PO
ACPD
9, 13093–13122, 2009New-particle formation in near-coastal forests
T. Suni et al.
Title Page
Abstract Introduction
Conclusions References
Tables Figures
◭ ◮
◭ ◮
Back Close
Full Screen / Esc
Printer-friendly Version
Interactive Discussion Fig. 5. Frequency of new-particle formation as a function of air mass arrival path for different
ACPD
9, 13093–13122, 2009New-particle formation in near-coastal forests
T. Suni et al.
Title Page
Abstract Introduction
Conclusions References
Tables Figures
◭ ◮
◭ ◮
Back Close
Full Screen / Esc
Printer-friendly Version
Interactive Discussion Fig. 6.Monthly average NDVI (Normalized Difference Vegetation Index) in South-East Australia
in January (left) and October (right) 2005. The white square indicates the approximate location of Tumbarumba. The NDVI product used here was a subset of the Seawifs Global Monthly “4 km” data (2.5′, 0.0416667◦). http://oceancolor.gsfc.nasa.gov/REPROCESSING/SeaWiFS/
ACPD
9, 13093–13122, 2009New-particle formation in near-coastal forests
T. Suni et al.
Title Page
Abstract Introduction
Conclusions References
Tables Figures
◭ ◮
◭ ◮
Back Close
Full Screen / Esc
Printer-friendly Version
Interactive Discussion
0 100 200 300
0 20 40 60 80 100
Mean RH Oct-Feb
ACPD
9, 13093–13122, 2009New-particle formation in near-coastal forests
T. Suni et al.
Title Page
Abstract Introduction
Conclusions References
Tables Figures
◭ ◮
◭ ◮
Back Close
Full Screen / Esc
Printer-friendly Version
Interactive Discussion
0.005 0.006 0.007 0.008 0.009 0.01 0.011 0.012 0.013
E150
S30
Fig. 8. Average absolute humidity (gm−3
ACPD
9, 13093–13122, 2009New-particle formation in near-coastal forests
T. Suni et al.
Title Page
Abstract Introduction
Conclusions References
Tables Figures
◭ ◮
◭ ◮
Back Close
Full Screen / Esc
Printer-friendly Version
Interactive Discussion
December-February
E150
S30
March-May
E150
S30
September-November
E150
S30 June-August
E150
S30
Fig. 9. Average absolute humidity (gm−3
ACPD
9, 13093–13122, 2009New-particle formation in near-coastal forests
T. Suni et al.
Title Page
Abstract Introduction
Conclusions References
Tables Figures
◭ ◮
◭ ◮
Back Close
Full Screen / Esc
Printer-friendly Version
Interactive Discussion
Pacific Ocean
Southern Ocean
ACPD
9, 13093–13122, 2009New-particle formation in near-coastal forests
T. Suni et al.
Title Page
Abstract Introduction
Conclusions References
Tables Figures
◭ ◮
◭ ◮
Back Close
Full Screen / Esc
Printer-friendly Version
Interactive Discussion Fig. 11. Average latent heat flux in and near Australia in different seasons. NCEP Reanalysis
data provided by the NOAA/OAR/ESRL PSD, Boulder, Colorado, USA, from their Web site at http://www.cdc.noaa.gov/.
ACPD
9, 13093–13122, 2009New-particle formation in near-coastal forests
T. Suni et al.
Title Page Abstract Introduction Conclusions References Tables Figures ◭ ◮ ◭ ◮ Back Close
Full Screen / Esc
Printer-friendly Version
Interactive Discussion
-96 -72 -48 -24 -12 0 200 400 600 800 1000 1200 1400 1600 1800 2000 m ix ed lay er de pth, m
back time, h event days non-formation days
d
-96 -72 -48 -24 -12 0
6 6.5 7 7.5 8 8.5
x 10-3
A
H
, g m
-3
back time, h event days non-formation days b
-96 -72 -48 -24 -12 0
60 80 100 120 140 160 180 200 ai r par c el h ei ght , m
back time, h event days non-formation days a
-96 -72 -48 -24 -12 0
50 55 60 65 70 75 80 RH, %
back time, h event days non-formation days c
Fig. 12. Meteorological variables along the trajectories. (a) Air parcel height, (b) absolute humidity,(c)relative humidity, and(d)mixed layer depth for new-particle formation events and non-formation and unclear days for the whole period.