ESSDD
2, 63–101, 2009
CARINA: nutrient data in the Atlantic
Ocean
T. Tanhua et al.
Title Page
Abstract Instruments
Data Provenance & Structure
Tables Figures
◭ ◮
◭ ◮
Back Close
Full Screen / Esc
Printer-friendly Version
Interactive Discussion Earth Syst. Sci. Data Discuss., 2, 63–101, 2009
www.earth-syst-sci-data-discuss.net/2/63/2009/ © Author(s) 2009. This work is distributed under the Creative Commons Attribution 3.0 License.
Earth System Science Data Discussions
Earth System Science Data Discussionsis the access reviewed
discussion forum ofEarth System Science Data
CARINA: nutrient data in the
Atlantic Ocean
T. Tanhua1, P. J. Brown2, and R. M. Key3
1
Leibniz-Institut f ¨ur Meereswissenschaften, Marine Biogeochemie, Kiel, Germany
2
School of Environmental Sciences, University of East Anglia, Norwich, NR4 7TJ, UK
3
Atmospheric and Oceanic Sciences Program, Princeton Univ., Princeton, NJ 08544, USA
Received: 15 June 2009 – Accepted: 19 June 2009 – Published: 17 July 2009
Correspondence to: T. Tanhua ([email protected])
ESSDD
2, 63–101, 2009
CARINA: nutrient data in the Atlantic
Ocean
T. Tanhua et al.
Title Page
Abstract Instruments
Data Provenance & Structure
Tables Figures
◭ ◮
◭ ◮
Back Close
Full Screen / Esc
Printer-friendly Version
Interactive Discussion Abstract
Data on carbon and carbon-relevant hydrographic and hydrochemical parameters from previously non-publicly available cruise data sets in the Arctic, Atlantic and Southern Ocean have been retrieved and merged to a new database: CARINA (CARbon IN the Atlantic). These data have gone through rigorous quality control (QC) procedures to
5
assure the highest possible quality and consistency. The data for most of the measured parameters in the CARINA data base were objectively examined in order to quantify systematic differences in the reported values, i.e. secondary quality control. Systematic biases found in the data have been corrected in the data products, i.e. three merged data files with measured, calculated and interpolated data for each of the three
CA-10
RINA regions; Arctic, Atlantic and Southern Ocean. Out of a total of 188 cruise entries in the CARINA database, 98 were conducted in the Atlantic Ocean and of these 84 cruises report nitrate values, 79 silicate, and 78 phosphate. Here we present details of the secondary QC for nutrients for the Atlantic Ocean part of CARINA. Procedures of quality control, including crossover analysis between cruises and inversion analysis
15
of all crossover data are briefly described. Adjustments were applied to the nutrient values for 43 of the cruises in the Atlantic Ocean region. With these adjustments the CARINA database is consistent both internally as well as with GLODAP data, an oceanographic data set based on the World Hydrographic Program in the 1990s (Key et al., 2004). Based on our analysis we estimate the internal accuracy of the
CARINA-20
ESSDD
2, 63–101, 2009
CARINA: nutrient data in the Atlantic
Ocean
T. Tanhua et al.
Title Page
Abstract Instruments
Data Provenance & Structure
Tables Figures
◭ ◮
◭ ◮
Back Close
Full Screen / Esc
Printer-friendly Version
Interactive Discussion Data coverage and parameter measured
Repository-Reference: doi: (This will be provided by CDIAC.) Available at: http://cdiac.ornl.gov/oceans/CARINA/Carina inv.html Coverage: 60◦S–75◦N; 80◦W–34◦E
Location Name: Atlantic Ocean
5
Date/Time Start: 1977-10-7 Date/Time End: 2006-02-02
Data Product Parameter Name
Data Product Flag Name
Exchange File Parameter Name
Exchange File Flag Name
Units
station STANBR
day DATE
month DATE
year DATE
latitude LATITUDE decimal degrees
longitude LONGITUDE decimal degrees
cruiseno
depth meters
temperature CTDTMP ◦C
salinity sf SALNTY SALNTY FLAG W
pressure CTDPRS decibars
nitrate no3f NITRAT NITRAT FLAG W micomole kg−1
nitrite no2f NITRIT NITRIT FLAG W micomole kg−1
silicate sif SILCAT SILCAT FLAG W micomole kg−1
phosphate po4f micomole kg−1
For a complete list of parameters for the CARINA data base, see Key et al. (2009). Note the different names for the parameters in the Exchange files (the individual cruise files) and the merged data product.
ESSDD
2, 63–101, 2009
CARINA: nutrient data in the Atlantic
Ocean
T. Tanhua et al.
Title Page
Abstract Instruments
Data Provenance & Structure
Tables Figures
◭ ◮
◭ ◮
Back Close
Full Screen / Esc
Printer-friendly Version
Interactive Discussion 1 Introduction and instrumentation
CARINA (CARbon IN the Atlantic) is a database of carbon and carbon-relevant data from hydrographic cruises in the Arctic, Atlantic and Southern Oceans. The project started as an essentially informal, unfunded project in Delmenhorst, Germany, in 1999 during the workshop on “CO2in the North Atlantic”, with the main goal to create a
uni-5
formly formatted database of carbon relevant variables in the ocean to be used for ac-curate assessments of oceanic carbon inventories and uptake rates. The collection of data and the quality control of the data have been a main focus of the CARINA project. Both primary and secondary quality control (QC) of the data has been performed. The CARINA database consists of two parts: the first part is formed by the set of individual
10
cruise files where all the data reported by the measurement teams are stored. Qual-ity flags accompany the data, in many cases they are the flags originally reported, in others they are assigned by R. Key. These files are in WHP (WOCE Hydrographic Pro-gram) exchange format where the first lines consist of the condensed metadata. There are essentially no calculated or interpolated values in the individual cruise files, with
15
the exceptions of pressure calculated from depth and some bottle salinities that were taken from ctdsal. No adjustments have been applied to any of these values with the exception that all pH measurements were converted to the seawater pH scale at 25◦C. The second part of CARINA consists of three merged quality controlled and adjusted data files; one each for the Atlantic Ocean, Arctic Mediterranean Seas and Southern
20
Ocean regions. These files contain all the CARINA data and also include: 1) interpo-lated values for nutrients, oxygen and salinity if those are missing and the interpolation could be made according to certain criteria, as described in Key et al. (2009); and 2) calculated carbon parameters; e.g. if Total Carbon Dioxide (TCO2) and Total
Alkalin-ity (TA) were measured, pH was calculated. Calculated and interpolated values have
25
ESSDD
2, 63–101, 2009
CARINA: nutrient data in the Atlantic
Ocean
T. Tanhua et al.
Title Page
Abstract Instruments
Data Provenance & Structure
Tables Figures
◭ ◮
◭ ◮
Back Close
Full Screen / Esc
Printer-friendly Version
Interactive Discussion secondary QC, such as∆14C,δ13C and SF6. These are included in the merged data
files as well.
This report provides an overview of the nutrient data in CARINA-ATL, and describes the secondary QC of nutrient data for this data set. An overview of the Atlantic Ocean part of the CARINA data set (CARINA-ATL) data set is given in Tanhua et al. (2009a),
5
and a more comprehensive description of the complete CARINA database can be found in Key et al. (2009).
2 Data Provenance and Structure
The CARINA database includes data and metadata from 188 oceanographic cruises/campaigns, of which five entries consist of multiple cruises. The Atlantic Ocean
10
subset of the CARINA data set consists of 98 cruises/entries, of which one is a time se-ries and a further two are collections of multiple cruises conducted over several years within the framework of a common project. Additionally, six reference cruises were in-cluded in the secondary QC for CARINA-ATL to ensure consistency between CARINA and historical databases, in particular GLODAP (Global Ocean Data Analysis Project,
15
Key et al., 2004). Five of the Atlantic cruises are in common with the Southern Ocean region, and five are in common with the Arctic Mediterranean Seas region. These over-lapping cruises ensure consistency between the three regions of the CARINA data set. The Atlantic Ocean region of CARINA is loosely defined as the area between of the Greenland-Scotland Ridge and 30◦S, but as mentioned, ten cruises overlap with the
20
surrounding regions, thus extending the area covered. For the CARINA-ATL data set, a subset of cruises was identified as core cruises, see Table 1. These were chosen based both on the geographical extent of the data set (i.e. cruises that cover only a small and limited area could not become a core cruise) and an expected high quality of data (i.e. cruises with expected WOCE/CLIVAR quality). Any offsets towards these
25
ESSDD
2, 63–101, 2009
CARINA: nutrient data in the Atlantic
Ocean
T. Tanhua et al.
Title Page
Abstract Instruments
Data Provenance & Structure
Tables Figures
◭ ◮
◭ ◮
Back Close
Full Screen / Esc
Printer-friendly Version
Interactive Discussion selected as core cruises. Since a somewhat different approach was taken in
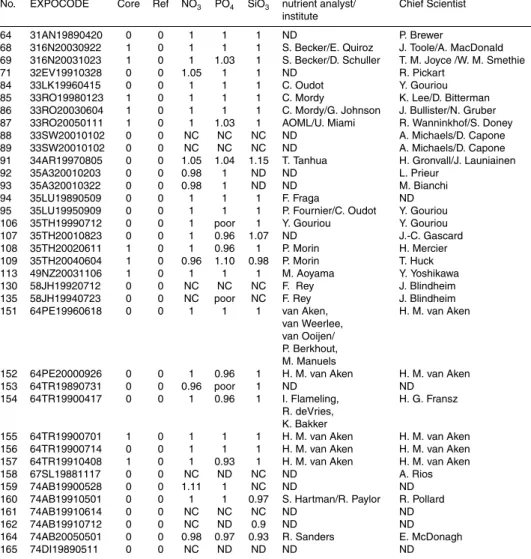
deter-mining the adjustments for nutrients for the GLODAP data set (Gouretski and Jancke, 2001), these reference cruises will also be included in this report, although they are formally not part of the CARINA data set. Figure 1 shows the position of all stations where at least one nutrient was measured (i.e. phosphate, silicate or nitrate) in the
5
CARINA data base, and those are all listed in Table 1 together with the adjustments that have been applied for the nutrient data in the data product.
The nutrient data are reported in units ofµmol kg−1
. However, there is one compli-cation with nitrate data. In ideal cases nitrate and nitrite measurements were reported separately. In others only nitrate was reported or only the combination of nitrate plus
10
nitrite. Finally, in a few instances nitrate plus nitrite was reported along with values for nitrite. For the last example the nitrite values were simply subtracted from the reported nitrate plus nitrite values. For cases where only nitrate plus nitrate was reported we had a choice: carry an additional parameter (i.e. NO3+NO2in addition to nitrate) or simply rename the data nitrate (ignoring the nitrite contribution in the upper water column).
15
Both choices are problematic. We chose the latter for CARINA cruises (both original cruise files and final data products). Another source of error that we were not able to completely eliminate is the possibility of erroneous units for the nutrients, i.e. that data were given in volumetric units instead of the stated gravimetric units, or vice-versa. Both cases would cause an offset of 2–3%.
20
3 Methods
The quality control of the CARINA-ATL nutrient data followed the procedures described in Tanhua et al. (2009b). The single most important strategy in the secondary quality control of nutrients was the crossover analysis, i.e. cruise tracks that crossed each other, or at least came close to each other, were considered as a crossover. For each
25
ESSDD
2, 63–101, 2009
CARINA: nutrient data in the Atlantic
Ocean
T. Tanhua et al.
Title Page
Abstract Instruments
Data Provenance & Structure
Tables Figures
◭ ◮
◭ ◮
Back Close
Full Screen / Esc
Printer-friendly Version
Interactive Discussion being an offset and a standard deviation of the offset. These were pooled with offsets
and uncertainties from all other crossovers and used to generate a set of corrections for each cruise using a set of least square inversions, suggestions that were then critically examined in light of local variability and crossover with core cruises. After the crossover analysis, and armed with the corrections suggested by the inversion, the offsets for
5
each variable (nitrate, phosphate and silicate) and each cruise were scrutinized, and an adjustment was applied to the data product. For nutrients multiplicative adjustments were used, and all were all agreed within the CARINA-ATL group during a meeting in Paris in June of 2008. No adjustments smaller than 2% were made to the nutrients based on the typically reported values of precision of nutrient measurements and the
10
expected natural variability of nutrient concentrations in the deep water of the Atlantic Ocean. However, based on an error analysis of the crossover analysis (Tanhua et al., 2009b) it seems that the 2% cut-offlimit was somewhat optimistic for phosphate and silicate, but realistic for nitrate.
Three sources of evidence were used for the determination of adjustments for the
15
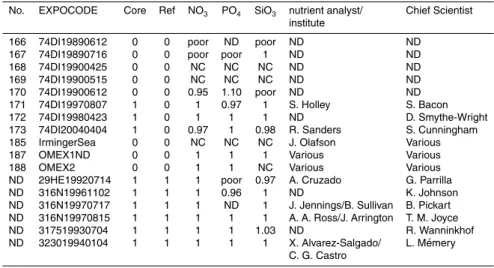
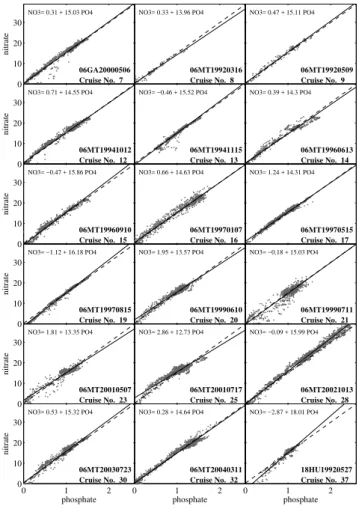
nutrient values: the corrections suggested by the inversion, the average of the offsets for all crossovers, and the crossover results to the core cruises. Any offsets toward these core cruises did generally weigh higher in the secondary QC with the exception of a few core cruises that needed adjustment of nutrient values themselves. Plots of nitrate vs. phosphate were an additional useful tool to identify cruises where a
20
bias in one of the two nutrients (phosphate or nitrate) could be identified (Fig. 2). A second inversion was made using the adjusted CARINA-ATL data, and all remaining corrections larger than±2% were evaluated again. This process led to a small number of changes to the adjustments agreed on in Paris.
4 Atlantic Ocean nutrient analysis
25
ESSDD
2, 63–101, 2009
CARINA: nutrient data in the Atlantic
Ocean
T. Tanhua et al.
Title Page
Abstract Instruments
Data Provenance & Structure
Tables Figures
◭ ◮
◭ ◮
Back Close
Full Screen / Esc
Printer-friendly Version
Interactive Discussion data also showed large offsets between cruises, but in this case it seemed to be due to
natural variability in addition to analytical biasing, i.e. with varying fractions of Antarctic Bottom Water with high silicate concentrations. Thus, secondary QC was more difficult to perform for silicate than for the other nutrients, and a somewhat larger tolerance to natural variability was allowed. The offsets for the crossovers calculated for the data
5
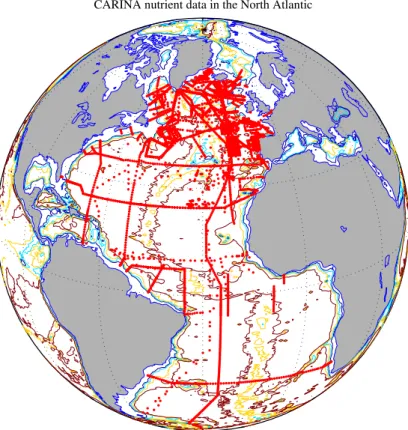
product was used to estimate the overall accuracy of the nutrient data, Fig. 3. We calculated the weighted mean (WM) for each of the three nutrients using the absolute value of the offset (D) ofLcrossovers with the uncertainty (σ):
WM=
L
P
i=1
D(i)/(σ(i)2
L
P
i=1
1/(σ(i)2
Based on this analysis we estimate the internal consistency of the CARINA-ATL
nu-10
trient data to: nitrate 1.5%; phosphate 2.6%; silicate 3.1%. The corrections to the CARINA-ATL nutrient data suggested by the inversion are shown in Fig. 4. All results and analyses made by the authors for the secondary QC, including figures for each individual crossover can be found on the CARINA website (Tanhua et al., 2009b) at http://cdiac.ornl.gov/oceans/CARINA/Carina inv.html.
15
In this section we show the motivation for all adjustments that have been applied to the nutrient data. In some cases the lack of an adjustment for a cruise that has large offsets to other cruises is also explained here. Nutrient data that did not show any evidence of bias are not further discussed any further.
A crossover results in anoffset for the cruise of interest (cruise A) relative to another
20
cruise (cruise B), i.e.offset=cruise A/cruise B. Thus if the offset is less than unity, the values from cruise A are lower than those from cruise B. Similarly, if the average of all crossovers for cruise A is less than unity, the values from cruise A are lower than the values from other cruises in the area. The inversion process results in a suggestion for
acorrectionto cruise A. If cruise A is lower than other cruises in the area, the correction
ESSDD
2, 63–101, 2009
CARINA: nutrient data in the Atlantic
Ocean
T. Tanhua et al.
Title Page
Abstract Instruments
Data Provenance & Structure
Tables Figures
◭ ◮
◭ ◮
Back Close
Full Screen / Esc
Printer-friendly Version
Interactive Discussion will most likely be larger than unity, i.e. the data from cruise A will have to be corrected
upwards for consistency with other cruises. When we discussadjustment, we refer to the correction that was actually applied to the data.
Consider for example the silicate data from cruise 06GA20000506 (below): the sil-icate data seems to be low compared to other cruises in the area since the average
5
offset of all crossovers is less than unity (0.94). Thus 06GA20000506 would need a
correctionthat is larger than unity to be consistent with the other cruise, exactly what
the inversion then suggests (1.05–1.06). Based on this evidence, we applied an
ad-justment of 1.05 to the silicate data for this cruise, i.e. the reported silicate data were
multiplied with 1.05 in the data product. While the secondary QC provided objectively
10
determined quantitative corrections, the applied adjustments were subjectively deter-mined by the CARINA-ATL working group based on all available evidence and firsthand information regarding methods, personnel etc.
4.1 Nutrient adjustments
06GA20000506, cruise #7
15
Silicate: The average of all crossovers is 0.94 and the inversion suggest a correction
of 1.05–1.06. Crossovers with the core cruises suggest that the silicate data are too low. Based on this evidence, an adjustment of 1.06 was applied to the silicate data.
06MT19920316, cruise #8
This cruise has only 1 deep station with nutrient samples, which prevent crossover
20
ESSDD
2, 63–101, 2009
CARINA: nutrient data in the Atlantic
Ocean
T. Tanhua et al.
Title Page
Abstract Instruments
Data Provenance & Structure
Tables Figures
◭ ◮
◭ ◮
Back Close
Full Screen / Esc
Printer-friendly Version
Interactive Discussion 06MT19920509, cruise #9
Nitrate:The average of all crossovers is 1.10 and the inversion suggests a correction of
0.9. Crossovers with the core cruises suggest that the nitrate data are too high. Based on this evidence, an adjustment of 0.90 was applied to the nitrate data.
06MT19941115, cruise #13
5
Nitrate: Nutrients for this cruise were also analyzed by Gouretski and Jancke (2001)
who determined a bias for the nitrate data of 0.79µmol/kg. The average of all crossovers is 1.047 and the inversion suggests a correction of 0.98. Crossovers with the core cruises (with the exception of 18HU19970509) suggest that the nitrate data are too high. Based on this evidence, an adjustment of 0.98 was applied to the nitrate
10
data.
06MT19960613, cruise #14
Phosphate: The average of all crossovers is 0.89 and the inversion suggests a
correc-tion of 1.17. Crossovers with the core cruises suggest that the phosphate data are too low. Based on this evidence, an adjustment of 1.15 was applied to the phosphate data.
15
Silicate: The average of all crossovers is 0.87 and the inversion suggests a correction
of 1.13. The crossovers with the core cruises suggest that the silicate data are too low. The crossover analysis of the adjusted data (1.13) suggests that this adjustment was too large; the new inversion suggest a correction of 0.96, and the average of all crossovers is 1.02. Based on this evidence, an adjustment of 1.11 was applied to the
20
ESSDD
2, 63–101, 2009
CARINA: nutrient data in the Atlantic
Ocean
T. Tanhua et al.
Title Page
Abstract Instruments
Data Provenance & Structure
Tables Figures
◭ ◮
◭ ◮
Back Close
Full Screen / Esc
Printer-friendly Version
Interactive Discussion 06MT19960910, cruise #15
Silicate: The average of all crossovers is 0.95 (with large scatter) and the inversion
suggests a correction of 1.05. The crossovers with the core cruises suggest that the silicate data are too low. Based on this evidence, an adjustment of 1.05 was applied to the silicate data.
5
06MT19970107, cruise #16
This cruise covers only a very small region close to the Canary Islands and has few crossovers.
Nitrate: The average of all crossovers is 1.01 and the inversion suggests a correction
of 0.95. Crossovers with the two repeats of the A05 section suggest that the nitrate
10
data are good. Based on this no adjustment was applied to the nitrate data.
Phosphate: The average of all crossovers is 1.06 (heavily biased by one outlier) and
the inversions suggest a correction of 1.02. The crossovers with the two repeats of the A05 section suggest that the phosphate data are too low. Based on this evidence, an adjustment of 1.05 was applied to the phosphate data.
15
Silicate: The average of all crossovers is 0.86 and the inversion suggests correction of
1.07. Crossovers with the two repeats of the A05 section and 33RO19980123 suggest that the silicate data are too low. Based on this evidence, an adjustment of 1.13 was applied to the silicate data.
06MT19970515, cruise #17
20
Nitrate:The average of all crossovers is 0.96 and the inversion suggest a correction of
ESSDD
2, 63–101, 2009
CARINA: nutrient data in the Atlantic
Ocean
T. Tanhua et al.
Title Page
Abstract Instruments
Data Provenance & Structure
Tables Figures
◭ ◮
◭ ◮
Back Close
Full Screen / Esc
Printer-friendly Version
Interactive Discussion
Phosphate: The average of all crossovers is 1.06 and the inversion suggests a
cor-rection of 0.95. Crossovers with the core cruises suggest that the phosphate data are too high. Based on this evidence, an adjustment of 0.95 was applied to the phosphate data.
These two adjustments increased the N/P ratio from 13.0 to 14.3.
5
06MT19970707, cruise #18
Nitrate: The average of all crossovers is 0.98 and the inversion suggests a correction
of 1.02. Crossovers with the core cruises suggest that the nitrate data are too low. Based on this evidence, an adjustment of 1.02 was applied to the nitrate data.
06MT19990711, cruise #21
10
Phosphate:The crossover analysis and the inversion of the adjusted data consistently
suggest that this cruise needs an upward adjustment. The average of all crossovers is 0.96 and the inversion suggests an adjustment of 1.04. Based on this evidence, an adjustment of 1.04 was applied to the phosphate data.
06MT20010507, cruise #23
15
Phosphate: The average of all crossovers is 0.89 and the inversion suggests a
ESSDD
2, 63–101, 2009
CARINA: nutrient data in the Atlantic
Ocean
T. Tanhua et al.
Title Page
Abstract Instruments
Data Provenance & Structure
Tables Figures
◭ ◮
◭ ◮
Back Close
Full Screen / Esc
Printer-friendly Version
Interactive Discussion 06MT20010717, cruise #25
Phosphate:The average of all crossovers is 0.78 and the inversion suggests a
correc-tion of 1.20. The inversion of the adjusted (1.20) data suggest addicorrec-tional adjustment of 1.05, and the average of the crossovers is now 0.95. Based on this evidence, an adjustment of 1.25 was applied to the phosphate data.
5
06MT20021013, cruise #28
Silicate: The average of all crossovers (only 2) is 1.10 and the inversion suggests a
correction of 0.90–0.92. Crossovers with the core cruises (A16 repeats) suggest that the silicate data are too high. Based on this evidence, an adjustment of 0.92 was applied to the silicate data.
10
06MT20040311, cruise #32
Phosphate:The average of all crossovers is 1.05 and the inversion suggests a
correc-tion of 0.93. Crossovers with the core cruises suggest that the phosphate data are too high. However, the crossover analysis of the adjusted (0.94) data suggests that this cruise was adjusted too much. The average of the crossovers is 0.96 and the inversion
15
suggests an adjustment of 1.04. Based on this evidence, an adjustment of 0.97 was applied to the phosphate data.
18HU1992052, cruise #37
Phosphate: The average of all crossovers is 1.04 and the inversion suggests a
cor-rection of 0.97. Crossovers with the core cruises suggest that the phosphate data are
ESSDD
2, 63–101, 2009
CARINA: nutrient data in the Atlantic
Ocean
T. Tanhua et al.
Title Page
Abstract Instruments
Data Provenance & Structure
Tables Figures
◭ ◮
◭ ◮
Back Close
Full Screen / Esc
Printer-friendly Version
Interactive Discussion too high. Based on this evidence, an adjustment of 0.98 was applied to the phosphate
data.
18HU19930405, cruise #38
This cruise has only samples down to 1000 m depth, which prevent crossover analysis, and make the secondary QC difficult. The nutrient data for this cruise is not considered
5
in the secondary QC.
18HU19940524, cruise #41
Phosphate: The average of all crossovers is 1.15 and the inversion suggests a
cor-rection of 0.89. Crossovers with the core cruises suggest that the phosphate data are too high. Based on this evidence, an adjustment of 0.89 was applied to the phosphate
10
data.
29CS19771007, cruise #51
This cruise has only samples down to less than 1500 m depth, which prevent crossover analysis, and make the secondary QC difficult. The nutrient data for this cruise is not considered in the secondary QC.
15
29CS19930510, cruise #52
Silicate: The average of all crossovers is 0.89 and the inversion suggests a correction
of 1.06. However, due to no offset in the shallower waters and the fact that there is evidence in salinity and alkalinity that the properties of the deep water has changed, the silicate data are not considered in the secondary QC.
ESSDD
2, 63–101, 2009
CARINA: nutrient data in the Atlantic
Ocean
T. Tanhua et al.
Title Page
Abstract Instruments
Data Provenance & Structure
Tables Figures
◭ ◮
◭ ◮
Back Close
Full Screen / Esc
Printer-friendly Version
Interactive Discussion 29GD19821110, cruise #53
Nitrate: The average of all crossovers is 0.90 and the inversion suggests a correction
of 1.02–1.03. Crossovers with the core cruises suggest that the nitrate data are too low. Based on this evidence, an adjustment of 1.02 was applied to the nitrate data.
Phosphate: The average of all crossovers is 1.05 and the inversion suggests a
cor-5
rection of 0.96, but with high uncertainty in the crossovers. Crossovers with the core cruises suggest that the phosphate data are too high. Based on this evidence a con-servative adjustment of 0.98 was applied to the phosphate data.
29GD19831201, cruise #54
This cruise has only few samples deeper than 1500 m depth, which prevent crossover
10
analysis, and make the secondary QC difficult. The nutrient data for this cruise is not considered in the secondary QC.
29GD19840218, cruise #55
Nitrate:The average of all the crossovers is 1.05 and the inversion suggests a
correc-tion of 0.95. Crossovers with the core cruises suggest that the nitrate data are too high.
15
Based on this evidence, an adjustment of 0.95 was applied to the nitrate data.
Silicate: The average of all crossovers is 0.99 and the inversion suggests a correction
of 0.95. However, there are few and inconclusive crossovers with the core cruises. Additionally, natural silicate variability in Mediterranean Outflow region is too large to suggest the adjustment from the inversion. Based on this evidence no adjustment was
20
ESSDD
2, 63–101, 2009
CARINA: nutrient data in the Atlantic
Ocean
T. Tanhua et al.
Title Page
Abstract Instruments
Data Provenance & Structure
Tables Figures
◭ ◮
◭ ◮
Back Close
Full Screen / Esc
Printer-friendly Version
Interactive Discussion 29HE19980730, cruise #60
Nitrate:The average of all crossovers is 0.94 and the inversion suggests a correction of
1.04. Crossovers with the core cruise suggest that the nitrate data are too low. Based on this evidence, an adjustment of 1.07 was applied to the nitrate data.
Phosphate: The average of all crossovers is 0.88 and the inversion suggests a
correc-5
tion of 1.05. There is considerable scatter in the phosphate data, but crossovers with the core cruises suggest that the phosphate data are too low. Based on this evidence, the phosphate data were flagged as questionable, and are not included in the data product.
Silicate: The average of all crossovers is 0.90 and the inversion suggests a correction
10
of 1.14 Crossovers with the core cruises suggests that the silicate data are too low. Based on this evidence, an adjustment of 1.14 was applied to the silicate data.
29HE20030408, cruise #63
This cruise has large distances between stations and most crossovers do not qualify due to too few data.
15
Silicate: The average of all crossovers is 0.89 and the inversion suggests a correction
of 1.08. Crossovers with the core cruises suggest that the silicate data are too low. Based on this evidence, an adjustment of 1.08 was applied to the silicate data.
Phosphate:The average of all crossovers is 0.90 and the inversion suggests a
correc-tion of 1.12. Crossovers with the core cruises suggest that the phosphate data are too
20
low. Based on this evidence, an adjustment of 1.12 was applied to the phosphate data.
316N20031023, cruise #69
Phosphate: The average of all crossovers is 0.97 and the inversion suggests a
ESSDD
2, 63–101, 2009
CARINA: nutrient data in the Atlantic
Ocean
T. Tanhua et al.
Title Page
Abstract Instruments
Data Provenance & Structure
Tables Figures
◭ ◮
◭ ◮
Back Close
Full Screen / Esc
Printer-friendly Version
Interactive Discussion low. Based on this evidence, an adjustment of 1.03 was applied to the phosphate data.
32EV19910328, cruise #71
Nitrate: The average of all crossovers is 0.95 and the inversion suggests a correction
of 1.04–1.05. Crossovers with the core cruises suggest that the nitrate data are too low. Based on this evidence, an adjustment of 1.05 was applied to the nitrate data.
5
Silicate: The average of all crossovers is 1.099 and the inversion suggests an
ad-justment of 0.94. However, the high variability of the region is recognized, and no adjustment is applied to the silicate data.
33RO20050111, cruise #87
Phosphate: The average of all crossovers is 0.96 and the inversion suggests a
cor-10
rection of 1.03. Crossovers with the core cruises suggest that the phosphate data are too low. Most importantly, the overlap with 33RO20030604 and 317519930704 (i.e. re-peats of the A16N section) support this. Based on this evidence, an adjustment of 1.03 was applied to the phosphate data.
33SW20010102, cruise #89
15
This cruise has only 3 deep stations with nutrient samples, which prevent crossover analysis, and make the secondary QC difficult. There is however significant scatter in the nitrate/phosphate relation (Fig. 2c), which could indicate poor precision of the mea-surements, but could potentially reflect differences N/P between the different hydro-graphic areas covered by this cruise. The nutrient data for this cruise is not considered
20
ESSDD
2, 63–101, 2009
CARINA: nutrient data in the Atlantic
Ocean
T. Tanhua et al.
Title Page
Abstract Instruments
Data Provenance & Structure
Tables Figures
◭ ◮
◭ ◮
Back Close
Full Screen / Esc
Printer-friendly Version
Interactive Discussion 34AR19970805, cruise #91
Nutrient samples from this cruise were poisoned with chloroform and measured ashore. All data are from a variable region (Greenland-Scotland Ridge) and are thus difficult analyze for secondary QC.
Nitrate: The average of all crossovers is 0.95 and the inversion suggests a correction
5
of 1.05. Crossovers with the core cruises suggest that the nitrate data are too low. Based on this evidence, an adjustment of 1.05 was applied to the nitrate data.
Phosphate: The average of all crossovers is 0.93 and the inversion suggests an
ad-justment of 1.05. Crossovers with the core cruises suggest that the phosphate data are too low. Based on this evidence, an adjustment of 1.04 was applied to the phosphate
10
data.
Silicate: The average of all crossovers is 0.85 and the inversion suggests a correction
of 1.14. Crossovers with the core cruises suggest that the silicate data are too low. Based on this evidence, an adjustment of 1.15 was applied to the silicate data.
35A320010203, cruise #92
15
Nitrate: The average of all crossovers is 1.03 and the inversion suggests a correction
of 0.97–0.98. Crossovers with the core cruises suggest that the nitrate data are too high. Based on this evidence, an adjustment of 0.98 was applied to the nitrate data.
35A320010322, cruise #93
Nitrate: The average of all crossovers is 1.04 and the inversion suggests a correction
20
ESSDD
2, 63–101, 2009
CARINA: nutrient data in the Atlantic
Ocean
T. Tanhua et al.
Title Page
Abstract Instruments
Data Provenance & Structure
Tables Figures
◭ ◮
◭ ◮
Back Close
Full Screen / Esc
Printer-friendly Version
Interactive Discussion 35TH19990712, cruise #106,
Phosphate: The average of all crossovers is 1.07 and the inversion suggests a
correc-tion of 0.94. The phosphate data has only a resolucorrec-tion of 0.1µmol/kg and crossovers with the core cruises suggest that the phosphate date are too high. Based on the large offsets, and the poor resolution of the data, the phosphate data are flagged as
5
questionable and not included in the data product.
35TH20010823, cruise #107
Phosphate: The average of all crossovers is 1.09 and the inversion suggests a
cor-rection of 0.96. Crossovers with the core cruises suggest that the phosphate data are too high. Based on this evidence, an adjustment of 0.96 was applied to the phosphate
10
data.
Silicate: The average of all crossovers is 0.94 and the inversion suggests a correction
of 1.07. Crossovers with the core cruises suggest that the silicate data are too low. Based on this evidence, an adjustment of 1.07 was applied to the silicate data.
35TH20020611, cruise #108
15
Phosphate: The average of all crossovers is 1.04 and the inversions suggest a
ESSDD
2, 63–101, 2009
CARINA: nutrient data in the Atlantic
Ocean
T. Tanhua et al.
Title Page
Abstract Instruments
Data Provenance & Structure
Tables Figures
◭ ◮
◭ ◮
Back Close
Full Screen / Esc
Printer-friendly Version
Interactive Discussion 35TH20040604, cruise #109
Nitrate: The average of all crossovers is 1.04 and the inversion suggests a correction
of 0.96. Crossovers with the core cruises suggest that the nitrate data are too high. Based on this evidence, an adjustment of 0.96 was applied to the nitrate data.
Phosphate: The average of all crossovers is 0.90 and the inversion suggests a
correc-5
tion of 1.10. Crossovers with the core cruises suggest that the phosphate data are too low. Based on this evidence, an adjustment of 1.10 was applied to the phosphate data.
Silicate: The average of all crossovers is 1.04 and the inversion suggests a correction
of 0.97. The crossovers with the core cruises are inconclusive, but at least for the crossovers in the eastern basin, there is a clear tendency for the silicate data to be too
10
high. Based on this evidence, an adjustment of 0.98 was applied to the silicate data.
58JH19920712, cruise #130
This cruise is conducted in the overflow region of the Greenland-Scotland Ridge. Due to the high variability in the area this cruise is not considered in the secondary QC.
58JH19940723, cruise #135
15
This cruise is conducted in the overflow region of the Greenland-Scotland Ridge. Due to the high variability in the area this cruise is not considered in the secondary QC.
Phosphate: The average of all crossovers and the inversion indicate the phosphate
values are high with about 6–10%. The N/P relation reveals an unusually large negative intercept that seems to be due to problems with the phosphate rather than nitrate.
20
ESSDD
2, 63–101, 2009
CARINA: nutrient data in the Atlantic
Ocean
T. Tanhua et al.
Title Page
Abstract Instruments
Data Provenance & Structure
Tables Figures
◭ ◮
◭ ◮
Back Close
Full Screen / Esc
Printer-friendly Version
Interactive Discussion 64PE20000926, cruise #152
Phosphate: The average of all crossovers is 1.03 and the inversion suggests a
cor-rection of 0.96. Crossovers with the core cruises suggest that the phosphate data are too high. Based on this evidence, an adjustment of 0.96 was applied to the phosphate data.
5
64TR19890731, cruise #153
Nitrate: The average of all crossovers is 1.04 and the inversion suggests a correction
of 0.97. Crossovers with the core cruises suggest that the nitrate data are too high. Based on this evidence, an adjustment of 0.96 was applied to the nitrate data.
Phosphate: The average of all crossovers is 1.00, but with large uncertainty, and the
10
inversion suggests a correction of 1.07. Crossovers with the core cruises suggest that the phosphate data are of poor quality. Based on this evidence, the phosphate data are flagged questionable and are not included in the data product.
64TR19900417, cruise #154
Phosphate: The average of all crossovers is 1.09 and the inversion suggests a
cor-15
rection of 0.96. Crossovers with the core cruises suggest that the phosphate data are too high. Based on this evidence, an adjustment of 0.96 was applied to the phosphate data.
64TR19910408, cruise #156
Phosphate: The average of all crossovers is 1.08 and the inversion suggests a
cor-20
ESSDD
2, 63–101, 2009
CARINA: nutrient data in the Atlantic
Ocean
T. Tanhua et al.
Title Page
Abstract Instruments
Data Provenance & Structure
Tables Figures
◭ ◮
◭ ◮
Back Close
Full Screen / Esc
Printer-friendly Version
Interactive Discussion data are too high. Based on this evidence, an adjustment of 0.93 was applied to the
phosphate data.
67SL19881117, cruise #158
This cruise has no samples deeper than 1200 m depth, which prevent crossover anal-ysis, and make the secondary QC difficult. The nutrient data for this cruise is not
5
considered in the secondary QC.
74AB19900528, cruise #159
Nitrate: The average of all crossovers is 0.92 and the inversion suggests a correction
of 1.10–1.11. Crossovers with the core cruises suggest that the nitrate data are too low. Based on this evidence, an adjustment of 1.11 was applied to the nitrate data.
10
Silicate: The average of all crossovers is 0.93, but with large variability, and the
in-version suggests a correction of 1.16. Crossovers with the core cruises suggest that the silicate data are not biased. There are large variability in the data, and few data points to base the adjustments on. Therefore the silicate data are not considered in the secondary QC.
15
74AB19910501, cruise #160
Silicate: The average of all crossovers is 1.05 and the inversion suggests a correction
ESSDD
2, 63–101, 2009
CARINA: nutrient data in the Atlantic
Ocean
T. Tanhua et al.
Title Page
Abstract Instruments
Data Provenance & Structure
Tables Figures
◭ ◮
◭ ◮
Back Close
Full Screen / Esc
Printer-friendly Version
Interactive Discussion 74AB19910614, cruise #161
This cruise has no deep samples, which prevent crossover analysis, and make the sec-ondary QC difficult. The nutrient data for this cruise is not considered in the secondary QC.
74AB19910712, cruise #162
5
This cruise has few deep samples, all in a variable area.
Nitrate: The nitrate data are not considered due to the few deep nitrate samples, even
though the average of all crossovers is 0.94 and the inversion suggest a correction of 1.06.
Silicate: The average of all crossovers is 1.13 and the inversions suggest a correction
10
of 0.90. Crossovers with the core cruises suggest that the silicate data are too high. Based on this evidence, an adjustment of 0.90 was applied to the silicate data
74AB20050501, cruise #164
Nitrate: The average of all crossovers is 1.03 and the inversion suggests a correction
of 0.98. Crossovers with the core cruises suggest that the nitrate data are too high.
15
Based on this evidence, an adjustment of 0.98 was applied to the nitrate data.
Phosphate: The average of all crossovers is 1.04 and the inversion suggests a
cor-rection of 0.98. Crossovers with the core cruises suggest that the phosphate data are too high. Based on this evidence, an adjustment of 0.97 was applied to the phosphate data.
20
Silicate: The average of all crossovers is 1.12 and the inversions suggest a correction
ESSDD
2, 63–101, 2009
CARINA: nutrient data in the Atlantic
Ocean
T. Tanhua et al.
Title Page
Abstract Instruments
Data Provenance & Structure
Tables Figures
◭ ◮
◭ ◮
Back Close
Full Screen / Esc
Printer-friendly Version
Interactive Discussion 74DI19890511, cruise #165
This cruise has no deep samples, which prevent crossover analysis, and make the sec-ondary QC difficult. The nutrient data for this cruise is not considered in the secondary QC.
74DI19890612, cruise #166
5
Only few stations for this cruise have deep nutrient data.
Nitrate: The average of all crossovers is 0.96, but with high standard deviations, and
the inversions suggest a correction of 1.10. Crossovers with the core cruises suggest that the nitrate data is of poor quality. Based on this evidence, the nitrate data was flagged as questionable, and are not included in the data product.
10
Silicate: The average of all crossovers is 0.92, but with large standard deviations, and
the inversion suggests a correction of 1.10. Crossovers with the core cruises suggest that the silicate data are of low quality. Based on this evidence, the silicate data was flagged as questionable, and are not included in the data product.
74DI19890716, cruise #167
15
Nitrate: The average of all crossovers is 0.89 and the inversion suggests a correction
of 1.17. Crossovers with the core cruises suggest that the nitrate data are much too low. Based on the high offset, the nitrate data was flagged as questionable, and are not included in the data product.
Phosphate: The average of all crossovers is 1.09, but with large standard deviations,
20
ESSDD
2, 63–101, 2009
CARINA: nutrient data in the Atlantic
Ocean
T. Tanhua et al.
Title Page
Abstract Instruments
Data Provenance & Structure
Tables Figures
◭ ◮
◭ ◮
Back Close
Full Screen / Esc
Printer-friendly Version
Interactive Discussion
Silicate: The average of all crossovers is 0.99 and the inversion suggests a correction
of 1.06. Crossovers with the core cruises suggest that the silicate data are too low, but the results are inconclusive. The data seems to be with low precision, in addition to high variability in the area. Based on this evidence no adjustment was applied to the silicate data.
5
74DI19900425, cruise #168
This cruise has no deep samples, which prevent crossover analysis, and make the sec-ondary QC difficult. The nutrient data for this cruise is not considered in the secondary QC.
74DI19900515, cruise #169
10
This cruise has only few deep samples, which prevent crossover analysis, and make the secondary QC difficult. The nutrient data for this cruise is not considered in the secondary QC.
74DI19900612, cruise #170
There are only few deep nutrient samples for this cruise, making secondary QC difficult.
15
Nitrate: The average of all crossovers is 1.09 and the inversion suggest a correction of
0.92–0.93. Crossovers with the core cruises suggest that the nitrate data are too high. Based on this evidence, an adjustment of 0.95 was applied to the nitrate data.
Phosphate: The average of all crossovers is 0.90 and the inversion suggests a
correc-tion of 1.09. Crossovers with the core cruises suggest that the nitrate data are too low.
20
ESSDD
2, 63–101, 2009
CARINA: nutrient data in the Atlantic
Ocean
T. Tanhua et al.
Title Page
Abstract Instruments
Data Provenance & Structure
Tables Figures
◭ ◮
◭ ◮
Back Close
Full Screen / Esc
Printer-friendly Version
Interactive Discussion
Silicate: The average of all crossovers is 1.47, but with very different offsets for the
crossovers. There are too few deep silicate data to properly suggest a correction, and due to the large offsets in the few available crossovers, the silicate data were flagged as questionable and are not included in the data product.
74DI19970807, cruise #171
5
Phosphate: The crossover analysis and the inversion results of the adjusted data (1.00)
suggest that this cruise needs an adjustment. The judgment is difficult due to relatively large scatter in the data, but is facilitated by the large number of crossovers. The average of the crossovers is 1.04 and the inversion suggests a correction of 0.97. Based on this evidence, an adjustment of 0.97 was applied to the phosphate data.
10
74DI20040404, cruise #173
Nitrate: The average of all crossovers is 1.03 and the inversion suggests a correction
of 0.96–97. Crossovers with the core cruises suggest that the nitrate data are too high. Based on this evidence, an adjustment of 0.97 was applied to the nitrate data.
Silicate: The average of all crossovers is 1.05 and the inversion suggests a correction
15
of 0.97. Crossovers with the core cruises suggest that the silicate data are too high. Based on this evidence, an adjustment of 0.98 was applied to the silicate data.
IrmingerSea, cruise #185
This time series does not have any samples deeper than ∼1000 m, and is situated in a variable region, which prevent crossover analysis, and make the secondary QC
20
ESSDD
2, 63–101, 2009
CARINA: nutrient data in the Atlantic
Ocean
T. Tanhua et al.
Title Page
Abstract Instruments
Data Provenance & Structure
Tables Figures
◭ ◮
◭ ◮
Back Close
Full Screen / Esc
Printer-friendly Version
Interactive Discussion Reference cruises
316N19961102
This cruise is included in GLODAP, but no adjustments were suggested for the nutrient data.
Phosphate: The average of all crossovers is 1.05 and the inversion suggests a
cor-5
rection of 0.94. Crossovers with the core cruises suggest a slightly smaller correction. Based on this evidence we suggest an adjustment of 0.96 to the phosphate data.
29HE19920714
This cruise is not part of CARINA, but is included as a reference cruise.
Phosphate: Gouretski and Jancke (2001) found a bias of 0.03µmol/kg for the
phos-10
phate data. The average of all crossovers is 0.95 and the inversion suggests a correc-tion of 1.05–1.10. Crossovers with the core cruises suggest that the phosphate data are too low. This is also true for the two repeats of this section in 1998 and 2004. Based on this evidence, we suggest an adjustment of 1.05 for phosphate, but we also suggest that the phosphate data are flagged as questionable.
15
Silicate: Gouretski and Jancke (2001) found a bias of 1.9µmol/kg for the silicate data.
The average of all crossovers is 1.05 and the inversion suggests a correction of 0.95– 0.96. Crossovers with the core cruises suggest that the silicate data are too high. This is also true for the two repeats of this section in 1998 and 2004. Based on this evidence, we suggest an adjustment of 0.97 for the silicate data.
20
317519930704
ESSDD
2, 63–101, 2009
CARINA: nutrient data in the Atlantic
Ocean
T. Tanhua et al.
Title Page
Abstract Instruments
Data Provenance & Structure
Tables Figures
◭ ◮
◭ ◮
Back Close
Full Screen / Esc
Printer-friendly Version
Interactive Discussion
Silicate: GLODAP suggested an adjustment of −2.6µmol/kg for stations 1–31, and
+0.4µmol/kg for the other stations. The average of all crossovers is 0.97 and the
inversion suggests a correction of 1.03. Crossovers with the core cruises suggest that the silicate data are too low. Based on this evidence, we suggest an adjustment of 1.03 to the silicate data.
5
5 Data access
The whole CARINA database set is published at http://cdiac.ornl.gov/oceans/CARINA/ Carina inv.html. It contains 188 individual cruise files in comma-separated, WHPO exchange format. Condensed metadata are contained in the header of each data file. In addition, the CARINA database contains three merged, comma-separated data files
10
with the data products. These files are divided into the three geographical regions of CARINA. No special software is needed to access the data, but software for MATLAB users is offered to facilitate reading of the data.
Acknowledgements. This work has been performed and funded as part of the EU project Car-boOcean (Project 511176). Additional support from the International Ocean Carbon
Coordi-15
nation Project IOCCP (Maria Hood) and the Hanse Institute for Advanced Study (HWK Del-menhorst, Germany) are gratefully acknowledged. R. M. Key was additionally supported by NOAA grant NA08OAR4320752 and NA08OAR4310820; and P. J. Brown was additionally sup-ported by NERC Award NER/S/A/2004/12255. Without the dedication of all investigators and analysts who performed measurements, sometimes under adverse conditions, and contributed
20
ESSDD
2, 63–101, 2009
CARINA: nutrient data in the Atlantic
Ocean
T. Tanhua et al.
Title Page
Abstract Instruments
Data Provenance & Structure
Tables Figures
◭ ◮
◭ ◮
Back Close
Full Screen / Esc
Printer-friendly Version
Interactive Discussion References
Gouretski, V. V. and Jancke, K.: Systematic errors as the cause for an apparent deep water property variability: global analysis of the WOCE and historical hydrographic data, Prog. Oceanogr., 48, 337–402, 2001.
Key, R. M., Kozyr, A., Sabine, C. L., Lee, K., Wanninkhof, R., Bullister, J. L., Feely, R.
5
A., Millero, F. J., Mordy, C., and Peng, T. H.: A global ocean carbon climatology: Re-sults from Global Data Analysis Project (GLODAP), Global Biogeochem. Cy., 18, GB4031, doi:1029/2004GB002247, 2004.
Key, R. M., Tanhua, T., Olsen, A., Hoppema, M., Jutterstr ¨om, S., Schirnick, C., van Heuven, S., Lin, X., Wallace, D. W. R., and Mintrop, L.: The CARINA data synthesis project: Introduction
10
and overview, Earth Syst. Sci. Data Discuss., in preparation, 2009.
Tanhua, T., Steinfeldt, R., Key, R. M., Brown, P., Gruber, N., Wanninkhof, R., Perez, F., K ¨ortzinger, A., Velo, A., Schuster, U., van Heuven, S., Talley, L., Bullister, J. L., Stendardo, I., Hoppema, M., Olsen, A., Kozyr, A., Pierrot, D., Schirnick, C., and Wallace, D. W. R.: Overview of the Atlantic Ocean CARINA data and salinity measurements, Earth Syst. Sci.
15
Data Discuss., submitted, 2009a.
ESSDD
2, 63–101, 2009
CARINA: nutrient data in the Atlantic
Ocean
T. Tanhua et al.
Title Page
Abstract Instruments
Data Provenance & Structure
Tables Figures
◭ ◮
◭ ◮
Back Close
Full Screen / Esc
Printer-friendly Version
Interactive Discussion
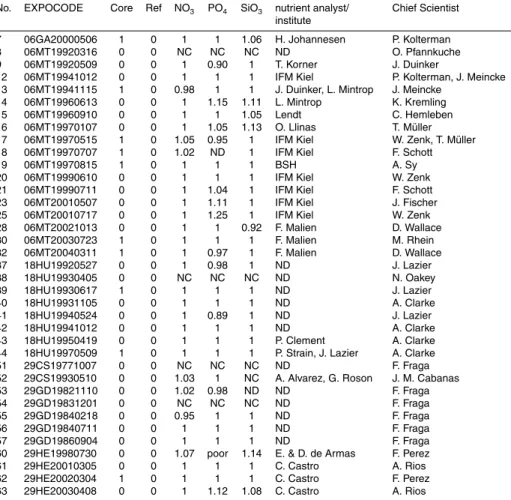
Table 1. All CARINA cruises in the Atlantic Ocean region were at least one nutrient was measured. The reference cruises are included in this table even though they are not part of CARINA; ND: no data (i.e. not measured), NC: not considered (i.e. did for some reason not go through secondary QC).
No. EXPOCODE Core Ref NO3 PO4 SiO3 nutrient analyst/ institute
Chief Scientist
7 06GA20000506 1 0 1 1 1.06 H. Johannesen P. Kolterman 8 06MT19920316 0 0 NC NC NC ND O. Pfannkuche 9 06MT19920509 0 0 1 0.90 1 T. Korner J. Duinker
12 06MT19941012 0 0 1 1 1 IFM Kiel P. Kolterman, J. Meincke 13 06MT19941115 1 0 0.98 1 1 J. Duinker, L. Mintrop J. Meincke
14 06MT19960613 0 0 1 1.15 1.11 L. Mintrop K. Kremling 15 06MT19960910 0 0 1 1 1.05 Lendt C. Hemleben 16 06MT19970107 0 0 1 1.05 1.13 O. Llinas T. M ¨uller 17 06MT19970515 1 0 1.05 0.95 1 IFM Kiel W. Zenk, T. M ¨uller 18 06MT19970707 1 0 1.02 ND 1 IFM Kiel F. Schott
19 06MT19970815 1 0 1 1 1 BSH A. Sy
20 06MT19990610 0 0 1 1 1 IFM Kiel W. Zenk 21 06MT19990711 0 0 1 1.04 1 IFM Kiel F. Schott 23 06MT20010507 0 0 1 1.11 1 IFM Kiel J. Fischer 25 06MT20010717 0 0 1 1.25 1 IFM Kiel W. Zenk 28 06MT20021013 0 0 1 1 0.92 F. Malien D. Wallace 30 06MT20030723 1 0 1 1 1 F. Malien M. Rhein 32 06MT20040311 1 0 1 0.97 1 F. Malien D. Wallace 37 18HU19920527 0 0 1 0.98 1 ND J. Lazier
38 18HU19930405 0 0 NC NC NC ND N. Oakey
39 18HU19930617 1 0 1 1 1 ND J. Lazier
40 18HU19931105 0 0 1 1 1 ND A. Clarke
41 18HU19940524 0 0 1 0.89 1 ND J. Lazier
42 18HU19941012 0 0 1 1 1 ND A. Clarke
43 18HU19950419 0 0 1 1 1 P. Clement A. Clarke 44 18HU19970509 1 0 1 1 1 P. Strain, J. Lazier A. Clarke
51 29CS19771007 0 0 NC NC NC ND F. Fraga
52 29CS19930510 0 0 1.03 1 NC A. Alvarez, G. Roson J. M. Cabanas 53 29GD19821110 0 0 1.02 0.98 ND ND F. Fraga
54 29GD19831201 0 0 NC NC NC ND F. Fraga
55 29GD19840218 0 0 0.95 1 1 ND F. Fraga
56 29GD19840711 0 0 1 1 1 ND F. Fraga
57 29GD19860904 0 0 1 1 1 ND F. Fraga
ESSDD
2, 63–101, 2009
CARINA: nutrient data in the Atlantic
Ocean
T. Tanhua et al.
Title Page
Abstract Instruments
Data Provenance & Structure
Tables Figures
◭ ◮
◭ ◮
Back Close
Full Screen / Esc
Printer-friendly Version
Interactive Discussion
Table 1.Continued.
No. EXPOCODE Core Ref NO3 PO4 SiO3 nutrient analyst/ institute
Chief Scientist
64 31AN19890420 0 0 1 1 1 ND P. Brewer
68 316N20030922 1 0 1 1 1 S. Becker/E. Quiroz J. Toole/A. MacDonald 69 316N20031023 1 0 1 1.03 1 S. Becker/D. Schuller T. M. Joyce /W. M. Smethie 71 32EV19910328 0 0 1.05 1 1 ND R. Pickart
84 33LK19960415 0 0 1 1 1 C. Oudot Y. Gouriou 85 33RO19980123 1 0 1 1 1 C. Mordy K. Lee/D. Bitterman 86 33RO20030604 1 0 1 1 1 C. Mordy/G. Johnson J. Bullister/N. Gruber 87 33RO20050111 1 0 1 1.03 1 AOML/U. Miami R. Wanninkhof/S. Doney 88 33SW20010102 0 0 NC NC NC ND A. Michaels/D. Capone 89 33SW20010102 0 0 NC NC NC ND A. Michaels/D. Capone 91 34AR19970805 0 0 1.05 1.04 1.15 T. Tanhua H. Gronvall/J. Launiainen 92 35A320010203 0 0 0.98 1 ND ND L. Prieur
93 35A320010322 0 0 0.98 1 ND ND M. Bianchi
94 35LU19890509 0 0 1 1 1 F. Fraga ND
95 35LU19950909 0 0 1 1 1 P. Fournier/C. Oudot Y. Gouriou 106 35TH19990712 0 0 1 poor 1 Y. Gouriou Y. Gouriou 107 35TH20010823 0 0 1 0.96 1.07 ND J.-C. Gascard 108 35TH20020611 1 0 1 0.96 1 P. Morin H. Mercier 109 35TH20040604 1 0 0.96 1.10 0.98 P. Morin T. Huck 113 49NZ20031106 1 0 1 1 1 M. Aoyama Y. Yoshikawa 130 58JH19920712 0 0 NC NC NC F. Rey J. Blindheim 135 58JH19940723 0 0 NC poor NC F. Rey J. Blindheim 151 64PE19960618 0 0 1 1 1 van Aken,
van Weerlee, van Ooijen/ P. Berkhout, M. Manuels
H. M. van Aken
152 64PE20000926 0 0 1 0.96 1 H. M. van Aken H. M. van Aken
153 64TR19890731 0 0 0.96 poor 1 ND ND
154 64TR19900417 0 0 1 0.96 1 I. Flameling, R. deVries, K. Bakker
H. G. Fransz
155 64TR19900701 1 0 1 1 1 H. M. van Aken H. M. van Aken 156 64TR19900714 0 0 1 1 1 H. M. van Aken H. M. van Aken 157 64TR19910408 1 0 1 0.93 1 H. M. van Aken H. M. van Aken
158 67SL19881117 0 0 NC ND NC ND A. Rios
159 74AB19900528 0 0 1.11 1 NC ND ND
160 74AB19910501 0 0 1 1 0.97 S. Hartman/R. Paylor R. Pollard
161 74AB19910614 0 0 NC NC NC ND ND
162 74AB19910712 0 0 NC ND 0.9 ND ND
164 74AB20050501 0 0 0.98 0.97 0.93 R. Sanders E. McDonagh
ESSDD
2, 63–101, 2009
CARINA: nutrient data in the Atlantic
Ocean
T. Tanhua et al.
Title Page
Abstract Instruments
Data Provenance & Structure
Tables Figures
◭ ◮
◭ ◮
Back Close
Full Screen / Esc
Printer-friendly Version
Interactive Discussion
Table 1.Continued.
No. EXPOCODE Core Ref NO3 PO4 SiO3 nutrient analyst/ institute
Chief Scientist
166 74DI19890612 0 0 poor ND poor ND ND
167 74DI19890716 0 0 poor poor 1 ND ND
168 74DI19900425 0 0 NC NC NC ND ND
169 74DI19900515 0 0 NC NC NC ND ND
170 74DI19900612 0 0 0.95 1.10 poor ND ND 171 74DI19970807 1 0 1 0.97 1 S. Holley S. Bacon 172 74DI19980423 1 0 1 1 1 ND D. Smythe-Wright 173 74DI20040404 1 0 0.97 1 0.98 R. Sanders S. Cunningham 185 IrmingerSea 0 0 NC NC NC J. Olafson Various
187 OMEX1ND 0 0 1 1 1 Various Various
188 OMEX2 0 0 1 1 NC Various Various
ND 29HE19920714 1 1 1 poor 0.97 A. Cruzado G. Parrilla ND 316N19961102 1 1 1 0.96 1 ND K. Johnson ND 316N19970717 1 1 1 ND 1 J. Jennings/B. Sullivan B. Pickart ND 316N19970815 1 1 1 1 1 A. A. Ross/J. Arrington T. M. Joyce ND 317519930704 1 1 1 1 1.03 ND R. Wanninkhof ND 323019940104 1 1 1 1 1 X. Alvarez-Salgado/
C. G. Castro
ESSDD
2, 63–101, 2009
CARINA: nutrient data in the Atlantic
Ocean
T. Tanhua et al.
Title Page
Abstract Instruments
Data Provenance & Structure
Tables Figures
◭ ◮
◭ ◮
Back Close
Full Screen / Esc
Printer-friendly Version
Interactive Discussion CARINA nutrient data in the North Atlantic
ESSDD
2, 63–101, 2009
CARINA: nutrient data in the Atlantic
Ocean
T. Tanhua et al.
Title Page
Abstract Instruments
Data Provenance & Structure
Tables Figures
◭ ◮
◭ ◮
Back Close
Full Screen / Esc
Printer-friendly Version Interactive Discussion 0 10 20 30 nitrate
NO3= 0.31 + 15.03 PO4
06GA20000506 Cruise No. 7
NO3= 0.33 + 13.96 PO4
06MT19920316 Cruise No. 8
NO3= 0.47 + 15.11 PO4
06MT19920509 Cruise No. 9
0 10 20 30
nitrate
NO3= 0.71 + 14.55 PO4
06MT19941012 Cruise No. 12
NO3= −0.46 + 15.52 PO4
06MT19941115 Cruise No. 13
NO3= 0.39 + 14.3 PO4
06MT19960613 Cruise No. 14
0 10 20 30
nitrate
NO3= −0.47 + 15.86 PO4
06MT19960910 Cruise No. 15
NO3= 0.66 + 14.63 PO4
06MT19970107 Cruise No. 16
NO3= 1.24 + 14.31 PO4
06MT19970515 Cruise No. 17
0 10 20 30
nitrate
NO3= −1.12 + 16.18 PO4
06MT19970815 Cruise No. 19
NO3= 1.95 + 13.57 PO4
06MT19990610 Cruise No. 20
NO3= −0.18 + 15.03 PO4
06MT19990711 Cruise No. 21
0 10 20 30
nitrate
NO3= 1.81 + 13.35 PO4
06MT20010507 Cruise No. 23
NO3= 2.86 + 12.73 PO4
06MT20010717 Cruise No. 25
NO3= −0.09 + 15.99 PO4
06MT20021013 Cruise No. 28
0 1 2
0 10 20 30 phosphate nitrate
NO3= 0.53 + 15.32 PO4
06MT20030723 Cruise No. 30
0 1 2
phosphate
NO3= 0.28 + 14.64 PO4
06MT20040311 Cruise No. 32
0 1 2
phosphate
NO3= −2.87 + 18.01 PO4
18HU19920527 Cruise No. 37
Figure 2a.
ESSDD
2, 63–101, 2009
CARINA: nutrient data in the Atlantic
Ocean
T. Tanhua et al.
Title Page
Abstract Instruments
Data Provenance & Structure
Tables Figures
◭ ◮
◭ ◮
Back Close
Full Screen / Esc
Printer-friendly Version Interactive Discussion 0 10 20 30 nitrate
NO3= −0.48 + 14.48 PO4
18HU19930405 Cruise No. 38
NO3= −4.43 + 18.86 PO4
18HU19930617 Cruise No. 39
NO3= −0.31 + 14.99 PO4
18HU19931105 Cruise No. 40
0 10 20 30
nitrate
NO3= −5.32 + 20.06 PO4
18HU19940524 Cruise No. 41
NO3= −1.11 + 16.1 PO4
18HU19941012 Cruise No. 42
NO3= −1.54 + 16.12 PO4
18HU19950419 Cruise No. 43
0 10 20 30
nitrate
NO3= −6.51 + 21.45 PO4
18HU19970509 Cruise No. 44
NO3= −0.19 + 17.16 PO4
29CS19771007 Cruise No. 51
NO3= −0.2 + 16.45 PO4
29CS19930510 Cruise No. 52
0 10 20 30
nitrate
NO3= −0.06 + 16.56 PO4
29GD19821110 Cruise No. 53
NO3= −0.21 + 17.32 PO4
29GD19831201 Cruise No. 54
NO3= 1.17 + 15.9 PO4
29GD19840218 Cruise No. 55
0 10 20 30
nitrate
NO3= −0.2 + 16.86 PO4
29GD19840711 Cruise No. 56
NO3= −0.43 + 17.11 PO4
29GD19860904 Cruise No. 57
NO3= −0.72 + 16.2 PO4
29HE20010305 Cruise No. 61
0 1 2
0 10 20 30 phosphate nitrate
NO3= −0.64 + 15.73 PO4
29HE20020304 Cruise No. 62
0 1 2
phosphate
NO3= 0.04 + 15.39 PO4
29HE20030408 Cruise No. 63
0 1 2
phosphate
NO3= −0.31 + 16.24 PO4
31AN19890420 Cruise No. 64
Figure 2b.
ESSDD
2, 63–101, 2009
CARINA: nutrient data in the Atlantic
Ocean
T. Tanhua et al.
Title Page
Abstract Instruments
Data Provenance & Structure
Tables Figures
◭ ◮
◭ ◮
Back Close
Full Screen / Esc
Printer-friendly Version Interactive Discussion 0 10 20 30 nitrate
NO3= −0.1 + 15.16 PO4
316N20030922 Cruise No. 68
NO3= 0.3 + 14.57 PO4
316N20031023 Cruise No. 69
NO3= −2.51 + 16.95 PO4
32EV19910328 Cruise No. 71
0 10 20 30
nitrate
NO3= 0.1 + 15.09 PO4
33LK19960415 Cruise No. 84
NO3= 0.83 + 14.5 PO4
33RO19980123 Cruise No. 85
NO3= −0.07 + 15.33 PO4
33RO20030604 Cruise No. 86
0 10 20 30
nitrate
NO3= −1.08 + 15 PO4
33RO20050111 Cruise No. 87
NO3= −1.38 + 14.91 PO4
33SW20010102 Cruise No. 89
NO3= −4.75 + 19.93 PO4
34AR19970805 Cruise No. 91
0 10 20 30
nitrate
NO3= 1.04 + 15.07 PO4
35A320010203 Cruise No. 92
NO3= 0.48 + 15.2 PO4
35A320010322 Cruise No. 93
NO3= 1.08 + 14.26 PO4
35LU19890509 Cruise No. 94
0 10 20 30
nitrate
NO3= −0.04 + 15.01 PO4
35LU19950909 Cruise No. 95
NO3= 0.52 + 14.75 PO4
35TH20010823 Cruise No. 107
NO3= 0.48 + 15.04 PO4
35TH20020611 Cruise No. 108
0 1 2
0 10 20 30 phosphate nitrate
NO3= 1.01 + 14.09 PO4
35TH20040604 Cruise No. 109
0 1 2
phosphate
NO3= −2.08 + 15.62 PO4
49NZ20031106 Cruise No. 113
0 1 2
phosphate
NO3= −1.75 + 17.7 PO4
58JH19920712 Cruise No. 130
Figure 2c.
ESSDD
2, 63–101, 2009
CARINA: nutrient data in the Atlantic
Ocean
T. Tanhua et al.
Title Page
Abstract Instruments
Data Provenance & Structure
Tables Figures
◭ ◮
◭ ◮
Back Close
Full Screen / Esc
Printer-friendly Version Interactive Discussion 0 10 20 30 nitrate
NO3= 0.68 + 14.92 PO4
64PE19960618 Cruise No. 151
NO3= −0.92 + 16.52 PO4
64PE20000926 Cruise No. 152
NO3= −0.76 + 15.73 PO4
64TR19900417 Cruise No. 154
0 10 20 30
nitrate
NO3= 0.25 + 14.42 PO4
64TR19900701 Cruise No. 155
NO3= −0.5 + 15.18 PO4
64TR19900714 Cruise No. 156
NO3= 1.71 + 13.96 PO4
64TR19910408 Cruise No. 157
0 10 20 30
nitrate
NO3= −0.82 + 17.14 PO4
74AB19900528 Cruise No. 159
NO3= 1.89 + 14.55 PO4
74AB19910501 Cruise No. 160
NO3= −0.68 + 14.71 PO4
74AB19910614 Cruise No. 161
0 10 20 30
nitrate
NO3= 0.65 + 14.92 PO4
74AB20050501 Cruise No. 164
NO3= 1.62 + 13.13 PO4
74DI19900425 Cruise No. 168
NO3= −0.29 + 17.61 PO4
74DI19900515 Cruise No. 169
0 10 20 30
nitrate
NO3= 0.78 + 15.01 PO4
74DI19900612 Cruise No. 170
NO3= 0.15 + 14.76 PO4
74DI19970807 Cruise No. 171
NO3= 1.46 + 13.92 PO4
74DI19980423 Cruise No. 172
0 1 2
0 10 20 30 phosphate nitrate
NO3= 0.56 + 14.26 PO4
74DI20040404 Cruise No. 173
0 1 2
phosphate
NO3= 0 + 15.51 PO4
IrmingerSea Cruise No. 185
0 1 2
phosphate
NO3= −0.51 + 16.24 PO4
OMEX1NA Cruise No. 187
Figure 2d. 0 10 20 30 nitrate
NO3= −0.52 + 16.88 PO4
OMEX2 Cruise No. 188
ESSDD
2, 63–101, 2009
CARINA: nutrient data in the Atlantic
Ocean
T. Tanhua et al.
Title Page
Abstract Instruments
Data Provenance & Structure
Tables Figures
◭ ◮
◭ ◮
Back Close
Full Screen / Esc
Printer-friendly Version
Interactive Discussion
0 200 400
0.7 0.8 0.9 1 1.1
1.2 F= 76 %WM = 1.5 % L= 441
nitrate
offset
0 200
0.7 0.8 0.9 1 1.1
1.2 F= 70 %WM = 2.6 % L= 396
phosphate
offset
0 200 400
0.7 0.8 0.9 1 1.1
1.2 F= 69 %WM = 3.1 % L= 450
silicate
offset
Fig. 3. Offsets calculated for the crossovers in the CARINA-ATL data after adjustments have
been applied. WL: the weighted mean of the offsets (see text); F: the percentage of offsets