www.atmos-chem-phys.net/16/15529/2016/ doi:10.5194/acp-16-15529-2016
© Author(s) 2016. CC Attribution 3.0 License.
Multidecadal variations of the effects of the Quasi-Biennial
Oscillation on the climate system
Stefan Brönnimann1,2, Abdul Malik1,2, Alexander Stickler1,2, Martin Wegmann1,2, Christoph C. Raible1,3, Stefan Muthers1,3, Julien Anet4, Eugene Rozanov5,6, and Werner Schmutz6
1Oeschger Centre for Climate Change Research, University of Bern, Bern, Switzerland 2Institute of Geography, University of Bern, Bern, Switzerland
3Climate and Environmental Physics, Physics Institute, University of Bern, Bern, Switzerland 4Swiss Federal Laboratories for Materials Science and Technology (Empa), Dübendorf, Switzerland 5Institute of Atmospheric and Climate Sciences, ETH Zurich, Zurich, Switzerland
6PMOD/WRC Davos, Davos, Switzerland
Correspondence to:Stefan Brönnimann ([email protected]) Received: 13 June 2016 – Published in Atmos. Chem. Phys. Discuss.: 27 June 2016 Revised: 14 October 2016 – Accepted: 20 November 2016 – Published: 15 December 2016
Abstract. Effects of the Quasi-Biennial Oscillation (QBO) on tropospheric climate are not always strong or they ap-pear only intermittently. Studying them requires long time series of both the QBO and climate variables, which has re-stricted previous studies to the past 30–50 years. Here we use the benefits of an existing QBO reconstruction back to 1908. We first investigate additional, newly digitized historical ob-servations of stratospheric winds to test the reconstruction. Then we use the QBO time series to analyse atmospheric data sets (reconstructions and reanalyses) as well as the re-sults of coupled ocean–atmosphere–chemistry climate model simulations that were forced with the reconstructed QBO. We investigate effects related to (1) tropical–extratropical inter-action in the stratosphere, wave–mean flow interinter-action and subsequent downward propagation, and (2) interaction be-tween deep tropical convection and stratospheric flow. We generally find weak connections, though some are statisti-cally significant over the 100-year period and consistent with model results. Apparent multidecadal variations in the con-nection between the QBO and the investigated climate re-sponses are consistent with a small effect in the presence of large variability, with one exception: the imprint on the north-ern polar vortex, which is seen in recent reanalysis data, is not found in the period 1908–1957. Conversely, an imprint in Berlin surface air temperature is only found in 1908–1957 but not in the recent period. Likewise, in the model simu-lations both links tend to appear alternatingly, suggesting a
more systematic modulation due to a shift in the circulation, for example. Over the Pacific warm pool, we find increased convection during easterly QBO, mainly in boreal winter in observation-based data as well as in the model simulations, with large variability. No QBO effects were found in the In-dian monsoon strength or Atlantic hurricane frequency.
1 Introduction
or El Niño–Southern Oscillation (ENSO; Gray et al., 1992a, b).
Given the QBO’s close-to-periodic variation (which im-plies predictability), any such mechanism raises hope of in-creasing the prediction skill beyond the classical weather forecast of a couple of days (see Tripathi et al., 2015). Fur-thermore, the QBO might modulate forcing-response rela-tionships. For instance, Labitzke et al. (2006) found that the QBO modulates the effect of solar activity on the polar vor-tex. Therefore, the QBO’s effect on tropospheric climate is of interest to different areas of climate research.
Previous research has shown that the effects of the QBO on the troposphere are not always strong but appear only in-termittently, e.g. between the 1950s and the 1980s (e.g. Ca-margo and Sobel, 2010). This calls for an analysis of long time series. The standard QBO time series – that of the Freie Universität Berlin (FUB) – reaches back to late 1953. Spec-tral analyses from earlier data confirm that the QBO existed before that time (Labitzke and van Loon, 1999). However, for the period prior to 1953, no direct comparison of strato-spheric wind data and independent tropostrato-spheric climate data could so far be done, which is the aim of our paper.
A starting point of our paper is historical papers pointing to a QBO imprint prior to 1953, which we want to test with long data series and model simulations. In fact, a clear 2.2-year cycle in Berlin surface air temperature (SAT) was already re-ported by Baur (1927). Landsberg (1962) and Landsberg et al. (1963) used spectral analysis of many more SAT series and found 2.2-year cycles. Spectral analyses of the North Atlantic Oscillation or the Northern Annular Mode indices also indicate significant peaks near 2.2 years (Hurrell and van Loon, 1997; Coughlin and Tung, 2001). More generally, speculations of a biennial oscillation in climate variables go back to the 19th century (see Clayton, 1884, 1885, for precip-itation and pressure in the United States and Woeikof, 1895, for Scandinavian snow cover).
We base our analysis on a previous paper (Brönnimann et al., 2007), where we have attempted to reconstruct the QBO back to 1908 by using the solar semidiurnal tide extracted from hourly sea-level pressure (SLP) data. The reconstruc-tion was augmented by incorporating historical stratospheric wind observations and was validated using the QBO sig-nature in historical total column ozone data. In the mean-time, we have digitized a large amount of additional histori-cal upper-air data (Stickler et al., 2014a), which partly cover the equatorial stratosphere. Among the new data are Berson’s 1908 observations in East Africa (Brönnimann and Stickler, 2013), 1910–1911 wind profiles from Batavia, 1925–1927 profiles from cruises of the research vesselMeteor(Stickler et al., 2015), as well as several other measurements.
We first present the new data sources and compare the re-sults to the previous reconstruction. After finding that the additional data do not contradict the previous reconstruc-tion, we use the reconstruction to analyse the imprint of the QBO in observation-based data sets (historical
reanaly-ses and reconstructions) of tropospheric circulation and cli-mate. We analyse SAT, precipitation, snow cover, tropo-spheric wind fields and hurricane tracks. The same analy-ses are performed in a set of four simulations with a cou-pled ocean–atmosphere–chemistry–climate model that was nudged to the same reconstructed QBO but backwards ex-tended to 1600, such that we have 4×405 years of model
data available (Muthers et al., 2014).
The paper is organized as follows. In Sect. 2, we describe the historical upper-air data and the quality check of the QBO reconstruction and describe the climate model simulations. Results are presented in Sect. 3 and discussed in Sect. 4. Con-clusions are drawn in Sect. 5.
2 Data and methods 2.1 QBO time series 2.1.1 Historical evidence
Only sporadic information is available on the QBO before 1953. The first indirect indications of stratospheric wind vari-ability relate to observations of volcanic plumes (Hamilton, 2012). The most famous example is the observation of the Krakatau volcanic plume in 1883, which circled the globe from east to west. The high-altitude winds (the stratosphere was not yet discovered) responsible for this transport became widely known as “Krakatau easterlies”.
Direct observations of equatorial stratospheric winds by means of balloons go back to 1908, when Berson, in an ex-pedition to East Africa, reported unexpected westerly winds in the lower stratosphere (Süring, 1910). These westerlies were confirmed by van Bemmelen and Braak (1910), who performed observations of upper-level winds in Batavia from 1909 to 1918. Lower stratospheric westerlies were also con-firmed by the observations of another volcanic eruption plume (Semeru, 15 November 1911), as reported by Hann and Süring (Hamilton, 2012). Reconciling Berson’s wester-lies with the expected easterly winds remained a challenge until the discovery of the QBO in the 1960s (Hastenrath, 2007).
zonally averaged zonal wind in the stratosphere at the equa-tor. We follow this definition.
2.1.2 Reconstruction of the QBO
In this paper we use the monthly reconstruction of the QBO (zonal mean zonal winds at the equator) from Brönnimann et al. (2007). This reconstruction is based on the surface signa-ture of the QBO-modulated solar semidiurnal tide in hourly surface pressure observations from Batavia prior to 1945 as well as on historical upper-air wind profiles. For the recon-struction we first defined a perpetually repeating “ideal QBO cycle” from deseasonalized reanalysis data. Then we used the observational evidence to determine a time axis (i.e. tim-ing of phases) and interpolated the ideal cycle onto this new time axis. Finally, we added back the annual cycle. We used historical total ozone data (which also show an imprint of the QBO) to assess the reconstruction and found generally good agreement, but the real QBO might be out of phase by up to 3 or 4 months.
The reconstruction is supported by historical upper-air observations mainly in the 1910s and in the 1940s, while the solar semidiurnal tide provides continuous information but stops in 1945; afterwards the reconstructions are en-tirely based on upper-air wind observations. The Freie Uni-versität Berlin QBO starts in 1953. From September 1957 on, the QBO is taken from ERA-40 and after 1979 from ERA-Interim (Dee et al., 2011). The resulting 108 year QBO record is given in Fig. 1. We are currently in the 48th cycle since Berson’s profile of 1908, which we take as a starting point of our work. The number of cycles thus allows robust statistics.
2.1.3 Additional historical upper-air data
The data presented here are part of a set of 1.25 million upper-air profiles that were digitized in the framework of the ERA-CLIM project (Stickler et al., 2014a, b), adding to the 12.75 million upper-air wind profiles that were already available from the comprehensive historical upper-air data set prior to 1957 (Stickler et al., 2010). A plot of most of the equatorial stratospheric data comprised in the latter data set was already given in Labitzke et al. (2006) and they en-tered the reconstruction described above. For this paper we collected all additional (ERA-CLIM) data prior to 1950 from stations within 20◦S to 20◦N. In the following we highlight three particular records.
Berson’s East Africa expedition
In 1908, the German meteorologist Arthur Berson organized an aerological expedition to East Africa with the aim of bet-ter understanding the monsoon system (Fig. S1 in the Sup-plement shows the launch of a registering balloon on Lake Victoria). Upper-level winds were observed with pilot bal-loons and registering balbal-loons (briefly described in
Brönni-mann and Stickler, 2013). Only a few profiles reached the stratosphere. Surprisingly, some of them indicated westerly winds in the stratosphere. Figure S1 (right) shows the wind profiles that reached the stratosphere. Although all profiles except for two were taken during a 15-day interval, there is considerable scatter. It is very difficult to identify wind regimes from the raw data, although there are westerly winds in the stratosphere in several profiles.
The corresponding profiles from the reconstructions are also indicated. While there is good agreement with some of the profiles (westerlies between 18 and 20 km and easterlies above), others show relatively strong easterlies between 16 and 18 km (or even higher), where the reconstructions sug-gest zero zonal wind. Note that the reconstructions assumed westerly winds at 19 km altitude throughout the year 1908 based on the notion of Berson westerlies.
The Batavia data
In 1909 the Dutch colonial secretary started aerological ob-servations in Batavia (van Bemmelen, 1911), supported by leading aerologists such as Richard Assmann and Hugo Hergesell. Kites, registering balloons and pilot balloons were used. Many of the balloons reached high altitudes, and soon westerly winds were observed (van Bemmelen and Braak, 1910), thus confirming Berson’s findings. Veryard and Ebdon (1961) and Ebdon (1963) analysed the Batavia winds from 1909 to 1918 (which they published in the form of monthly averaged wind directions for certain alti-tude bands) and found a clear QBO signature, including the downward phase propagation. Their published phases are in-terpretations, not raw data, and these phases were used to constrain our reconstructions. However, from the digitized data (Fig. S2 shows the earliest phase of measurements) it is difficult to discern clear wind regimes.
Research vesselMeteor
From 1925 to 1927, the German research vessel Meteor
cruised the Atlantic and took aerological observations in ad-dition to many oceanographical measurements. More than 1000 vertical profiles were retrieved on east–west transects across the tropical and South Atlantic (see Stickler et al., 2015, for details). Apart from kites and some registering balloon ascents (none of which reached the stratosphere), 801 pilot balloon ascents are available, of which the highest reached 20.5 km. In the tropical region (20◦N to 20◦S), how-ever, only a few measurements higher than 16 km are avail-able.
–1
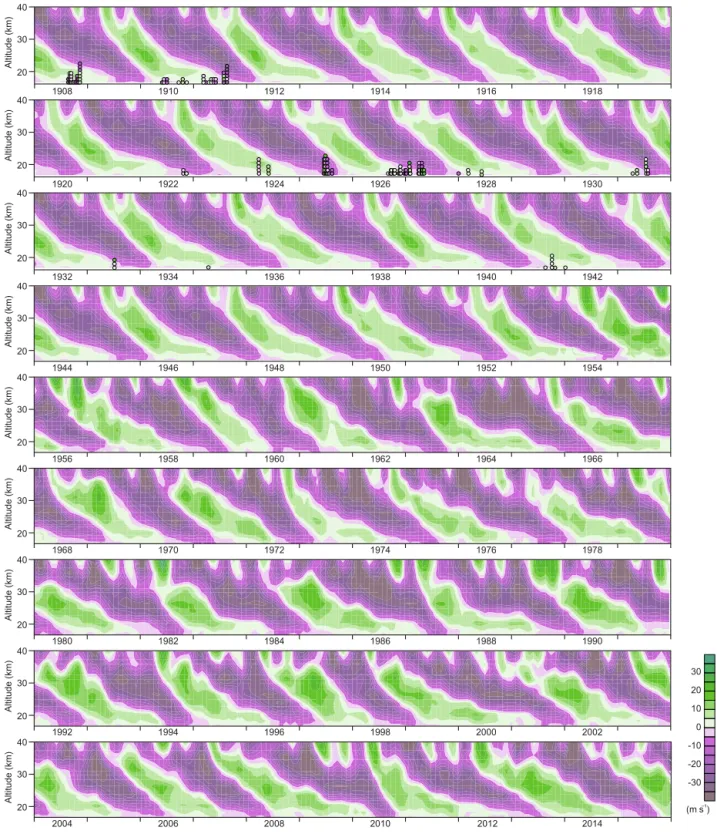
Figure 1.Hovmöller diagram (time–height cross section) of zonal-mean zonal wind at the equator from 1908 to 2015 (from Brönnimann et al., 2007). The dots in the first three rows indicate the additional wind data rescued within the ERA-CLIM project.
an evaluation, which is not even fully independent. The rate increases, though, if we only use observations above 19 or 20 km or exclude comparisons for which reconstructed winds are weak (i.e. close to phase change). Conversely, there is no systematic pattern of disagreement (no out-of-phase
2.2 Atmospheric circulation and climate data
In order to analyse the imprint of the QBO in historical times, we use several data sets of the tropospheric circulation that cover the pre-1957 period. These data sets include the Twen-tieth Century Reanalysis (20CR; Compo et al., 2011), ver-sions 2 and 2c, the reanalysis ERA-20C Deterministic (Poli et al., 2016) as well as several data sets based on reconstruc-tions. An overview of the analysis periods and data sets used is given in Fig. S3. As a reference in the recent period we use the ERA-Interim reanalysis.
The 20CR is based on the assimilation of surface or SLP from the International Surface Pressure Databank (ISPD) and the International Comprehensive Ocean–Atmosphere Data Set (ICOADS), with monthly sea-surface temperatures (SSTs) and sea ice used as a boundary condition. Versions 2 and 2c differ with respect to the ISPD versions used (v2 and v3.2.9, respectively), the starting year (1871 and 1851) and the SSTs used (HadISST1.1; Rayner et al., 2003, and SO-DAsi version 2; Giese et al., 2016, with the high latitudes (>60◦) corrected to COBE-SST2; Hirahara et al., 2014). Previous validation studies have shown that 20CR agrees well with independent observations in the midlatitudes, but less so in the tropics. In this study we use the ensemble mean monthly mean data and focus on version 2c (20CRv2c).
The ERA-20C reanalysis reaches back to 1900 and uses very similar pressure input to 20CRv2c (ISPD version 3.2.6 rather than version 3.2.9), but additionally also assimi-lates marine winds and uses a newer version of HadISST (HadISST2; see Poli et al., 2016). Results of ERA-20C and 20CRv2c are similar, and hence we show ERA-20C only where it deviates from 20CRv2c.
In addition to 20CRv2c we use monthly mean fields of wind and geopotential height (GPH) at different levels from a statistical reconstruction (Griesser et al., 2010), which reaches back to 1880. It is based on historical upper-air (after 1918) and surface data, which were calibrated against ERA-40 (Uppala et al., 2005) in a principal component regression approach. Here we use GPH at 100 hPa in the northern extra-tropics.
Furthermore, we also use monthly indices that were re-constructed based on surface and upper-level variables us-ing regression approaches (Brönnimann et al., 2009; Zhou et al., 2010) calibrated against (and extended by) NCEP/NCAR Reanalysis (Kistler et al., 2001). The same indices were also calculated from 20CRv2c. Specifically, we use the indices Z100, defined as GPH difference between 75 and 90 and 40– 55◦
N at 100 hPa (Brönnimann et al., 2009) as a measure for the weakness of the polar vortex, the Pacific Walker Circula-tion index PWC (the difference in vertical velocity at 500 hPa between the areas [10◦S–10◦N, 180–100◦W] and [10◦S– 10◦N, 100–150◦E] following Oort and Yienger, 1996) and the dynamic Indian monsoon index (DIMI) (the difference in 850 hPa zonal wind between the areas [5–15◦N, 40–80◦E] and [20–30◦N, 70–90◦E] following Wang et al., 2001).
We further used GHCNv3 SAT from Berlin, a time series of Atlantic hurricane activity (Vecchi and Knutson, 2011), as well as the HadCRUT4v global SAT data set (Morice et al., 2012).
2.3 Climate model simulations
The reconstructed QBO, backward extended to 1600 by re-peating the ideal QBO cycle plus seasonal cycle, was used to nudge the coupled chemistry–climate–ocean–atmosphere model SOCOL-MPIOM. The simulations are described in Muthers et al. (2014). In brief, SOCOL-MPIOM is a com-bination of the chemistry–climate model SOCOL version 3 (Stenke et al., 2013), which is based on the middle atmo-sphere version of ECHAM5 (Roeckner et al., 2006; Manzini et al., 2006), coupled to the chemical module MEZON (Model for Evaluation of oZONe trends (Rozanov et al., 1999; Egorova et al., 2003)) and the ocean model MPIOM (Marsland, 2003; Jungclaus et al., 2006). The atmospheric model was run at a resolution of T31 (approx. 3.75◦
×3.75◦),
with 39 levels (model top at 0.01 hPa/80 km). The vertical resolution around the tropopause is 20–30 hPa (levels are at 69.6, 89.1, 113.3, 143.1, 179.6 and 224.2 hPa). The ocean state in 1600 was branched off another simulation (Jungclaus et al., 2010; see Muthers et al., 2014; Anet et al., 2014; for more details).
Four simulations were performed for the period 1600 to 2000. Two simulations, termed F13 and F14 (differing only in their initial state) use a relatively strong solar forcing, while the two simulations F23 and F24 (again differing only in their initial state), use a weaker solar forcing. As will be shown later, no differences between the ensemble members are found with respect to their QBO effects. We thus also analysed a sample in which the four simulations were pooled. Atmospheric circulation and climate indices are nearly uncorrelated between the model simulations (strongest for DIMI, where one correlation between two simulations reached 0.14), while there is some correlation for Berlin tem-perature due to the common forced trend.
2.4 Methods
it enters through exclusion of weak winds). We chose these months because interaction between the QBO and the polar vortex may occur in early winter. The downward propagation from the polar stratosphere to the surface than takes several weeks and the signal may persist in the troposphere.
For those hypotheses that involve direct interaction be-tween the QBO and high-reaching convection, we used the 70 hPa QBO in June–July (JJ) and November–December (ND) and analysed the climate fields over a 3-month period starting with one month offset (JAS, DJF). The JAS defini-tion was preferred over the more classical JJA period follow-ing Chattopadhyay and Bhatla (2002), who found a stronger QBO signature in the Indian monsoon in these months. The shorter lag (as compared to the polar-vortex-based analyses described above) allows a more direct adjustment of the tro-pospheric circulation to stratospheric forcing. Periods when tropical zonal mean wind was weaker than 3 m s−1were not considered. Furthermore, for all analyses we excluded years following major tropical volcanic eruptions (i.e. 1601, 1642, 1675, 1720, 1730, 1810, 1816, 1832, 1836, 1884, 1912, 1926, 1964, 1983 and 1992).
Note that for specific problems, more accurate definitions of seasons could be found (see Gray et al., 1992a, b; Huang et al., 2012) at the price of simplicity or (possibly) indepen-dence. When defined in the way above, we find 39 easterly and 43 westerly phases for the boreal winter 50 hPa QBO since 1908. The corresponding numbers for the 70 hPa QBO for summer (winter) are 26 (31) easterly and 36 (30) west-erly phases. In FUPSOL at 50 hPa in winter there are 162 westerly (118 easterly) phases; the corresponding numbers for 70 hPa phases in summer (winter) are 165 (113) westerly and 108 (159) easterly phases.
Our main method is a composite analysis of the two phases (easterly minus westerly). The difference of the mean val-ues is tested using a heteroscedastic (unequal variance)ttest (Wilks, 2006). In the observation-based data we do this for the entire time period as well as for the subperiods 1908– 1957 and 1958–2012 (see also Roy, 2014, for changes in tro-pospheric signatures between the two periods). As a refer-ence we also apply the composite analysis to 1979–2015 in ERA-Interim data. In the model we apply the method to the entire time period for all simulations separately as well as for the pooled simulations. In the paper we show compos-ite fields only for the latter; corresponding composcompos-ites for all ensemble members and variables, including statistical signif-icance, are shown in the Supplement. Finally, we also per-formed 30-year moving composites, both in the observation-based data and in the model (only in the individual members). We then calculated standardized differences by dividing the difference in the 30-year window by the standard deviation of the corresponding variablex,sxover the entire period:
1xt=
t+Pl/2
t−l/2 xtet
t+Pl/2
t−l/2 et
−
t+Pl/2
t−l/2 xtwt
t+Pl/2
t−l/2 wt
sx
, (1)
wherelis window length,t is time (years) andeandware binary indicators of easterly and westerly QBO phases. A window length of 30 years was chosen since this represents the typical time period of data availability in many studies. However, as the effects could be aliased by variability modes of a similar periodicity, we also tested other window lengths (20 to 60 years) and found very similar results (not shown).
3 Results
3.1 QBO–polar vortex interaction and downward propagation
3.1.1 The QBO effect on the polar vortex and the NAO Several mechanisms responsible for QBO influence on tro-pospheric climate have been proposed. One pathway, known as the Holton–Tan effect (Holton and Tan, 1980; Baldwin et al., 2001), is through the extratropical stratosphere in boreal winter. This mechanism is understood to operate via changes in the extratropical planetary wave activity flux. An easterly QBO at 50 hPa leads to convergence of wave activity in the subtropical lower stratosphere and in the subpolar middle and upper stratosphere (e.g. Garfinkel et al., 2012). The waves deposit easterly momentum and decelerate the mean flow. The signal can propagate downward and eventually reach the Earth’s surface, although the mechanism is still not fully understood (see Anstey and Shepherd, 2014; Kidston et al., 2015; a review of the proposed mechanisms is beyond the scope of this paper).
Compositing easterly minus westerly QBO in boreal win-ter in ERA-Inwin-terim since 1979 (Fig. 2) shows this classi-cal response. The zonal mean zonal wind weakens, most strongly at around 30 km, 70◦N. Cooling is found above and warming is found below. GPH exhibits positive anoma-lies poleward of 60◦N in the lower stratosphere, indica-tive of a weak polar vortex. A corresponding cross sec-tion for 20CRv2c and ERA-20C (Fig. S4) shows that, while 20C qualitatively reproduces the pattern found in ERA-Interim, 20CRv2c does not reproduce the pattern in the stratosphere, but all data sets agree in the troposphere.
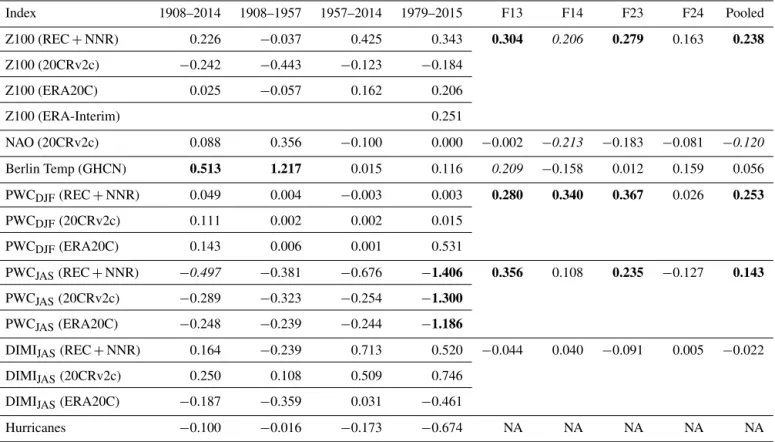
Table 1.Standardized difference in indices between easterly and westerly QBO phases in different observation-based data sets as well as in the climate model simulations (F13, F14, F23 and F24 denote the simulation numbers; also shown is the result for the pooled simulations). Bold and italics denote significance at the 95 and 90 % levels, respectively. REC+NNR is the combination of reconstructed indices up to 1947 and NCEP/NCAR Reanalysis thereafter.
Index 1908–2014 1908–1957 1957–2014 1979–2015 F13 F14 F23 F24 Pooled
Z100 (REC+NNR) 0.226 −0.037 0.425 0.343 0.304 0.206 0.279 0.163 0.238
Z100 (20CRv2c) −0.242 −0.443 −0.123 −0.184
Z100 (ERA20C) 0.025 −0.057 0.162 0.206
Z100 (ERA-Interim) 0.251
NAO (20CRv2c) 0.088 0.356 −0.100 0.000 −0.002 −0.213 −0.183 −0.081 −0.120
Berlin Temp (GHCN) 0.513 1.217 0.015 0.116 0.209 −0.158 0.012 0.159 0.056
PWCDJF(REC+NNR) 0.049 0.004 −0.003 0.003 0.280 0.340 0.367 0.026 0.253
PWCDJF(20CRv2c) 0.111 0.002 0.002 0.015
PWCDJF(ERA20C) 0.143 0.006 0.001 0.531
PWCJAS(REC+NNR) −0.497 −0.381 −0.676 −1.406 0.356 0.108 0.235 −0.127 0.143
PWCJAS(20CRv2c) −0.289 −0.323 −0.254 −1.300
PWCJAS(ERA20C) −0.248 −0.239 −0.244 −1.186
DIMIJAS(REC+NNR) 0.164 −0.239 0.713 0.520 −0.044 0.040 −0.091 0.005 −0.022
DIMIJAS(20CRv2c) 0.250 0.108 0.509 0.746
DIMIJAS(ERA20C) −0.187 −0.359 0.031 −0.461
Hurricanes −0.100 −0.016 −0.173 −0.674 NA NA NA NA NA
(a) –1 (b) (c)
° ° ° ° ° ° ° ° ° ° ° °
wind
Figure 2.Composite fields (shading) and climatologies (contours) since 1979 in ERA-Interim, January–March for easterly minus westerly QBO phases (50 hPa, November–December) for zonal av-erages of (a) zonal wind (contours: 20 to 60 m s−1 in steps of 10 m s−1),(b)temperature (contours: 200 to 300 K in steps of 10 K) and (c) GPH. Yellow dashed lines indicate significant difference (p=0.05). The corresponding figure for 20CRv2c and ERA-20C is given in Fig. S4.
Fig. 2). A more consistent relation is found within the model simulations, which is highly significant for the pooled sam-ple and is significant at the 95 % (90 %) level for two (three) out of the four simulations (not shown).
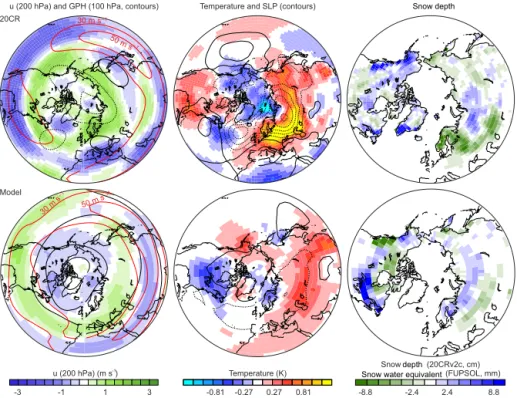
Compositing 100 hPa GPH and 200 hPa zonal wind for January to March gives similar results (Fig. 3). The analysis of 20CRv2c (1908–2012) and of the simulations (ensemble mean) show almost opposite patterns, but it should be noted that there is hardly any significance in the 20CRv2c com-posites (Fig. S5; no significance at all is found in 100 hPa GPH). In order to test whether uncertainties in 20CRv2c in the early times could be the cause of that, we compared the composite for 100 hPa GPH for the 1908–1957 period between 20CRv2c, ERA-20C and statistical reconstructions (Fig. S6). In fact, there are again some differences between the products. 20CRv2c exhibits a stronger negative signal over the polar region than the other data sets, but none shows the weakening of the vortex expected from the Holton–Tan effect.
depth Snow water equivalent
Snow depth
–1 –1
–1
–1
Figure 3.Composite fields for easterly minus westerly QBO phases for (left) 200 hPa zonal wind (shading, red contours indicate climatology) and 100 hPa GPH (black contours, spacing 24 gpm, symmetric around zero, dashed are negative), (middle) surface air temperature (shading) and SLP (contours, spacing 0.6 hPa, symmetric around zero, dashed are negative), all January–March and (right) March snow cover. See Fig. S5 for significance.
ERA-Interim in the recent period is reproduced qualitatively in the model simulations but not in 20CRv2c.
The lack of a consistent signal in two subperiods could point to the lack of a signal in general or to an intermittent behaviour of the QBO signature. For instance, the base state of atmospheric circulation might have changed (e.g. Vecchi and Soden, 2007), which would then modulate the QBO re-sponse through changing either the amount of upward prop-agating wave activity or its refraction. However, historical reanalyses are unsuitable for analysing changes in wave ac-tivity diagnostics.
The model results suggest that the QBO signal might be small (though significant), such that short periods may by chance show an opposite relation. To test this, east–west dif-ferences in 30-year moving windows are analysed (Fig. 4). In fact, the standardized differences for such periods vary con-siderably in the model. In the observation-based data, the dif-ference was largest for the interval 1960 to 1989, i.e. close to the time window in which the Holton–Tan effect was origi-nally discovered (although the behaviour changed during the 1977–1997 period; see Lu et al., 2008). Note, however, that 20CRv2c shows a weaker signal than the other data sets also in the last period.
In all, the reconstructed QBO and polar vortex strength at 100 hPa from reconstructions and reanalysis prior to 1957 do not show a relation. This could be due to inferior data
quality of either or a too-low analysis level (note that ERA-Interim also does not show a significant response at that level (Table 1) but only at higher levels, Fig. 2). The model does show a significant relation as expected from the Holton–Tan effect, but the signal is rather small or transient. Results are consistent with ERA-Interim, considering decadal variability as found in the model.
To assess whether the QBO affects the surface the ERA-Interim analysis (Fig. 2) is again consulted. Zonal averages indeed show small surface effects (weaker zonal wind, higher SAT and pressure for easterly phases) but only poleward of 80◦N. Very often, the NAO index is analysed as an indication for surface imprints of stratospheric perturbations. This index is well constrained in 20CR (Compo et al., 2011), and hence the NAO index is treated similarly as Z100. As expected, differences in the NAO have the opposite sign to those for Z100. However, none of the differences in 20CRv2c are sig-nificant. In the model simulations, differences are significant at the 90 % level in one out of four simulations (thepvalue for the pooled sample is exactly 0.05). The 30-year moving window composite of the NAO index shows that the decadal variability of the difference is large (both in observations and model simulations), but it is anti-correlated with that of Z100 (which is expected).
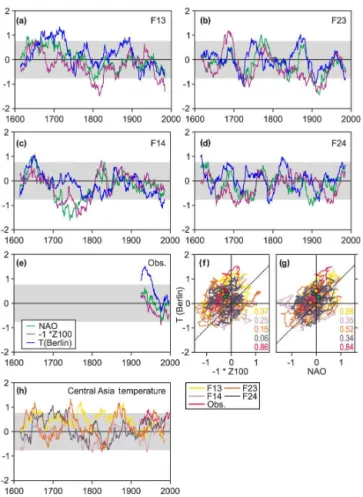
compos-Figure 4.Standardized differences between easterly minus westerly QBO phases in 30-year moving windows for NAO, Z100 and Berlin SAT in the four model simulations (a)F13,(b)F14,(c)F23 and
(d)F24 and in(e)observation-based data (Z100 from reconstruc-tions, NAO from 20CRv2c). Panels(f)and(g)show the same time series but plotting Berlin SAT as a function of−1·Z100 or NAO (filled circles indicate the standardized difference over the entire period and numbers give the correlations; the green circles indicate the standardized differences from ERA-Interim, 1979–2015; one-to-one lines are dashed). Panel(h)shows standardized differences between easterly minus westerly QBO phases in 30-year moving windows for the Central Asia SAT index in HadCRUT4v and in the model simulations. Grey shading denotes an approximate 95 % confidence interval for 30-year averages.
ites of SLP fields. We find negative anomalies at midlatitudes stretching from the eastern North Atlantic to central Eurasia in both 20CRv2c and model simulations. Indeed, the pattern is shifted southward as compared to a classical NAO pattern. In the North Atlantic–European region, the agreement be-tween model and observation-based data is stronger at the surface than in the stratosphere (note that the pattern over North America, in contrast, is almost opposite in 20CRv2c and model simulations). In the model, the signature is con-sistent in all four simulations (Fig. S8). Thus, both the signa-tures in the stratosphere and in SLP are consistent with the Holton–Tan effect, but the variability is so large that even
with very long records results remain near the limit of signif-icance.
3.1.2 The QBO effect on surface air temperature in Eurasia
Baur (1927) analysed the 100-year record of Berlin SAT and found a very clear quasi-biennial cycle. Within our QBO re-constructions, we also find highly significant differences for Berlin SAT (we used observations rather than reanalyses) in winter (January–March) between eastern and western phases of the QBO (50 hPa, November–December). SAT is higher during easterly phases of the QBO. This is unexpected since Berlin SAT is positively correlated with the NAO and neg-atively with Z100. The effect might be real since the model simulations (grid point 15◦E, 50.1◦N) also show higher SAT during the easterly phase of the QBO as compared to the westerly phase, albeit not significantly.
Interestingly, the difference is significant only in the first period (which is when Baur, 1927, discovered 2.2-year cyclicities in Berlin SAT) and over the entire period, but not in the post-1957 period. In other words, the difference was significant in the period when no effect in Z100 and NAO was found. The 30-year moving window difference in the model simulations shows a similar behaviour. There are mul-tidecadal periods when the QBO signature in Berlin SAT is positive while the NAO (Z100) signature is around zero, and there are periods when the NAO signature is negative and the QBO signature in Berlin SAT is around zero. As for the raw series, the 30-year moving window difference se-ries of Berlin SAT,−1×Z100 and NAO are positively cor-related (numbers in Fig. 4). However, the curves do not scat-ter around the one-to-one line, as could be expected, but are slightly displaced towards the upper left quadrant (illustrated by their long-term average as dots). A possible explanation for this behaviour is a dipole-like variation that is induced by the QBO, but the dipole structure itself shifts with changes in the background climate. The locations or indices consid-ered then do not capture the dipole structure well anymore and do not show a strong signature. Part of the decadal vari-ability in the QBO–surface climate relation might thus arise from decadal climatic variability such as latitudinal shifts of circulation features.
We analysed the effect of a possible change in the base state using standard circulation indices (such as the NAO itself, the Atlantic Multidecadal Oscillation or the Pacific Decadal Oscillation, all filtered with the same moving win-dow), but we did not find consistent results between model-and observation-based analyses. In the 1940s, the subtropical jet was in a relatively poleward position and then retracted equatorward (Brönnimann et al., 2015). This might be a pos-sible explanation, but further evidence for this is required.
(a) –1 (b) (c) –1
° ° ° ° ° °
wind velocity
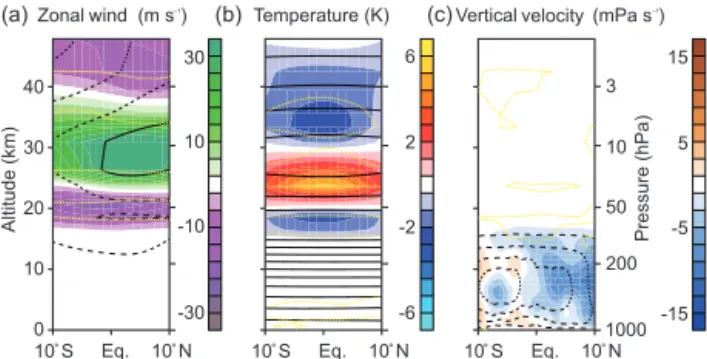
Figure 5.Composite fields (shading) and climatologies (contours) of ERA-Interim for boreal winter for easterly minus westerly QBO phases for zonal averages within 120–160◦E for(a)zonal wind (contours:−50 to 50 m s−1in steps of 20 m s−1),(b)temperature (contours: 200 to 300 K in steps of 10 K) and(c)omega (−70 to 70 Pa s−1in steps of 20 Pa s−1) in December–February using the 70 hPa QBO definition. Yellow dashed lines indicate significant dif-ference (p=0.05).
well reproduced in the model simulations, where it maxi-mizes between the Caspian and Aral seas. However, there is quite a large discrepancy between individual simulations despite the fact that they are 405 years long (Fig. S9). For in-stance, the SAT signal over North America is totally different and results there are not robust.
Based on these results, we defined a new SAT index for the Caspian–Aral Sea region, which is the region with the strongest imprint in the model composites. Even in this op-timized case, there are some (albeit few) 30-year periods in the 4×405-year model simulations that would exhibit a sig-nificantly negative relation when analysed in isolation. Inter-estingly, correlations between the 30-year moving window difference series of the new SAT index and those of NAO and−1×Z100 are now predominantly negative.
3.1.3 The QBO effect on snow cover
Woeikof (1895) speculated that snow cover follows a bien-nial cycle. To test this, snow depth in March is analysed. The corresponding composites (see Fig. 3) were highly con-sistent with the results for SAT, but again they do not show a systematic effect. The high-resolution snow cover product from ERA-20C shows very similar results to 20CRv2c (see Fig. S7), i.e. the QBO east minus west differences for the two subperiods differ, and they both differ from the model simulations.
From these analyses there is no indication that snow cover in March is affected by the QBO in a significant way. Con-versely, we can also not exclude intermittent effects. Pe-ings et al. (2013) found an effect of the QBO on Siberian snow cover, but only after 1976 and not before. Hence, Woeikof (1895) might still have captured a QBO signal when finding differences in snow cover in Scandinavia between
even and odd years, or (what is more likely) he was picking up random variability.
3.2 QBO interaction with deep tropical convection 3.2.1 The QBO effect on the ENSO system and the
Pacific Walker Circulation
In 1992, Gray et al. (1992a, b) suggested an effect of the QBO on the ENSO system. Later publications addressed the effect of the QBO on tropical convection in observations (e.g. Collimore et al., 2003; Huang et al., 2012; Liess and Geller, 2012) or models (e.g. Giorgetta et al., 1999; Garfinkel and Hartmann, 2011; Nie and Sobel, 2015). Several mechanisms have been suggested as to how a link might proceed. Gray et al. (1992b) found that wind shear near the tropopause as-sociated with the QBO phase in the lowermost stratosphere affects deep convection in the warm pool area. Giorgetta et al. (1999) and Huang et al. (2012) argued that the change in static stability due to the temperature QBO might play a more important role. However, the role of clouds and other feed-backs is not well understood (e.g. Garfinkel and Hartmann, 2011).
According to the wind shear mechanism, lower shear would favour deeper convection. Climatologically, easterlies dominate over the warm pool in the uppermost troposphere; hence, an easterly QBO phase at 70 hPa reduces the wind shear and enhances convection. With respect to the temper-ature, a westerly QBO phase at 70 hPa is associated with a warm layer below, leading to increased stability in the tropopause region and thus less convection. From both mech-anisms we expect more convection during easterly phases of the QBO in the lower stratosphere. Therefore, stability and wind shear influences cannot easily be separated with-out more detailed diagnostics that are not available for our study.
The analysis in ERA-Interim (Fig. 5) for zonal averages over Indonesia and the Pacific warm pool (120 to 160◦E) in boreal winter is consistent with the suggested mechanisms. While SAT and zonal wind do not show a tropospheric im-print, an increase in tropical convection is found for easterly phases. This increase is shifted towards the Northern Hemi-sphere relative to the climatological maximum in convection. It is statistically significant in the tropopause region.
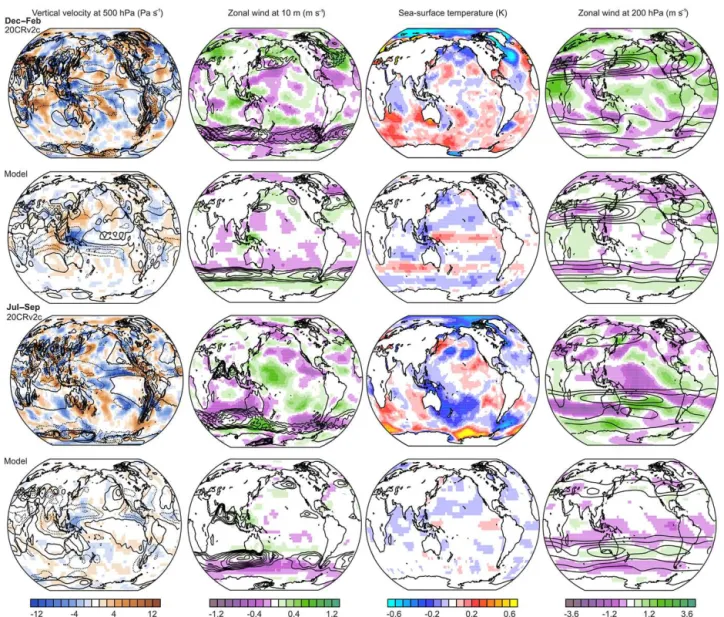
Figure 6.Composite fields for easterly minus westerly QBO phases at 70 hPa for (left) 500 hPa vertical velocity (shading, contours indicate climatology, spacing is 40 Pa s−1symmetric around zero, dashed lines are negative), 10 m zonal wind (shading, contours indicate climatology from 4 m s−1in steps of 1 m s−1), SST and 200 hPa zonal wind (shading, contours indicate climatology from 20 m s−1in steps of 10 m s−1) for boreal summer and winter in 20CRv2c and in the model simulations. See Fig. S12 for significance.
highly significant. The former is consistent with increased convection over the Pacific warm pool area and is consistent with observations (Fig. 5), whereas the latter is not consistent with increased convection and the sign is different from that found in the observations.
This imprint can be better understood when analysing fields rather than an index (although fields are less reliable). Composites of SST, vertical velocity and zonal winds at 10 m and at 200 hPa are shown in Fig. 6 (see Fig. S12 for signifi-cance). The most obvious signature is a slight eastward shift of the centre of convection over Indonesia during easterly QBO phases, resulting in the pattern seen in ERA-Interim. This is seen in both seasons (though stronger in boreal win-ter) and it is also seen in observations, making it robust. The response thus does not project well onto the Pacific Walker
Circulation, and surface winds over the central Pacific re-main unaffected. Note, however, that almost no areas show a significant response in 20CRv2c. Signatures in SST show a slight equatorial Pacific warming but a cooling in Indonesia. However, for these findings significance is also limited (see Figs. S10 and S11). The winter hemisphere subtropical jet moves poleward in 20CRv2c and to some extent also in the model simulations.
3.2.2 QBO effect on Atlantic hurricanes and on the Indian summer monsoon
dif-ferences with the simple indices used. Note, however, that for the Indian summer monsoon the relation might be more complex (e.g. Claud and Terray, 2007). The existence of a tropospheric biennial oscillation in the summer monsoon has been claimed (Meehl et al., 2003), but this might arise from white noise and not from deterministic processes (Stuecker et al., 2015).
4 Discussion and conclusions
Our analysis reveals relatively small influence of the QBO on the tropospheric climate, which is however consistent with historical literature (which is not too surprising since the un-derlying observation-based data are partly the same) and in some cases with climate model simulations. Although issues of data quality also contribute in the case of observation-based data, it is interesting that even with very long time series and very long model simulations, only a few statis-tically significant results are found. Multidecadal variations of QBO–climate links are mostly consistent with a small sig-nal in the presence of intersig-nal decadal climate variability, al-though one of the results (the fact that periods with QBO signatures in Berlin surface temperature and in the NAO al-ternate) also points to possible climatic modulations.
Based on the analysis of 108 years of QBO and climate variables from reconstructions as well as 4×405 years of data from climate model simulations, we came to the following conclusions:
1. There is no evidence that the extended QBO reconstruc-tion is out of phase with the true QBO, but further sup-port for the reconstructions is clearly required.
2. The relation between the QBO and climate variables is rather weak on average, but it is characterized by large multidecadal fluctuations.
3. In boreal winter, there are links between the QBO and the stratospheric polar vortex or between the QBO and Berlin SAT, but the former relation is typically strong when the latter is weak and vice versa (both in model and observations). This suggests a climatic origin of the decadal modulation (such as decadal latitudinal shifts of circulation). The relation to a more broadly defined Eurasian SAT index is more stable.
4. There is a weak but significant effect of the QBO on deep convection over the Pacific warm pool, mainly in boreal winter (an eastward shift of convection during easterly QBO in the lowermost stratosphere). Though significant, this change does not project strongly onto the Pacific Walker Circulation or ENSO.
5. Our results are consistent with historical literature and also with the sequence of discoveries of (quasi-)biennial imprints in weather and climate, as expected for analy-ses of small effects embedded within strong variability.
5 Data availability
The reanalysis data can be downloaded from the corre-sponding websites at NOAA and ECMWF. The QBO reconstruction can be downloaded from the Climate Ex-plorer. The upper-level reconstructions can be downloaded from http://www.oeschger.unibe.ch/research/projects_and_ databases/comprehensive_historical_upper_air_network_ chuan/index_eng.html.
The Supplement related to this article is available online at doi:10.5194/acp-16-15529-2016-supplement.
Acknowledgements. This paper is dedicated to Karin Labitzke, who made major contributions to the understanding of QBO effects on climate. The work was supported by the Swiss National Science Foundation under grant CRSII2-147659 (FUPSOL II) and the EC FP7 project ERA-CLIM2.
Edited by: P. Haynes
Reviewed by: I. Roy and one anonymous referee
References
Anet, J. G., Muthers, S., Rozanov, E. V., Raible, C. C., Stenke, A., Shapiro, A. I., Brönnimann, S., Arfeuille, F., Brugnara, Y., Beer, J., Steinhilber, F., Schmutz, W., and Peter, T.: Impact of solar versus volcanic activity variations on tropospheric temperatures and precipitation during the Dalton Minimum, Clim. Past, 10, 921–938, doi:10.5194/cp-10-921-2014, 2014.
Anstey, J. A. and Shepherd, T. G.: High-latitude influence of the quasi-biennial oscillation, Q. J. Roy. Meteor. Soc. 140, 1–21, 2014.
Baldwin, M. P., Gray, L. J. Dunkerton, T. J. Hamilton, K. Haynes, P. H. Randel, W. J. Holton, J. R. Alexander, M. J. Hirota, I. Horinouchi, T. Jones, D. B. A. Kinnersley, J. S. Marquardt, C. Sato, K., and Takahashi, M.: The Quasi-Biennial Oscillation, Rev. Geophys., 39, 179–229, 2001.
Baur, F.: Das Periodiogramm hundertjähriger Temperaturbeobach-tungen in Berlin (Innenstadt), Meteorol. Z., 44, 414–418, 1927. Brönnimann, S. and Stickler, A.: Aerological observations in the
Tropics in the Early Twentieth Century, Meteorol. Z., 22, 349– 358, 2013.
Brönnimann S., Annis, J. L., Vogler, C., and Jones, P. D.: Recon-structing the quasi-biennial oscillation back to the early 1900s, Geophys. Res. Lett., 34, L22805, doi:10.1029/2007GL031354, 2007.
Brönnimann, S., Stickler, A., Griesser, T., Fischer, A. M., Grant, A., Ewen, T., Zhou, T., Schraner, M., Rozanov, E., and Peter T.: Variability of large-scale atmospheric circulation indices for the Northern Hemisphere during the past 100 years, Meteorol. Z., 18, 379–396, 2009.
Camargo, S. J. and Sobel, A. H.: Revisiting the influence of the quasi-biennial oscillation on tropical cyclone activity, J. Climate, 23, 5810–5825, doi:10.1175/2010JCLI3575.1, 2010.
Chattopadhyay, J. and Bhatla, R.: Possible influence of QBO on teleconnections relating Indian summer monsoon rainfall and sea-surface temperature anomalies across the equatorial pacific, Int. J. Climatol., 22, 121–127, 2002.
Claud, C. and Terray, P.: Revisiting the possible links between the quasi-biennial oscillation and the Indian summer monsoon using NCEP R-2 and CMAP fields, J. Climate, 20, 773–787, 2007. Clayton, H. H.: A lately discovered meteorological cycle, Am.
Me-teorol. J., 1, 130–144, 1884.
Clayton, H. H.: A lately discovered meteorological cycle, II, Am. Meteorol. J., 1, 528–534, 1885.
Collimore, C. C., Martin, D. W., Hitchman, M. H., Huesmann, A., and Waliser, D. E.: On The Relationship between the QBO and Tropical Deep Convection, J. Climate, 16, 2552–2568, 2003. Compo, G. P., Whitaker, J. S., Sardeshmukh, P. D., Matsui, N.,
Al-lan, R. J., Yin, X., Gleason, B. E., Vose, R. S., Rutledge, G., Bessemoulin, P., Brönnimann, S., Brunet, M., Crouthamel, R. I., Grant, A. N., Groisman, P. Y., Jones, P. D., Kruk, M. C., Kruger, A. C., Marshall, G. J., Maugeri, M., Mok, H. Y., Nordli, Ø., Ross, T. F., Trigo, R. M., Wang, X. L., Woodruff, S. D., and Worley, S. J.: The Twentieth Century Reanalysis Project, Q. J. Roy. Meteor. Soc., 137, 1–28, 2011.
Coughlin, K. and Tung, K.-K.: QBO Signal found at the Extratrop-ical Surface through Northern Annular Modes, Geophys. Res. Lett., 28, 4563–4566, doi:10.1029/2001GL013565, 2001. Dee, D. P., Uppala, S. M., Simmons, A. J., Berrisford, P., Poli,
P., Kobayashi, S., Andrae, U., Balmaseda, M. A., Balsamo, G., Bauer, P., Bechtold, P., Beljaars, A. C. M., van de Berg, L., Bid-lot, J., Bormann, N., Delsol, C., Dragani, R., Fuentes, M., Geer, A. J., Haimberger, L., Healy, S. B., Hersbach, H., Hólm, E. V., Isaksen, L., Kållberg, P., Köhler, M., Matricardi, M., McNally, A. P., Monge-Sanz, B. M., Morcrette, J.-J., Park, B.-K., Peubey, C., de Rosnay, P., Tavolato, C., Thépaut, J.-N., and Vitart, F.: The ERA-Interim reanalysis: configuration and performance of the data assimilation system, Q. J. Roy. Meteor. Soc., 137, 553–597, doi:10.1002/qj.828, 2011.
Ebdon, R. A.: The tropical stratospheric wind fluctuation: Evidence of its permanency from earlier data, Weather, 18, 2–7, 1963. Egorova, T., Rozanov, E., Zubov, V., and Karol, I. L.: Model for
investigating Ozone trends (MEZON), Izv. Atmos. Ocean. Phys., 39, 277–292, 2003.
Garfinkel, C. I. and Hartmann, D. L.: The Influence of the Quasi-Biennial Oscillation on the Troposphere in Winter in a Hierarchy of Models. Part II: Perpetual Winter WACCM Runs, J. Climate, 68, 2026–2041, 2011.
Garfinkel, C. I., Shaw, T. A., Hartmann, D. L., and Waugh, D. W.: Does the Holton–Tan Mechanism Explain How the Quasi-Biennial Oscillation Modulates the Arctic Polar Vortex?, J. At-mos. Sci., 69, 1713–1733, 2012.
Giese, B. S., Seidel, H. F., Compo, G. P., and Sardeshmukh, P. D.: An ensemble of ocean reanalyses for 1815–2013 with sparse observational input, J. Geophys. Res., 121, 6891–6910, doi:10.1002/2016JC012079, 2016.
Giorgetta, M. A., Bengtsson, L., and Arpe, K.: An investigation of QBO signals in the east Asian and Indian monsoon in GCM ex-periments, Clim. Dynam., 15, 435–450, 1999.
Gray, W. M., Sheaffer, J. D., and Knaff, J. A.: Hypothesized mech-anism for stratospheric QBO influence on ENSO variability, Go-phys. Res. Lett., 19, 107–110, 1992a.
Gray, W. M., Sheaffer, J. D., and Knaff, J. A.: Influence of the strato-spheric QBO on ENSO variability, J. Meteorol. Soc. Jpn., 70, 975–987, 1992b.
Griesser, T., Brönnimann, S., Grant, A., Ewen, T., Stickler, A., and Comeaux, J.: Reconstruction of Global Monthly Upper-Level Temperature and Geopotential Height Fields Back to 1880, J. Climate, 23, 5590–5609, 2010.
Hamilton, K.: Observations of tropical stratospheric winds before World War II, B. Am. Meteorol. Soc., 79, 1367–1371, 1998. Hamilton, K.: Sereno Bishop, Rollo Russell, Bishop’s Ring and the
discovery of the “Krakatoa Easterlies”, Atmos. Ocean, 50, 169– 175, 2012.
Hastenrath, S.: Equatorial zonal circulations: Historical perspec-tives, Dynam. Atmos. Oceans, 43, 16–24, 2007.
Hirahara, S., Ishii, M., and Fukuda, Y.: Centennial-Scale Sea Sur-face Temperature Analysis and Its Uncertainty, J. Climate, 27, 57–75, 2014.
Holton, J. R. and Tan, H. C.: The influence of the equatorial Quasi-Biennial Oscillation on the global circulation at 50 mb, J. Atmos. Sci., 37, 2200–2208, 1980.
Huang, B., Hu, Z.-Z., Kinter III, J. L., Wu, Z., and Kumar, A.: Con-nection of stratospheric QBO with global atmospheric general circulation and tropical SST. Part I: Methodology and compos-ite life cycle, Clim. Dynam., 38, 1–23, doi:10.1007/s00382-011-1250-7, 2012.
Hurrell, J. W. and van Loon, H.: Decadal variations in climate asso-ciated with the North Atlantic Oscillation, Climatic Change, 36, 301–326, 1997.
Jungclaus, J. H., Keenlyside, N., Botzet, M., Haak, H., Luo, J.-J., Latif, M., Marotzke, J., Mikolajewicz, U., and Roeck-ner, E.: Ocean circulation and tropical variability in the cou-pled model ECHAM5/MPI-OM, J. Climate, 19, 3952–3972, doi:10.1175/JCLI3827.1, 2006.
Jungclaus, J. H., Lorenz, S. J., Timmreck, C., Reick, C. H., Brovkin, V., Six, K., Segschneider, J., Giorgetta, M. A., Crowley, T. J., Pongratz, J., Krivova, N. A., Vieira, L. E., Solanki, S. K., Klocke, D., Botzet, M., Esch, M., Gayler, V., Haak, H., Raddatz, T. J., Roeckner, E., Schnur, R., Widmann, H., Claussen, M., Stevens, B., and Marotzke, J.: Climate and carbon-cycle variability over the last millennium, Clim. Past, 6, 723–737, doi:10.5194/cp-6-723-2010, 2010.
Kidston, J., Scaife, A. A., Hardiman, S. C., Mitchell, D. M., Butchart, N., Baldwin, M. P., and Gray, L. J.: Stratospheric in-fluence on tropospheric jet streams, storm tracks and surface weather, Nat. Geosci., 8, 433–440, 2015.
Kistler, R., Kalnay, E., Collins, W., Saha, S., White, G., Woollen, J., Chelliah, M., Ebisuzaki, W., Kanamitsu, M., Kousky, V., van den Dool, H., Jenne, R., and Fiorino, M.: The NCEP-NCAR 50-year reanalysis: Monthly means CD-ROM and documentation, B. Am. Meteorol. Soc., 82, 247–267, 2001.
Klotzbach, P. J.: Revised Prediction of Seasonal Atlantic Basin Tropical Cyclone Activity from 1 August, Weather Forecast., 22, 937–949, 2007.
Labitzke, K., Kunze, M., and Brönnimann, S.: Sunspots, the QBO and the stratosphere in the North Polar Region–20 years later, Meteorol. Z., 15, 355–363, 2006.
Landsberg, H. E.: Biennial Pulses in the Atmosphere, Beitr. Phys. Atmos., 35, 184–194, 1962.
Landsberg, H. E., Mitchell Jr., J. M., Cruther, H. L., and Quin-lan, F. T.: Surface signs of the biennial atmospheric pulse, Mon. Weather Rev., 91, 549–556, 1963.
Liess, S. and Geller, M. A.: On the relationship between QBO and distribution of tropical deep convection, J. Geophys. Res., 117, D03108, doi:10.1029/2011JD016317, 2012.
Lu, H., Baldwin, M. P., Gray, L. J., and Jarvis, M. J.: Decadal-scale changes in the effect of the QBO on the northern stratospheric polar vortex, J. Geophys. Res., 113, D10114, doi:10.1029/2007JD009647, 2008.
Manzini, E., Giorgetta, M. A., Esch, M., Kornblueh, L., and Roeckner, E.: The influence of sea surface temperatures on the northern winter stratosphere: Ensemble simulations with the MAECHAM5 Model, J. Climate, 19, 3863–3881, doi:10.1175/JCLI3826.1, 2006.
Marquardt, C. and Naujokat, B.: An update of the equatorial QBO and its variability, SPARC Melbourne, WMO/TD-NO. 814, 87– 90, 1997.
Marsland, S.: The Max-Planck-Institute global ocean/sea ice model with orthogonal curvilinear coordinates, Ocean. Model., 5, 91– 127, doi:10.1016/S1463-5003(02)00015-X, 2003.
Meehl, G. A., Arblaster, J., and Loschnigg, J.: Coupled ocean-atmosphere dynamical processes in the tropical Indian and Pacific oceans and the TBO, J. Climate, 16, 2138–2158, doi:10.1175/2767.1, 2003.
Morice, C. P., Kennedy, J. J., Rayner, N. A., and Jones, P. D.: Quantifying uncertainties in global and regional temper-ature change using an ensemble of observational estimates: The HadCRUT4 data set, J. Geophys. Res., 117, D08101, doi:10.1029/2011JD017187, 2012.
Mukherjee, B. K., Indira, K., Reddy, R. S., and Ramana Murty, B. V.: Quasi-Biennial Oscillation in stratospheric zonal wind and Indian Summer Monsoon, Mon. Weather Rev., 113, 1421–1424, 1985.
Muthers, S., Anet, J. G., Stenke, A., Raible, C. C., Rozanov, E., Brönnimann, S., Peter, T., Arfeuille, F. X., Shapiro, A. I., Beer, J., Steinhilber, F., Brugnara, Y., and Schmutz, W.: The coupled atmosphere-chemistry-ocean model SOCOL-MPIOM, Geosci. Model Dev., 7, 2157–2179, doi:10.5194/gmd-7-2157-2014, 2014.
Naujokat, B.: An update of the observed quasi-biennial oscillation of the stratospheric winds over the tropics, J. Atmos. Sci., 43, 1873–1877, 1986.
Nie, J. and Sobel, A. H.: Responses of Tropical Deep Convection to the QBO: Cloud-Resolving Simulations, J. Atmos. Sci., 72, 3625–3638, 2015.
Oort, A. H. and Yienger, J. J.: Observed interannual variability in the Hadley Circulation and its connection to ENSO, J. Climate, 9, 2751–2767, 1996.
Peings, Y., Brun, E., Mauvais, V., and Douville, H.: How station-ary is the relationship between Siberian snow and Arctic Oscil-lation over the 20th century?, Geophys. Res. Lett., 40, 183–188, doi:10.1029/2012GL054083, 2013.
Poli, P., Hersbach, H., Dee, D. P., Berrisford, P., Simmons, A. J., Vitart, F., Laloyaux, P., Tan, D. G. H., Peubey, C., Thépaut, J.-N., Trémolet, Y., Hólm, E. V., Bonavita, M., Isaksen, L., and Fisher, M.: ERA-20C: An atmospheric reanalysis of the 20th century, J. Climate, 29, 4083–4097, doi:10.1175/JCLI-D-15-0556.1, 2016. Rayner, N. A., Parker, D. E., Horton, E. B., Folland, C. K.,
Alexander, L. V., Rowell, D. P., Kent, E. C., and Kaplan, A.: Global analyses of SST, sea ice and night marine air temperature since the late nineteenth century, J. Geophys. Res., 108, 4407, doi:10.1029/2002JD002670, 2003.
Reed, R. G., Campbell, W. J., Rasmussen, L. A., and Rogers, D. G.: Evidence of downward-propagating annual wind reversal in the equatorial stratosphere, J. Geophys. Res., 66, 813–818, 1961. Roeckner, E., Brokopf, R., Esch, M., Giorgetta, M., Hagemann, S.,
Kornblueh, L., Manzini, E., Schlese, U., and Schulzweida, U.: Sensitivity of simulated climate to horizontal and vertical reso-lution in the ECHAM5 atmosphere model, J. Climate, 19, 3771– 3791, 2006.
Roy, I.: The role of the sun in atmosphere-ocean coupling, Int. J. Climatol., 34, 655–677, 2014.
Rozanov, E., Schlesinger, M. E., Zubov, V., Yang, F., and An-dronova, N. G.: The UIUC three-dimensional stratospheric chemical transport model: Description and evaluation of the sim-ulated source gases and ozone, J. Geophys. Res., 104, 11755– 11781, 1999.
Schove, D. J.: The biennial oscillation, tree rings and sunspots, Weather, 24, 390–397, 1969.
Stenke, A., Schraner, M., Rozanov, E., Egorova, T., Luo, B., and Peter, T.: The SOCOL version 3.0 chemistry-climate model: description, evaluation, and implications from an ad-vanced transport algorithm, Geosci. Model Dev., 6, 1407–1427, doi:10.5194/gmd-6-1407-2013, 2013.
Stickler, A., Grant, A. N., Ewen, T., Ross, T. F., Vose, R. S., Comeaux, J., Bessemoulin, P., Jylhä, K., Adam, W. K., Jeannet, P., Nagurny, A., Sterin, A. M., Allan, R., Compo, G. P., Griesser, T., and Brönnimann, S.: The comprehensive historical upper-air network, B. Am. Meteorol. Soc., 91, 741–751, 2010.
Stickler, A., Brönnimann, S., Jourdain, S., Roucaute, E., Sterin, A., Nikolaev, D., Valente, M. A., Wartenburger, R., Hersbach, H., Ramella-Pralungo, L., and Dee, D.: Description of the ERA-CLIM historical upper-air data, Earth Syst. Sci. Data, 6, 29–48, doi:10.5194/essd-6-29-2014, 2014a.
Stickler, A., Brönnimann, S., Valente, M. A., Bethke, J., Sterin, A., Jourdain, S., Roucaute, E., Vasquez, M. V., Reyes, D. A., Guz-man, J. G., Allan, R., and Dee, D.: ERA-CLIM: Historical Sur-face and Upper-Air Data for Future Reanalyses, B. Am. Meteo-rol. Soc., 95, 1419–1430, 2014b.
Stickler, A., Storz, S., Jörg, C., Wartenburger, R., Hersbach, H., Compo, G. P., Poli, P., Dee, D., and Brönnimann, S.: Upperair ob-servations from the German Atlantic Expedition (1925–27) and comparison with the Twentieth Century and ERA20C reanalyses, Meteorol. Z., 24, 525–544, 2015.
Stuecker, M. F., Timmermann, A., Yoon, J., and Jin, F.-F.: Tropo-spheric Biennial Oscillation (TBO) indistinguishable from white noise, Geophys. Res. Lett., 42, 7785–7791, 2015.
1908), Meteorol. Z., 27, 536–542, 1910 (translated and edited by: Volken, E. and Brönnimann, S., Meteorol. Z., 22, 343–348, 2013).
Tripathi, O. P., Baldwin, M., Charlton-Perez, A., Charron, M., Eck-ermann, S. D., Gerber, E., Harrison, R. G., Jackson, D. R., Kim, B.-M., Kuroda, Y., Lang, A., Mahmood, S., Mizuta, R., Roff, G., Sigmond, M., and Son, S.-W.: The predictability of the ex-tratropical stratosphere on monthly time-scales and its impact on the skill of tropospheric forecasts, Q. J. Roy. Meteor. Soc., 141, 987–1003, doi:10.1002/qj.2432, 2015.
Uppala, S. M., Kållberg, P. W., Simmons, A. J., Andrae, U., Bech-told, V. Da Costa, Fiorino, M., Gibson, J. K., Haseler, J., Her-nandez, A., Kelly, G. A., Li, X., Onogi, K., Saarinen, S., Sokka, N., Allan, R. P., Andersson, E., Arpe, K., Balmaseda, M. A., Beljaars, A. C. M., Berg, L. Van De, Bidlot, J., Bormann, N., Caires, S., Chevallier, F., Dethof, A., Dragosavac, M., Fisher, M., Fuentes, M., Hagemann, S., Hólm, E., Hoskins, B. J., Isaksen, L., Janssen, P. A. E. M., Jenne, R., McNally, A. P., Mahfouf, J.-F., Morcrette, J.-J., Rayner, N. A., Saunders, R. W., Simon, P., Sterl, A., Trenberth, K. E., Untch, A., Vasiljevic, D., Viterbo, P., and Woollen, J.: The ERA-40 re-analysis, Q. J. Roy. Meteor. Soc., 131, 2961–3012, 2005.
van Bemmelen, W.: Die Wind-verhältnisse in den oberen Luftschichten nach Ballonvisierungen in Batavia, Koninklijk Magnetisch en Meteorologisch Observatorium te Batavia, Ver-handelingen No. 1, 1911.
van Bemmelen, W. and Braak, C.: Preliminary report upon the in-vestigation of the upper air-layers begun at Batavia in 1909, Verh. K. Akad. Van Wetensch. te Amsterdam [Proceedings of the Royal Netherlands Academy of Arts and Sciences, Amsterdam] 13 I, 149–157, 1910.
Vecchi, G. A. and Knutson, T. R.: Estimating annual numbers of Atlantic hurricanes missing from the HURDAT database (1878– 1965) using ship track density, J. Climate, 24, 1736–1746, 2011. Vecchi, G. A. and Soden, B. J.: Global warming and the weakening
of the tropical circulation, J. Climate, 20, 4316–4340, 2007. Veryard, R. G. and Ebdon, R. A.: Fluctuations in tropical
strato-spheric winds, Meteorol. Mag., 90, 125–143, 1961.
Wang, B., Wu, R., and Lau, K. M.: Interannual variability of the Asian summer monsoon: Contrasts between the Indian and the western North Pacific-East Asian monsoons, J. Climate, 14, 4073–4090, 2001.
Wilks, D. S.: Statistical methods in atmospheric sciences, 2nd Edn., Academic Press, 2006.
Woeikof, A.: Die Schneedecke in “paaren” und “unpaaren” Win-tern, Meteorol. Z., 12, 77–78, 1895.