Article
Comparison of Serum Ferritin and Vitamin D in
Association with the Severity of Nonalcoholic Fatty Liver
Disease in Korean Adults
Dong Wook Jeong1,2, Hye Won Lee2,3, Young Hye Cho1,2, Dong Won Yi2,3, Sang Yeoup Lee1,2, Seok Man Son2,3, Yang Ho Kang2,3
1Department of Family Medicine, 2Research Institute for Convergence of Biomedical Science and Technology, 3Division of Endocrinology and Metabolism, Department of Internal Medicine, Pusan National University Yangsan Hospital, Pusan National University School of Medicine, Yangsan, Korea
Background: Increased serum ferritin and decreased vitamin D levels associated with nonalcoholic fatty liver disease (NAFLD). However, their association with the severity of NAFLD has not been fully evaluated. The aim of this study was to compare the association of serum ferritin and 25(OH)D3 levels with the severity of ultrasonographically detected NAFLD (US-NAFLD) and
hepatic steatosis defined by fatty liver index (FLI) in Korean adults.
Methods: A cross-sectional analysis of clinical and anthropometric data, including serum ferritin and 25(OH)D3, from men
(n=295) and women (n=263) who underwent a routine health check-up in 2012.
Results: In men, with an increase in the quartile of serum ferritin level, the incidences of subjects with metabolic syndrome (P=0.002), US-NAFLD (P=0.041), and FLI ≥60 (P=0.010) were significantly elevated. In women, the incidence of subjects with US-NAFLD was also significantly elevated with increases in the serum ferritin quartile (P=0.012). Regarding 25(OH)D3, no
statistical differences were observed among the different quartiles in either gender. Serum ferritin level significantly increased as the severity of US-NAFLD increased (P<0.001); however, no significant differences in 25(OH)D3 level were observed in men.
No significant differences in either serum ferritin or 25(OH)D3 level were observed among women with different levels of severity
of US-NAFLD.
Conclusion: Increased serum ferritin level showed a closer association with severity of NAFLD compared with level of serum vi-tamin D, suggesting that serum ferritin level may be a better marker than vivi-tamin D level for predicting the severity of US-NAFLD and hepatic steatosis in a clinical setting.
Keywords: Ferritin; Vitamin D; Nonalcoholic fatty liver disease; Metabolic syndrome
INTRODUCTION
Nonalcoholic fatty liver disease (NAFLD) refers to fat
accu-mulation in the liver exceeding 5% to 10% by weight in the ab-sence of excessive alcohol consumption and is now considered to be the hepatic component of metabolic syndrome (MetS)
Received: 27 February 2014, Revised: 9 April 2014, 28 April 2014 Accepted: 1 May 2014
Corresponding author: Yang Ho Kang
Department of Internal Medicine, Pusan National University Yangsan Hospital, Pusan National University School of Medicine, 20 Geumo-ro, Yangsan 626-787, Korea Tel: +82-55-360-2358, Fax: +82-55-360-1565, E-mail: kangyh@pusan.ac.kr
Copyright © 2014 Korean Endocrine Society
[1-3], a constellation of risk factors for cardiovascular diseas-es, including insulin resistance, abdominal obesity, dyslipid-emia, glucose intolerance, and hypertension [4,5]. The preva-lence of NAFLD is increasing and has been estimated to range from 10% to 24% worldwide [6], including Asian populations [7]. NAFLD reflects insulin resistance, and patients with NAFLD are also likely to have the component disorders of MetS [8]. Although abdominal ultrasonography (US) has been found to be not sufficiently sensitive to detect liver inflammation and fibrosis, it has been shown to reveal a good correlation with histological findings of fatty infiltration and has been used for the diagnosis of different degrees of steatosis [9-11]. More-over, a recent study showed that ultrasonographically-detected NAFLD (US-NAFLD) is an independent predictor for insulin resistance in nonobese, nondiabetic middle-aged Asian adults [12]. There are some markers for the identification of liver ste-atosis that are used to determine the severity of fatty liver [3], such as NAFLD liver fat score [13], and fatty liver index (FLI) [14].
There have been several cross-sectional studies that showed that an elevated serum ferritin levels associated with insulin resistance and NAFLD [15,16]. One recent large-scale study demonstrated that increased serum ferritin level was an inde-pendent risk factor of incident fatty liver detected by US, even in nonobese, healthy Korean men [17]. In association with MetS, one large, prospective study in middle-aged Korean men reported that elevated serum ferritin level showed an in-dependent association with future development of MetS dur-ing a 5-year follow-up period [18].
Decreased vitamin D level has also been demonstrated to have an association with insulin resistance and cardiovascular risk factors, including MetS [19-22]. One large, cross-section-al study of hecross-section-althy Korean men reported that participants with higher serum vitamin D level assessed by serum 25-hydroxyvi-tamin D3 showed a significantly reduced risk for NAFLD
compared with patients with low vitamin D, independent of obesity and MetS [23].
Although several studies have examined the associations of serum ferritin and vitamin D with NAFLD, few studies have evaluated whether these markers predict the severity of NAFLD. In addition, to the best of our knowledge, there has been little data reported on the associations of serum ferritin and vitamin D with NAFLD in women. Therefore, we evaluated the asso-ciations of these two recently identified metabolic markers with the severity of NAFLD as defined by US and FLI in both genders.
METHODS
Study subjects
We used data from Korean adults who participated in a compre-hensive health examination at Pusan National University Yangsan Hospital in Yangsan, Korea in 2012 (n=3,380) and evaluated subjects who had data that included both serum ferritin and vita-min D (n=695) and performed a medical chart review. There were no subjects who had a history of excessive alcohol intake (>20 g/day) or medication use that could affect the development of NAFLD. Of the 695 subjects, we excluded adults with liver or hepatobiliary disease (n=47), positive serologic markers for hep-atitis B or C virus (n=33), low hemoglobin level (<10 g/dL; n=8), elevated white blood cell count (>10,000/mm3
; n=7), ele-vated high sensitivity C-reactive protein (hs-CRP) level (>10.0 mg/L; n=5), or highly elevated serum ferritin level (>300 ng/ mL; n=27). Finally, 558 adults (295 men, 263 women) were en-rolled in the analysis. Informed consent for use of the health screening data in the research was obtained from the subjects. This study was approved by the Institutional Review Board of Pusan National University Yangsan Hospital.
Anthropometric and biochemical data
chemi-luminescent immunoassay (CLIA, Liaison, DiaSorin, Italy). The homeostasis model assessment of insulin resistance (HOMA-IR) index was calculated using the following formula:
HOMA-IR=[fasting serum insulin (mU/L)×fasting plasma glucose (mmol/L)]/22.5
Ultrasound is currently the most commonly used tool for screening asymptomatic patients with elevated liver enzymes and suspected NAFLD [3]. US findings of fatty liver include hepatomegaly, diffuse increases in echogenicity of liver paren-chyma, and vascular blunting. Nonsteatotic hepatic parenchy-ma exhibits an echotexture similar to that of renal parenchyparenchy-ma but becomes “brighter” when infiltrated with fat [10]. Abdomi-nal US was performed by one experienced radiologist who was blinded to the subjects’ clinical statuses, using a 3.5-MHz trans-ducer (Acuson Sequoia 512 scanner, Siemens Medical Solu-tions, Mountain View, CA, USA). Images were captured in a standard fashion with the patient in the supine position with the right arm raised above the head [24]. A US-NAFLD was de-fined as the presence of a diffuse increase in fine echoes in liver parenchyma compared to kidney or spleen parenchyma [25]. The severity of US-NAFLD was defined as follows: mild, slightly diffuse increase in fine echoes in the hepatic parenchy-ma with norparenchy-mal visualization of the diaphragm and intrahepatic vessel borders; moderate, moderate diffuse increase in fine echoes with slightly impaired visualization of the diaphragm and intrahepatic vessels; severe, marked increase in fine echoes with poor or no visualization of the diaphragm, intrahepatic vessels, and posterior portion of the right lobe of the liver [26]. NAFLD was also determined by the FLI using metabolic parameters, such as TG, BMI, GGT, and waist circumference. The calculation formula of FLI was as follows [14,27] and an FLI ≥60 was considered to indicate hepatic steatosis:
FLI=[e 0.953×loge (TG)+0.139×BMI+0.718×loge (GGT) +0.053×waist circumference–15.745)]/[1+e 0.953×loge (TG)+0.139×BMI+0.718×loge (GGT)+0.053×waist circum-ference–15.745]×100
MetS was defined according to the modified, revised Na-tional Cholesterol Education Program Adult Treatment III as the presence of three or more of the following criteria [28,29]: (1) abdominal obesity defined as waist circumference >90 cm; (2) impaired fasting glucose as defined by FBG ≥100 mg/dL; (3) high TG as defined by TG ≥150 mg/dL (for con-version to mmol/L, multiply by 0.01129); (4) low HDL-C as defined by HDL-C <40 mg/dL in men and <50 mg/dL in women (for conversion to mmol/L, multiply by 0.02586); and (5) blood pressure ≥130/85 mm Hg.
Statistical analyses
All data are given as mean±SD for continuous variables. Me-dian values are also indicated in the case of TG, GGT, and
hs-Table 1. Clinical Characteristics of Subjects (n=558)
Parameter Men (n=295) Women (n=263) P value
Age, yr 42.7±6.1 40.5±5.4 0.000
BMI, kg/m2 24.2±2.8 22.5±3.2 0.000
WC, cm 86.2±7.0 77.9±8.1 0.000
SBP, mm Hg 115.3±10.5 110.0±12.2 0.000
DBP, mm Hg 76.3±8.7 71.1±9.3 0.000
FBG, mg/dL 92.3±12.1 88.1±15.4 0.007
HbA1c, % 5.5±0.5 5.4±0.6 0.016
WBC, ×103
cells/uL 6.2±1.6 5.5±1.4 0.000
Hb, g/dL 15.3±0.9 12.9±0.9 0.000
TC, mg/dL 206.4±34.6 195.0±32.0 0.000
TG (median), mg/dL 151.0±98.8 (128.0)
90.0±55.4 (78.0)
0.000
HDL-C, mg/dL 51.3±11.1 62.2±13.9 0.000
LDL-C, mg/dL 129.8±31.6 113.7±27.3 0.000
AST, IU/L 25.0±8.1 20.6±9.1 0.000
ALT, IU/L 29.1±19.8 17.5±15.1 0.000
GGT (median), IU/L 43.3±29.8 (32.0)
21.6±21.5 (16.0)
0.000
BUN, mg/dL 14.5±3.0 12.4±3.2 0.000
Creatinine, mg/dL 0.9±0.1 0.7±0.1 0.000
hs-CRP (median), mg/dL
0.13±0.25 (0.07)
0.11±0.35 (0.03)
0.000
Ferritin,ng/mL 149.5±60.4 42.1±35.1 0.000
Iron, ug/dL 140.1±43.9 110.1±47.2 0.000
TIBC, ug/dL 328.6±47.9 344.9±59.7 0.000
25(OH)D3, ng/mL 18.5±6.4 15.2±5.5 0.000
HOMA-IR 1.24±0.95 1.12±0.68 0.076
MetS, % 16.6 8.0 0.001
US-NAFLD, % 44.7 15.2 0.000
FLI >60, % 21.4 4.2 0.000
CRP, which have skewed distributions. To evaluate the associa-tions of ferritin and 25(OH)D3 with other variables, we
per-formed Pearson partial correlation coefficients analyses, adjust-ing for age. Components of MetS and other clinical character-istics were compared between subjects with and without MetS using independent-sample Student t test and Mann-Whitney U test in variables with a skewed distribution. All subjects were divided into quartiles based on the distribution of serum ferritin and 25(OH)D3. The prevalence of MetS, NAFLD, and FLI
>60 in each quartile was indicated as a percent and compared
using the chi-square test. Finally, the mean ferritin and 25(OH) D3 levels were compared with regard to the severity of
US-NAFLD using one-way analysis of variance analysis followed by post hoc testing using the S-N-K test. Statistical analyses were performed using an SPSS version 17.0 (SPSS Inc., Chi-cago, IL, USA). A probability value less than 0.05 was consid-ered significant.
RESULTS
Mean ferritin level was 149.5±60.4 ng/mL in men and 42.1± 35.1 ng/mL in women. Mean 25(OH)D3 level was 18.5±6.4
ng/mL in men and 15.2±5.5 ng/mL in women. MetS was di-agnosed in 49 men (16.6%) and 21 women (8.0%). Regarding hepatic steatosis, US-NAFLD was diagnosed in 132 men (44.7%) and 40 women (15.2%). FLI ≥60 was diagnosed in 63 men (21.4%) and 11 in women (4.2%) (Table 1).
In a partial correlation analysis adjusted for age, ferritin level showed significant positive correlations with waist cir-cumference (r=0.179, P=0.002), BMI (r=0.166, P=0.005), aspartate aminotransferase (AST; r=0.284, P<0.001), alanine aminotransferase (ALT; r=0.314, P<0.001), log (GGT) (r=0.187, P=0.001], log (hs-CRP) (r=0.117, P=0.046), and FLI (r=0.148, P=0.011] in men and showed significant posi-tive correlations with waist circumference (r=0.131, P= 0.034), ALT (r=0.152, P=0.014), log (GGT) (r=0.192,
Table 2. Partial Age-Adjusted Correlation Coefficients of Ferritin, 25(OH)D3, and Metabolic Risk Factors
Parameter Men Women
Ferritin 25(OH)D3 Ferritin 25(OH)D3
Ferritin - –0.036 (0.535) - 0.160 (0.009)
25(OH)D3 –0.036 (0.535) - 0.160 (0.009)
-WC 0.179 (0.002)a
–0.042 (0.471) 0.131 (0.034)a
–0.030 (0.624)
BMI 0.166 (0.005)a –0.037 (0.527) 0.110 (0.077) –0.051 (0.412)
SBP 0.083 (0.159) –0.033 (0.579) 0.079 (0.204) 0.012 (0.848)
DBP 0.097 (0.097) –0.008 (0.896) 0.047 (0.449) –0.018 (0.772)
FBG 0.025 (0.666) –0.051 (0.385) 0.075 (0.224) 0.005 (0.939)
HbA1c –0.016 (0.789) –0.066 (0.259) –0.029 (0.637) 0.023 (0.716)
WBC 0.065 (0.269) –0.059 (0.316) 0.038 (0.541) –0.053 (0.393)
AST 0.284 (0.000)a –0.028 (0.639) 0.099 (0.108) –0.004 (0.953)
ALT 0.314 (0.000)a –0.068 (0.246) 0.152 (0.014)a –0.021 (0.741)
Log (TG) –0.003 (0.953) –0.232 (0.000)a 0.006 (0.925) –0.080 (0.197)
HDL-C –0.068 (0.250) 0.104 (0.075) –0.090 (0.144) 0.011 (0.855)
Log (GGT) 0.187 (0.001)a –0.061 (0.295) 0.192 (0.002)a –0.044 (0.482)
Log (hs-CRP) 0.117 (0.045)a 0.055 (0.345) 0.171 (0.006)a –0.046 (0.460)
HOMA-IR –0.020 (0.727) –0.103 (0.077) 0.001 (0.987) –0.064 (0.300)
FLI 0.148 (0.011)a –0.130 (0.026)a 0.109 (0.077) –0.045 (0.466)
Values are expressed as coefficient r (P value).
WC, waist circumference; BMI, body mass index; SBP, systolic blood pressure; DBP, diastolic blood pressure; FBG, fasting blood glucose; HbA1c, glycated hemoglobin; WBC, white blood cell; AST, aspartate aminotransferase; ALT, alanine aminotransferase; TG, triglycerides; HDL-C, high den-sity lipoprotein cholesterol; GGT, gamma-glutamyltransferase; hs-CRP, high sensitivity C-reactive protein; HOMA-IR, homeostasis model assess-ment of insulin resistance; FLI, fatty liver index.
P=0.002), and log (hs-CRP) (r=0.171, P=0.006) in women. In contrast, 25(OH)D3 showed significant negative
correla-tions with log (TG) (r=–0.238, P<0.001) and FLI (r=–0.130, P=0.026) in men, while there was no significant correlation between 25(OH)D3 and any parameters in women (Table 2).
Serum ferritin level was significantly increased in men with obesity (163.9±58.6 ng/dL vs. 143.5±60.2 ng/dL, P=0.008), MetS (171.4±64.2 ng/dL vs. 145.1±58.7 ng/dL, P=0.010), US-NAFLD (157.5±63.1 ng/dL vs. 142.9±57.4 ng/dL, P= 0.042), and FLI ≥60 (165.1±64.3 ng/dL vs. 145.2 ± 58.7 ng/ dL, P=0.029). Serum 25(OH)D3 level was significantly
de-creased only in men with hyper-TG (17.4±6.3 ng/dL vs. 19.2± 6.4 ng/dL, P=0.021). In women, ferritin level was significantly increased in subjects with obesity (50.5±44.3 ng/dL vs. 37.7± 28.4 ng/dL, P=0.015) and US-NAFLD (54.3±41.6 ng/dL vs. 39.9±33.5 ng/dL, P=0.045), and 25(OH)D3 level was
signifi-cantly decreased only in subjects with MetS (13.3±4.2 ng/dL vs. 15.4±5.5 ng/dL, P=0.046) (Table 3).
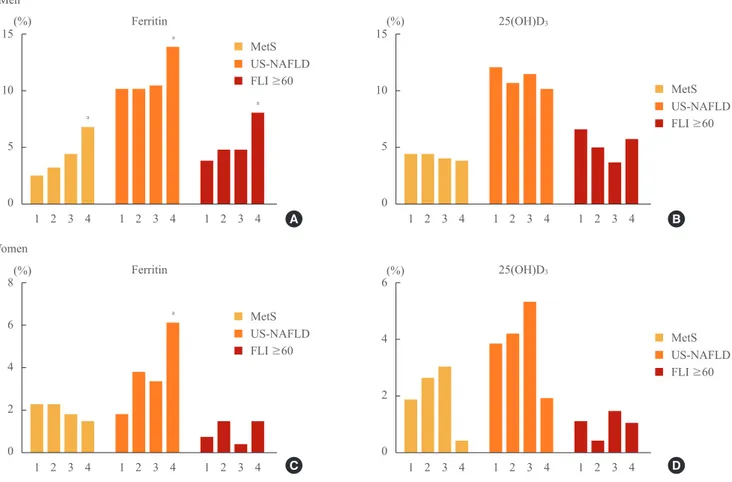
With an increase in the quartile of serum ferritin level, the
in-cidences of subjects with MetS (2.4%, 3.1%, 4.4%, 6.8%; P= 0.002), US-NAFLD (10.2%, 10.2%, 10.5%, 14.9%; P=0.041), and FLI ≥60 (3.7%, 4.7%, 4.7%, 8.1%; P=0.010) were signifi-cantly increased in men. In women, only the incidence of sub-jects with US-NAFLD increased significantly with the increase of the quartile of serum ferritin level (1.9%, 3.8%, 3.4%, 6.1%; P=0.012). Regarding 25(OH)D3, no statistical differences were
observed among quartiles in either gender (Fig. 1).
Serum ferritin level was significantly increased as the se-verity of US-NAFLD increased from normal to severe (nor-mal, 142.9±57.4; mild, 142.2±57.9; moderate, 166.3±68.4; severe, 200.4±49.0 ng/mL; P<0.001). However, no signifi-cant differences were observed in 25(OH)D3 level (normal,
18.7±6.0; mild, 18.4±5.8; moderate, 18.5±9.3; severe, 17.0± 5.0 ng/mL) in men. No significant differences in either serum ferritin or 25(OH)D3 level were observed among women with
different severities of US-NAFLD (Fig. 2).
Table 3. Comparison of Mean Ferritin and 25(OH)D3 Levels between Subjects with and without Each Metabolic Component Disorder
Disorder Ferritin 25(OH)D3
With Without P value With Without P value
Men (n=295)
Obesity (n=85) 163.9±58.6a 143.5±60.2a 0.008a 18.2±5.6 18.6±6.7 0.611
HTN (n=65) 160.3±71.0 146.3±56.8 0.149 18.9±6.4 18.4±6.4 0.590
IFG (n=52) 154.8±72.1 148.±57.6 0.542 18.0±6.8 18.6±6.3 0.550
Hyper-TG (n=111) 150.5±59.2 148.8±61.2 0.817 17.4±6.3 19.2±6.4 0.021
Hypo-HDL (n=42) 156.3±64.5 148.3±59.7 0.452 17.8±5.8 18.6±6.5 0.423
MetS (n=49) 171.4±64.2a
145.1±58.7a
0.010a
17.6±6.2 18.7±6.5 0.268
US-NAFLD (n=132) 157.5±63.1a 142.9±57.4a 0.042a 18.2±6.9 18.7±6.0 0.523
FLI (≥60) (n=63) 165.1±64.3a 145.2±58.7a 0.029a 17.6±6.1 18.8±6.5 0.175
Women (n=263)
Obesity (n=90) 50.5±44.3a 37.7±28.4a 0.015a 14.4±4.8 15.6±5.8 0.070
HTN (n=29) 38.7±27.6 42.5±35.9 0.505 14.7±5.5 15.3±5.5 0.610
IFG (n=21) 50.9±39.9 41.3±34.6 0.299 13.9±3.8 15.3±5.6 0.120
Hyper-TG (n=23) 47.1±45.5 41.6±34.0 0.578 14.7±4.9 15.3±5.5 0.620
Hypo-HDL (n=51) 41.5±25.8 42.3±37.1 0.869 14.6±5.3 15.4±5.5 0.205
MetS (n=21) 34.4 ±26.4 42.8±35.7 0.185 13.3±4.2a 15.4±5.5a 0.046a
US-NAFLD (n=40) 54.3±41.6a 39.9±33.5a 0.045a 14.4±4.9 15.4±5.6 0.277
FLI (≥60) (n=11) 41.3±27.4 42.2±35.5 0.923 16.1±6.1 15.2±5.5 0.655
Values are expressed as mean±SD.
HTN, hypertension; IFG: impaired fasting glucose; Hyper-TG, hyper-triglyceridemia; Hypo-HDL, hypo-high density lipoprotein cholesterol; MetS, metabolic syndrome; US-NAFLD, ultrasonographically-detected nonalcoholic fatty liver disease; FLI, fatty liver index.
DISCUSSION
In this study, serum ferritin level showed a significant increase with severity of US-NAFLD, and increase in the quartile of se-rum ferritin level was significantly associated with the inci-dence of US-NAFLD in men. On the other hand, no significant differences in 25(OH)D3 level were observed among the
de-grees of severity in NAFLD and the incidence of US-NAFLD also showed no statistical differences among the dif-ferent quartiles of 25(OH)D3 level, suggesting that serum
ferri-tin level may have a closer association in men with the severity of US-NAFLD compared with serum vitamin D. Serum ferritin level showed significant positive correlations with waist cir-cumference, BMI, AST, ALT, log (GGT), and log (hs-CRP). Ferritin level was significantly increased in obese subjects and
those with MetS. However, 25(OH)D3 level in men showed a
significant negative correlation only with log (TG) and was significantly decreased only in the hyper-TG group. In hepatic steatosis, these two markers showed a significant association with FLI, positive for ferritin and negative for 25(OH)D3.
Se-rum ferritin level was significantly increased in subjects with US-NAFLD and FLI ≥60; however, there were no significant differences in 25(OH)D3 level between subjects with and
with-out US-NAFLD or FLI ≥60. These data also may suggest that ferritin level more closely reflects hepatic steatosis compared with vitamin D level. Regarding the association of serum ferri-tin with hepatic steatosis, Kowdley et al. [30] reported that a serum ferritin level >1.5×the upper limit of normal is associ-ated with worsened histologic activity and is an independent predictor of advanced hepatic steatosis among patients with bi-15
10
5
0
8
6
4
2
0
15
10
5
0
6
4
2
0
MetS MetS
MetS MetS
US-NAFLD US-NAFLD
US-NAFLD US-NAFLD
FLI ≥60 FLI ≥60
FLI ≥60 FLI ≥60
(%)
(%)
(%)
(%) 1 2 3 4
1 2 3 4
1 2 3 4
1 2 3 4 1 2 3 4
1 2 3 4
1 2 3 4
1 2 3 4 1 2 3 4
1 2 3 4
1 2 3 4
1 2 3 4 Ferritin
Ferritin
25(OH)D3
25(OH)D3
Men
Women
Fig. 1. Incidence of metabolic syndrome (MetS), ultrasonographically-detected nonalcoholic fatty liver disease (US-NAFLD), and fatty liver index (FLI) ≥60 by quartile rankings of serum ferritin and 25(OH)D3 levels. 1, first quartile; 2, second quartile; 3, third quartile; 4, fourth quartile. (A) With an increase in the quartile of ferritin level, the incidences of subjects with MetS, US-NAFLD, and FLI ≥ 60 were significantly increased in men. (B) With an increase in the quartile of vitamin D level, no statistical differences were observed among quar-tiles in men. (C) With an increase in the quartile of ferritin level, only the incidence of subjects with US-NAFLD increased significantly in women. (D) With an increase in the quartile of vitamin D level, no statistical differences were observed among quartiles in women.
aP<0.05 compared with the first quartile using one-way analysis of variance analysis followed by post hoc testing with the S-N-K test.
a
a
a
a
A
C
B
opsy-proven NAFLD. Although NAFLD was defined using US and hepatic steatosis was defined by FLI, our results are consistent with those of that previous study [30].
Most cross-sectional studies regarding the association of decreased serum vitamin D level with NAFLD reported posi-tive results [19-23]. However, Katz et al. [31] reported that vi-tamin D level was not associated with suspected NAFLD as-sessed only by elevated ALT level after adjustment for obesity using the National Health and Nutrition Examination Survey database of 1,630 American adolescents. Furthermore, our study also showed no association of vitamin D level with NAFLD. The current study, using US and FLI instead of ALT levels to define hepatic steatosis, showed some findings that were consistent with those of Katz et al. [31], demonstrating no significant relationship between vitamin D level and hepat-ic steatosis detected by US-NAFLD and FLI and no signifi-cant differences among the different levels of severity of
US-NAFLD.
For women, there were no significant differences in either serum ferritin or 25(OH)D3 level among the different levels of
severity of US-NAFLD, but the incidence of US-NAFLD sig-nificantly increased with an increase in quartile rankings of ferritin level, findings that were not observed with vitamin D level. Serum ferritin level showed a significant positive corre-lation with waist circumference, ALT, log (GGT), and log (hs-CRP) and showed a significant increase among subjects with obesity and US-NAFLD. In the case of vitamin D in women, 25(OH)D3 levels showed no significant correlation with any
metabolic parameters and showed a significant decrease only in the MetS group. Few studies have reported on serum ferri-tin level as a metabolic cardiovascular risk factor in women. In one study by Williams et al. [32], serum ferritin was signifi-cantly associated with CRP, waist circumference, BMI, and TG in 443 women in New Zealand. In this study, waist circum-A
C
B
D
300
200
100
0
150
100
50
0
30
20
10
0
25
20
15
10
5
0
Ferritin
Ferritin
25(OH)D
3
25(OH)D
3
Normal
Normal
Normal
Normal Mild
Mild
Mild
Mild Moderate
Moderate
Moderate
Moderate Severe
Severe
Severe
Severe Men
Women
Fig. 2. Serum ferritin and 25(OH)D3 levels according to the severity of ultrasonographically-detected nonalcoholic fatty liver disease (US-NAFLD). (A) Ferritin level was significantly increased as the se verity of US-NAFLD increased from normal to severe in men. (B) No signifi cant differences were observed in vitamin D level among men with different severities of US-NAFLD. (C) No significant dif-ferences in ferritin level were observed among women with different severities of US-NAFLD. (D) No significant difdif-ferences in vitamin D level were observed among women with different severities of US-NAFLD.
aP<0.001 compared with the first quartile using one-way analysis of variance analysis followed by post hoc testing with the S-N-K test.
ference was a significant predictor of serum ferritin in men, and CRP, a useful marker of systemic inflammation, was the most significant predictor of serum ferritin in women [32]. Our study also demonstrated that serum ferritin showed sig-nificant association with waist circumference, log (GGT), and log (hs-CRP) in both genders, suggesting that serum ferritin may have a close relationship with central obesity and low grade systemic inflammation in both men and women. GGT has also been recognized as a reliable marker of cardiovascu-lar disease, including MetS [33,34] and NAFLD [35,36], and serum ferritin showed significant association with GGT in both genders in our study.
Our study has some limitations. First, it was conducted us-ing a cross-sectional design and thus did not identify a causal relationship between clinical markers and hepatic steatosis, and the total number of enrolled subjects in both genders was relatively small. This limitation may have affected our results that showed no statistical correlation between HOMA-IR and ferritin or 25(OH)D3. Second, we could not obtain social data
such as history of exercise, diet, and smoking, which may af-fect the incidence of hepatic steatosis. Third, the definition of hepatic steatosis and severity were not histologically con-firmed but were made based on US and FLI calculated using related metabolic parameters. Fourth, we did not consider the seasonal variations in serum vitamin D or menopausal status and estrogen level in women, which could have effected the low mean 25(OH)D3 levels in both genders compared with
those in previous reports.
In conclusion, findings of the current study indicate that se-rum ferritin has a closer association with severity of US-NAFLD than does serum vitamin D, reflected by serum 25(OH)D3
lev-els in men and women. Therefore, serum ferritin level may be a better marker than serum vitamin D level for predicting the severity of US-NAFLD and hepatic steatosis in a clinical set-ting.
CONFLICTS OF INTEREST
No potential conflict of interest relevant to this article was re-ported.
ACKNOWLEDGMENTS
This study was supported by a Clinical Research Grant (2013) of Pusan National University Yangsan Hospital.
REFERENCES
1. Tarantino G, Saldalamacchia G, Conca P, Arena A.
Non-al-coholic fatty liver disease: further expression of the meta-bolic syndrome. J Gastroenterol Hepatol 2007;22:293-303.
2. Souza MR, Diniz Mde F, Medeiros-Filho JE, Araujo MS.
Metabolic syndrome and risk factors for non-alcoholic fat-ty liver disease. Arq Gastroenterol 2012;49:89-96.
3. Obika M, Noguchi H. Diagnosis and evaluation of
nonal-coholic fatty liver disease. Exp Diabetes Res 2012;2012: 145754.
4. Grundy SM, Brewer HB Jr, Cleeman JI, Smith SC Jr,
Len-fant C; American Heart Association; National Heart, Lung, and Blood Institute. Definition of metabolic syndrome: re-port of the National Heart, Lung, and Blood Institute/Ameri-can Heart Association conference on scientific issues relat-ed to definition. Circulation 2004;109:433-8.
5. Alberti KG, Zimmet P, Shaw J. Metabolic syndrome: a new
world-wide definition. A Consensus Statement from the In-ternational Diabetes Federation. Diabet Med 2006;23:469-80.
6. Angulo P. Nonalcoholic fatty liver disease. N Engl J Med
2002; 346:1221-31.
7. Fan JG, Zhu J, Li XJ, Chen L, Li L, Dai F, Li F, Chen SY.
Prevalence of and risk factors for fatty liver in a general population of Shanghai, China. J Hepatol 2005;43:508-14.
8. Tarantino G, Finelli C. What about non-alcoholic fatty liver
disease as a new criterion to define metabolic syndrome? World J Gastroenterol 2013;19:3375-84.
9. Saverymuttu SH, Joseph AE, Maxwell JD. Ultrasound
scanning in the detection of hepatic fibrosis and steatosis. Br Med J (Clin Res Ed) 1986;292:13-5.
10. Osawa H, Mori Y. Sonographic diagnosis of fatty liver
us-ing a histogram technique that compares liver and renal cortical echo amplitudes. J Clin Ultrasound 1996;24:25-9.
11. Kim HC, Choi SH, Shin HW, Cheong JY, Lee KW, Lee
HC, Huh KB, Kim DJ. Severity of ultrasonographic liver steatosis and metabolic syndrome in Korean men and women. World J Gastroenterol 2005;11:5314-21.
12. Sinn DH, Gwak GY, Park HN, Kim JE, Min YW, Kim
13. Kotronen A, Peltonen M, Hakkarainen A, Sevastianova K,
Bergholm R, Johansson LM, Lundbom N, Rissanen A, Ridderstrale M, Groop L, Orho-Melander M, Yki-Jarvinen H. Prediction of non-alcoholic fatty liver disease and liver fat using metabolic and genetic factors. Gastroenterology 2009;137:865-72.
14. Bedogni G, Bellentani S, Miglioli L, Masutti F,
Passalac-qua M, Castiglione A, Tiribelli C. The Fatty Liver Index: a simple and accurate predictor of hepatic steatosis in the general population. BMC Gastroenterol 2006;6:33.
15. Hsiao TJ, Chen JC, Wang JD. Insulin resistance and
ferri-tin as major determinants of nonalcoholic fatty liver dis-ease in apparently healthy obese patients. Int J Obes Relat Metab Disord 2004;28:167-72.
16. Zelber-Sagi S, Nitzan-Kaluski D, Halpern Z, Oren R.
NAFLD and hyperinsulinemia are major determinants of serum ferritin levels. J Hepatol 2007;46:700-7.
17. Kim CW, Chang Y, Sung E, Shin H, Ryu S. Serum ferritin
levels predict incident non-alcoholic fatty liver disease in healthy Korean men. Metabolism 2012;61:1182-8.
18. Park SK, Ryoo JH, Kim MG, Shin JY. Association of serum
ferritin and the development of metabolic syndrome in middle-aged Korean men: a 5-year follow-up study. Diabe-tes Care 2012;35: 2521-6.
19. Gagnon C, Lu ZX, Magliano DJ, Dunstan DW, Shaw JE,
Zimmet PZ, Sikaris K, Ebeling PR, Daly RM. Low serum 25-hydroxyvitamin D is associated with increased risk of the development of the metabolic syndrome at five years: results from a national, population-based prospective study (The Australian Diabetes, Obesity and Lifestyle Study: AusDiab). J Clin Endocrinol Metab 2012;97:1953-61.
20. Lim S, Shin H, Kim MJ, Ahn HY, Kang SM, Yoon JW, Choi
SH, Kim KW, Song JH, Choi SI, Chun EJ, Shin CS, Park KS, Jang HC. Vitamin D inadequacy is associated with sig-nificant coronary artery stenosis in a community-based el-derly cohort: the Korean Longitudinal Study on Health and Aging. J Clin Endocrinol Metab 2012;97:169-78.
21. Targher G, Bertolini L, Scala L, Cigolini M, Zenari L,
Falezza G, Arcaro G. Associations between serum 25-hy-droxyvitamin D3 concentrations and liver histology in pa-tients with non-alcoholic fatty liver disease. Nutr Metab Cardiovasc Dis 2007;17:517-24.
22. Barchetta I, Angelico F, Del Ben M, Baroni MG, Pozzilli P,
Morini S, Cavallo MG. Strong association between non al-coholic fatty liver disease (NAFLD) and low 25(OH) vita-min D levels in an adult population with normal serum
liv-er enzymes. BMC Med 2011;9:85.
23. Rhee EJ, Kim MK, Park SE, Park CY, Baek KH, Lee WY,
Kang MI, Park SW, Kim SW, Oh KW. High serum vitamin D levels reduce the risk for nonalcoholic fatty liver disease in healthy men independent of metabolic syndrome. En-docr J 2013;60:743-52.
24. Chang Y, Ryu S, Sung E, Jang Y. Higher concentrations of
alanine aminotransferase within the reference interval pre-dict nonalcoholic fatty liver disease. Clin Chem 2007;53: 686-92.
25. Mathiesen UL, Franzen LE, Aselius H, Resjo M, Jacobsson
L, Foberg U, Fryden A, Bodemar G. Increased liver echo-genicity at ultrasound examination reflects degree of ste-atosis but not of fibrosis in asymptomatic patients with mild/moderate abnormalities of liver transaminases. Dig Liver Dis 2002;34:516-22.
26. Mittelstaedt CA. General ultrasound. New York: Churchill
Livingstone; 1992.
27. Bedogni G, Kahn HS, Bellentani S, Tiribelli C. A simple
index of lipid overaccumulation is a good marker of liver steatosis. BMC Gastroenterol 2010;10:98.
28. Expert Panel on Detection, Evaluation, and Treatment of
High Blood Cholesterol in Adults. Executive summary of the third report of The National Cholesterol Education Pro-gram (NCEP) expert panel on detection, evaluation, and treatment of high blood cholesterol in adults (Adult Treat-ment Panel III). JAMA 2001; 285:2486-97.
29. Grundy SM, Cleeman JI, Daniels SR, Donato KA, Eckel
RH, Franklin BA, Gordon DJ, Krauss RM, Savage PJ, Smith SC Jr, Spertus JA, Costa F; American Heart Associ-ation; National Heart, Lung, and Blood Institute. Diagno-sis and management of the metabolic syndrome: an Ameri-can Heart Association/National Heart, Lung, and Blood Institute Scientific Statement. Circulation 2005;112:2735-52.
30. Kowdley KV, Belt P, Wilson LA, Yeh MM,
Neuschwander-Tetri BA, Chalasani N, Sanyal AJ, Nelson JE; NASH Clin-ical Research Network. Serum ferritin is an independent predictor of histologic severity and advanced fibrosis in patients with nonalcoholic fatty liver disease. Hepatology 2012;55:77-85.
31. Katz K, Brar PC, Parekh N, Liu YH, Weitzman M.
Sus-pected nonalcoholic Fatty liver disease is not associated with vitamin D status in adolescents after adjustment for obesity. J Obes 2010;2010: 496829.
se-rum ferritin with cardiovascular risk factors and inflamma-tion in young men and women. Atherosclerosis 2002;165: 179-84.
33. Kang YH, Min HK, Son SM, Kim IJ, Kim YK. The
asso-ciation of serum gamma glutamyltransferase with compo-nents of the metabolic syndrome in the Korean adults. Dia-betes Res Clin Pract 2007;77:306-13.
34. Liu CF, Zhou WN, Fang NY. Gamma-glutamyltransferase
levels and risk of metabolic syndrome: a meta-analysis of prospective cohort studies. Int J Clin Pract 2012;66:692-8.
35. Tahan V, Canbakan B, Balci H, Dane F, Akin H, Can G,
Hatemi I, Olgac V, Sonsuz A, Ozbay G, Yurdakul I, Senturk H. Serum gamma-glutamyltranspeptidase distinguishes non-alcoholic fatty liver disease at high risk. Hepatogastro-enterology 2008;55:1433-8.